
Okay, who's ready to get off this fighter jet with the crazy pilot who wants to make us ill? I am beginning to equate market activity with G-Force. I DO NOT like to experience Gs physically (I'm not much fun at Magic Mountain) and investing in this environment is similarly uncomfortable. My personal solution is to not get on the ride. I don't think this is over by a long shot and that includes price declines and more volatility. We always talk about 'checking your emotions at the door'. Investors are currently NOT doing this as demonstrated by the VIX. The intraday chart shows that the rising trend has been broken and we have a possible bearish double-top. The minimum downside target would be around 2810 which is below last week's low.
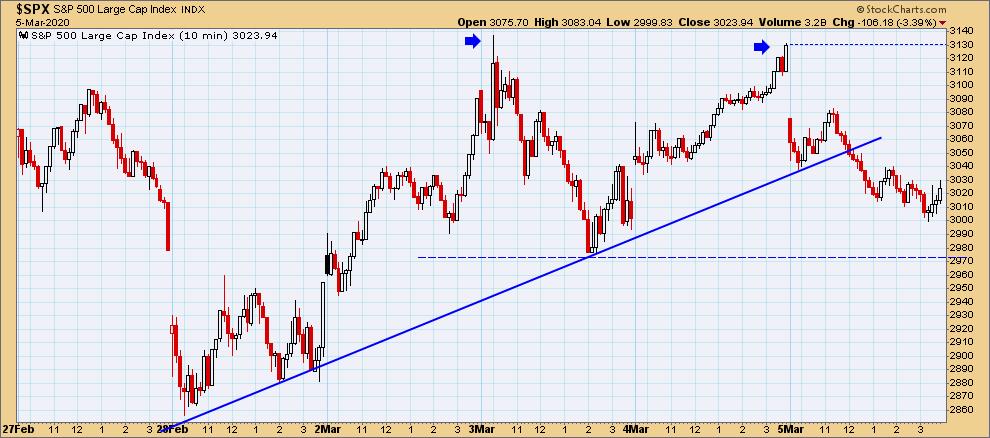
The rising wedge in the short-term is beginning to resolve as expected, to the downside. The PMO is continuing lower. OBV tops are falling while price tops climb. Not good.
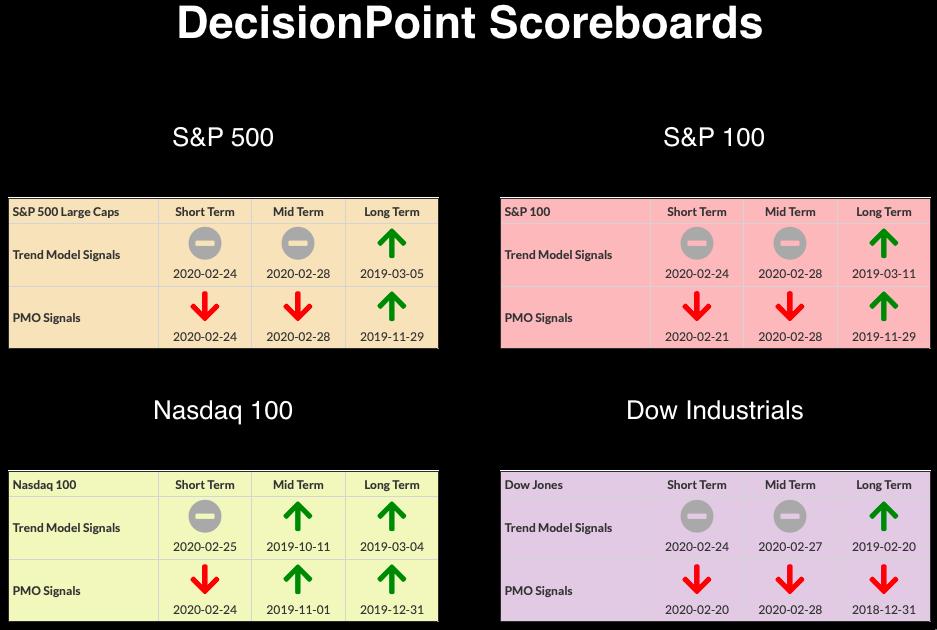
CURRENT BROAD MARKET DP Signals:
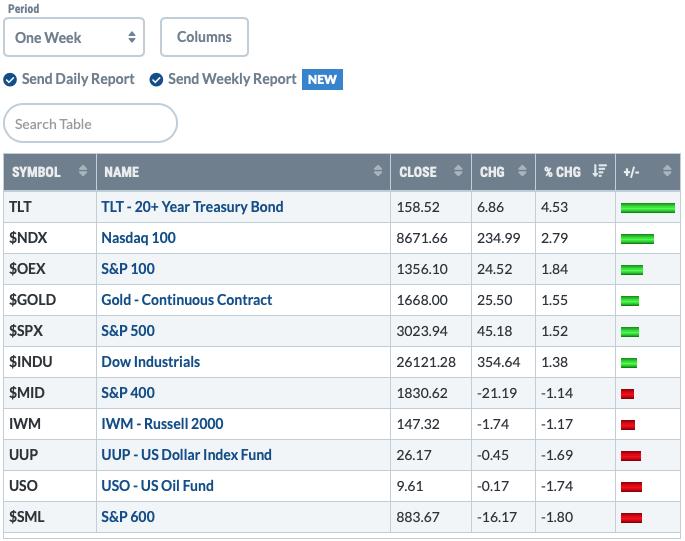
Past WEEK Results:
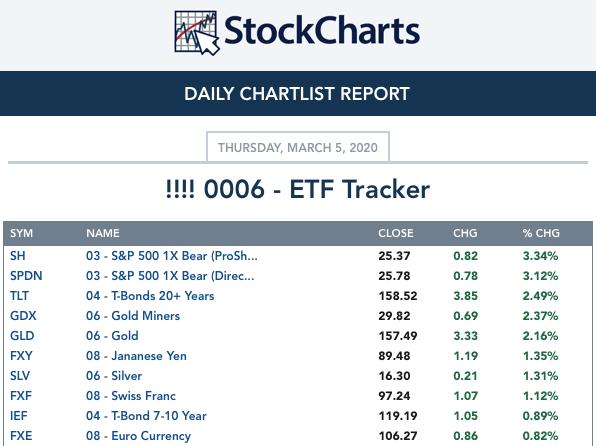
Top 10 from ETF Tracker:
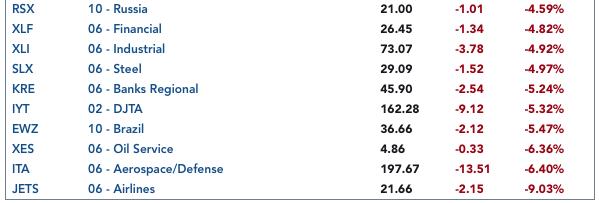
Bottom 10 from ETF Tracker:
On Friday, the DecisionPoint Alert Weekly Wrap presents an assessment of the trend and condition of the stock market (S&P 500), the U.S. Dollar, Gold, Crude Oil, and Bonds. Monday through Thursday the DecisionPoint Alert daily report is abbreviated and covers changes for the day.
Watch the latest episode of DecisionPoint on StockCharts TV's YouTube channel here!
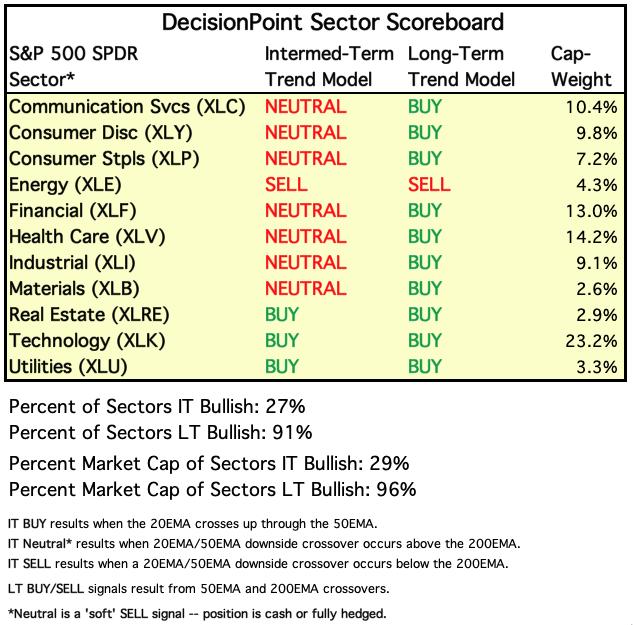
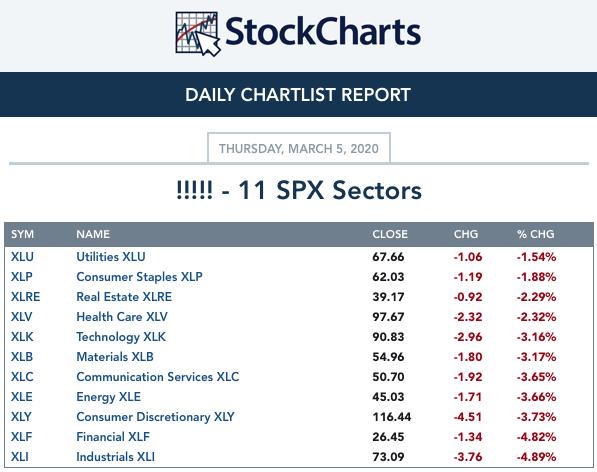
SECTORS
SIGNALS:
Each S&P 500 Index component stock is assigned to one, and only one, of 11 major sectors. This is a snapshot of the Intermediate-Term (Silver Cross) and Long-Term (Golden Cross) Trend Model signal status for those sectors.
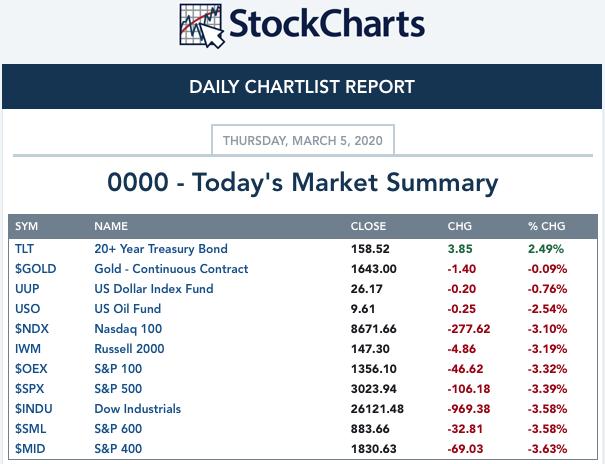
TODAY'S RESULTS:
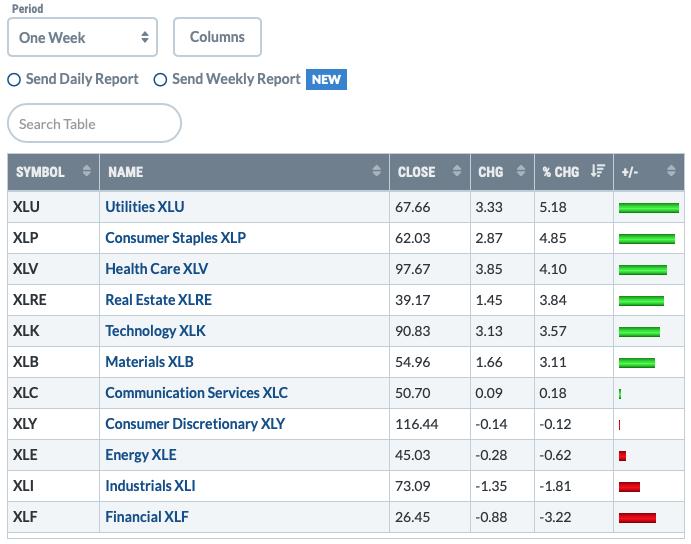
One WEEK Results:
STOCKS
IT Trend Model: NEUTRAL as of 2/28/2020
LT Trend Model: BUY as of 2/26/2019
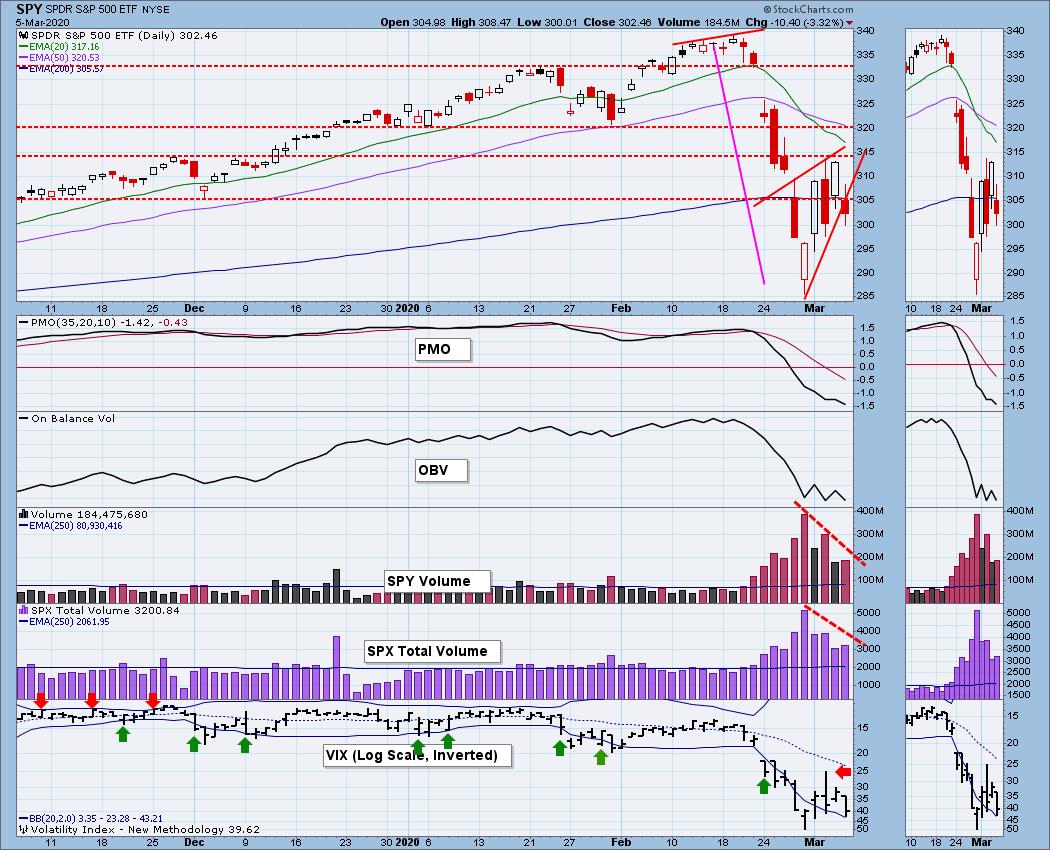
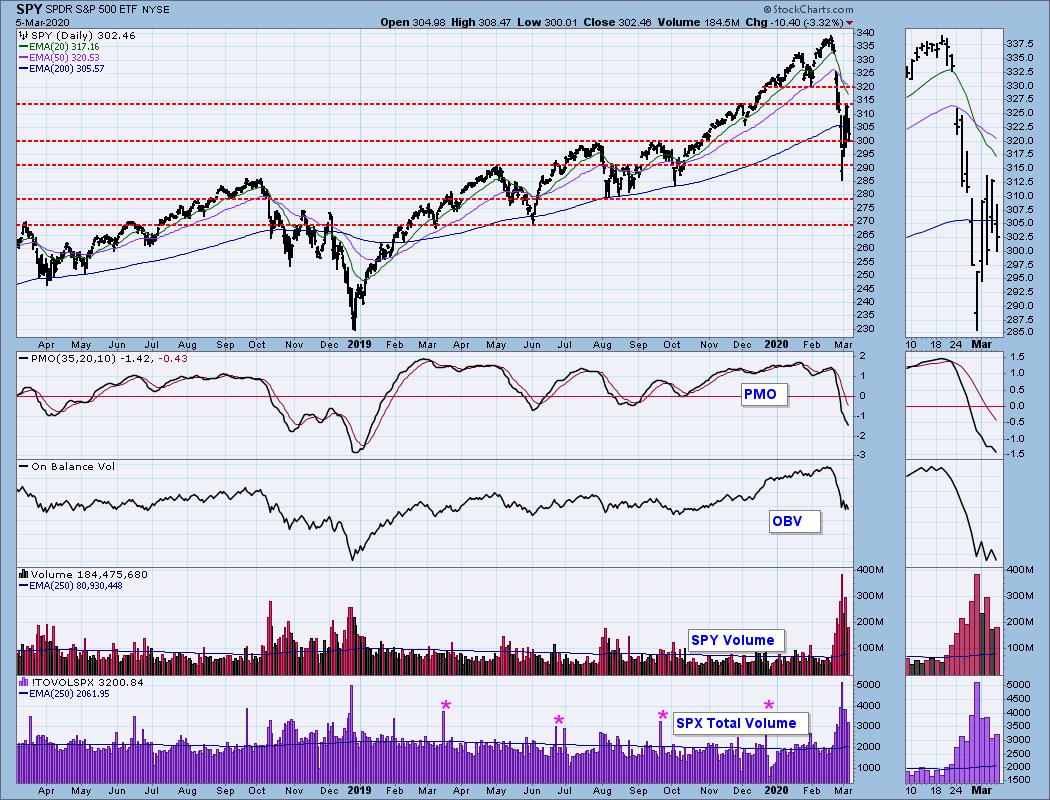
SPY Daily Chart: If you look at the sector leaders from the past week, you'll note they are mostly defensive. Rallies from lows in bear market environments coming from defensive sectors definitely should give you a sense of jumping off thin ice. The ice below you is now gone so when you fall back to that level, it won't be there and you'll have to tread in freezing water. Notice the "blips" on the OBV when upside volume has been coming in. The OBV and PMO are also trending lower right now. Volume declining as price lows rise doesn't inspire confidence. I suppose if you want to look for a redeeming quality, I see downside volume is decreasing.
Climactic Market Indicators: The readings are certainly climactic. Notice we had the VIX beginning to move upward on the inverse scale. Instead of continuing that direction, it immediately turned down at its 20-EMA. Fear still rules this market. I am really not going to attempt to call this an exhaustion or initiation. The readings have fluctuated too much.
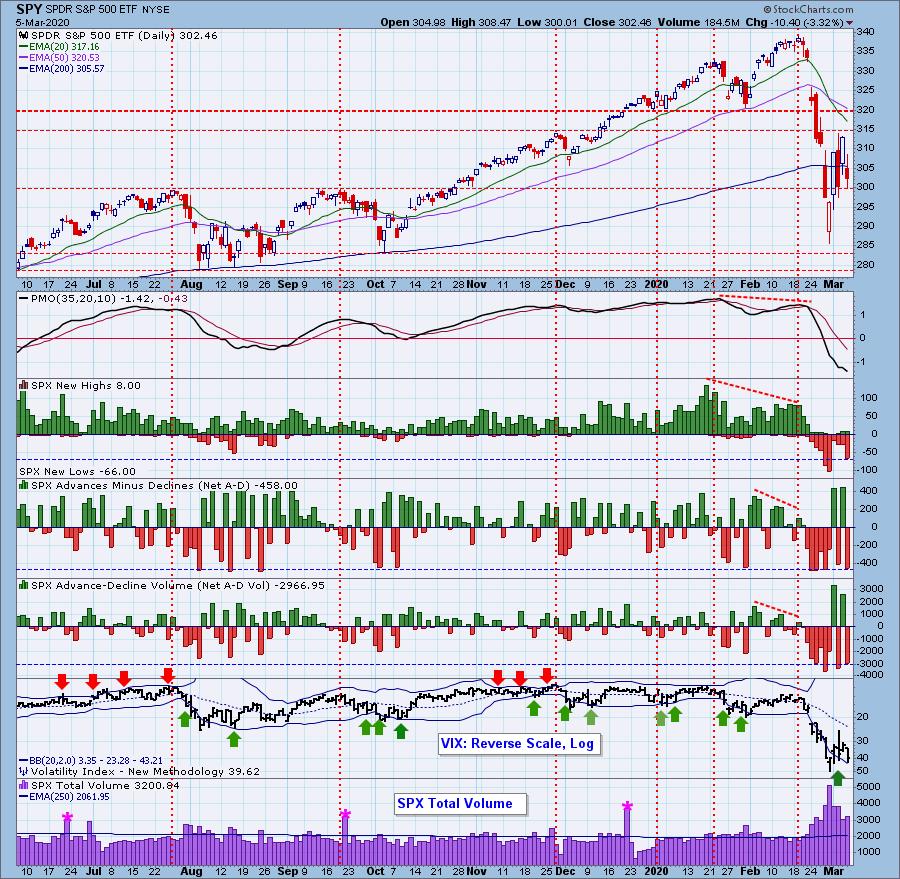
Short-Term Market Indicators: The ST trend is UP and the market condition is NEUTRAL based upon the Swenlin Trading Oscillator (STO) readings. We still have rising bottoms in the very short term, so I would say the trend is still technically 'up'. Notice the STOs have quickly moved into Neutral. That's positive for the near term, but given the %Stocks Above 20-EMA and Rising PMOs are falling, I am not looking for higher prices. Participation is key.
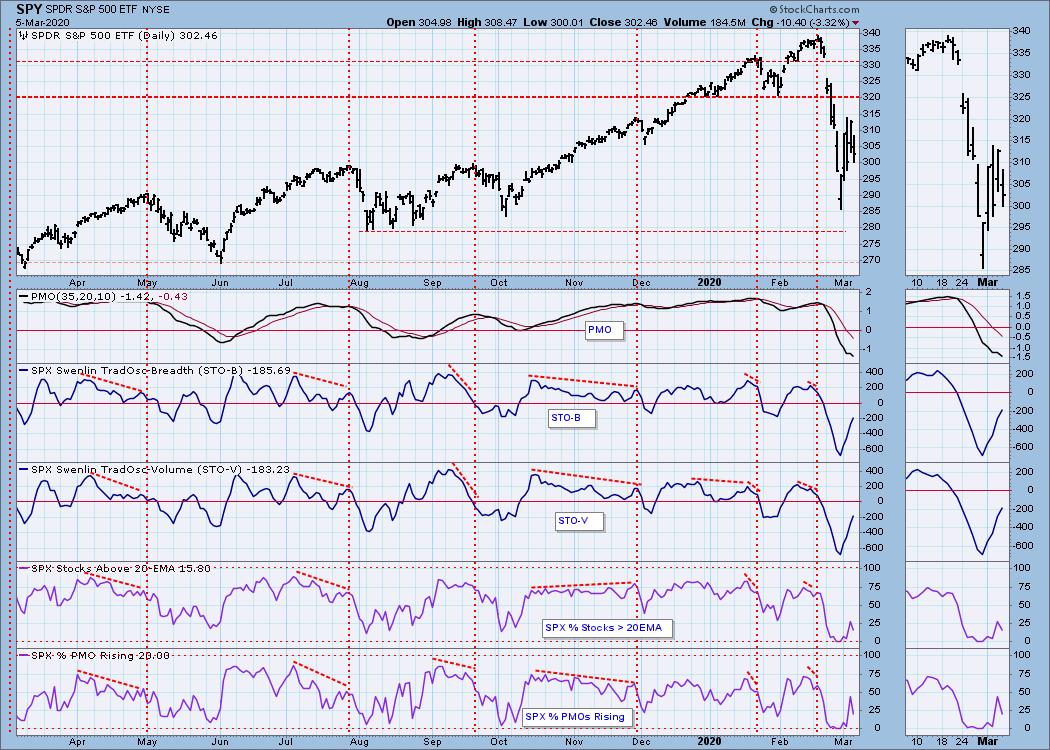
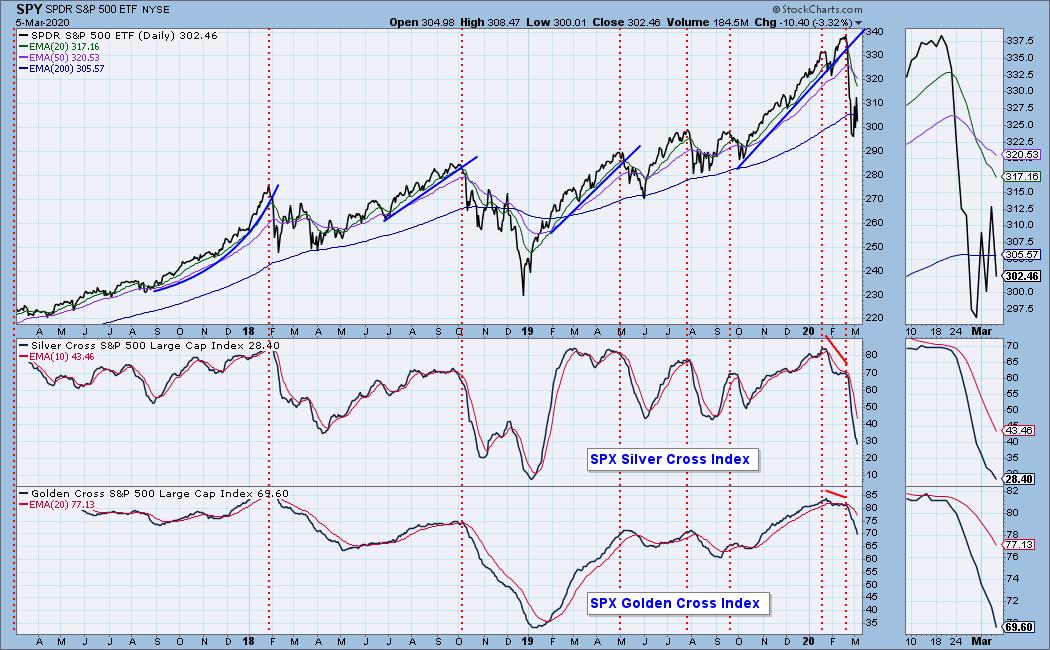
Intermediate-Term Market Indicators: The Silver Cross Index (% of SPX stocks 20EMA > 50EMA) and the Golden Cross Index (percent of SPX stocks 50EMA > 200EMA) are declining. The SCI is now very oversold. The GCI? Not so much. It's finally starting to move into neutral territory; it isn't there yet.
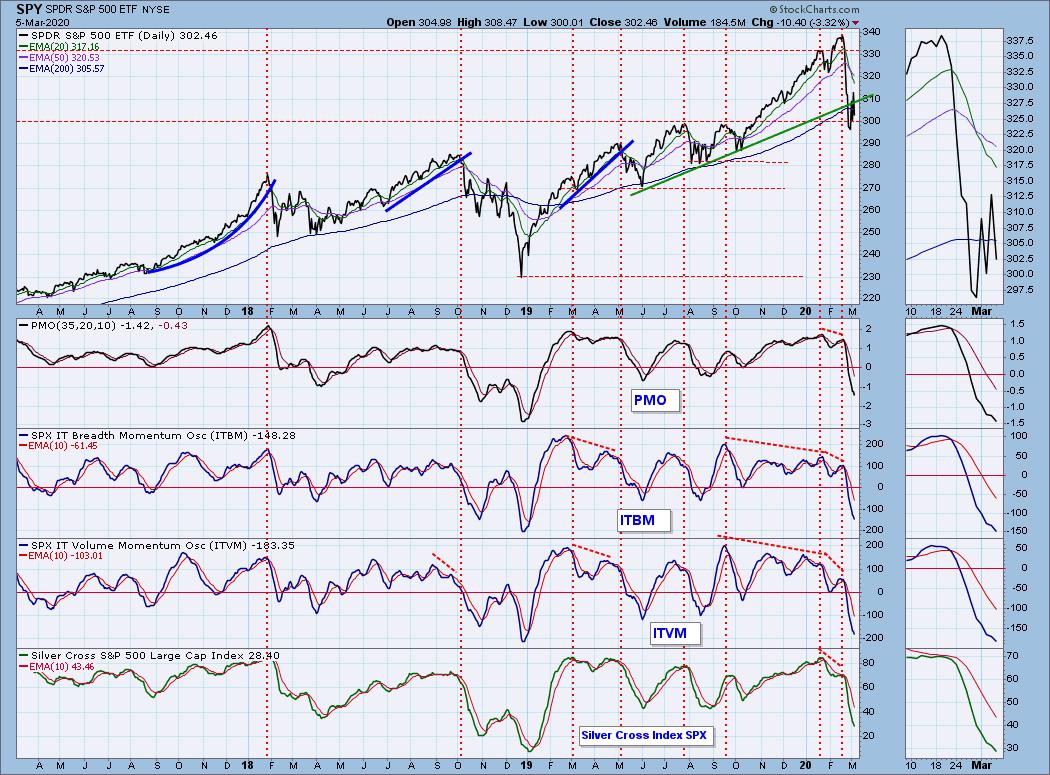
The IT trend is back DOWN when measured by the green rising trendline and the market condition is VERY OVERSOLD based upon all of the readings on the indicators below. All of these were showing signs of deceleration finally, but now they are back to accelerating lower.
CONCLUSION: The ST and IT trends are mixed, with ST being UP and IT being DOWN. Market condition based on ST and IT indicators is OVERSOLD to VERY OVERSOLD. Volatility is nauseating right now as we are whipped into a rally frenzy to be followed by a correction craze. I don't see any indication in our analysis that we are through. I'm going to go get my Dramamine.
(Not a Diamonds subscriber? Add it to your DP Alert subscription and get a discount! Contact support@decisionpoint.com for your limited time coupon code!)
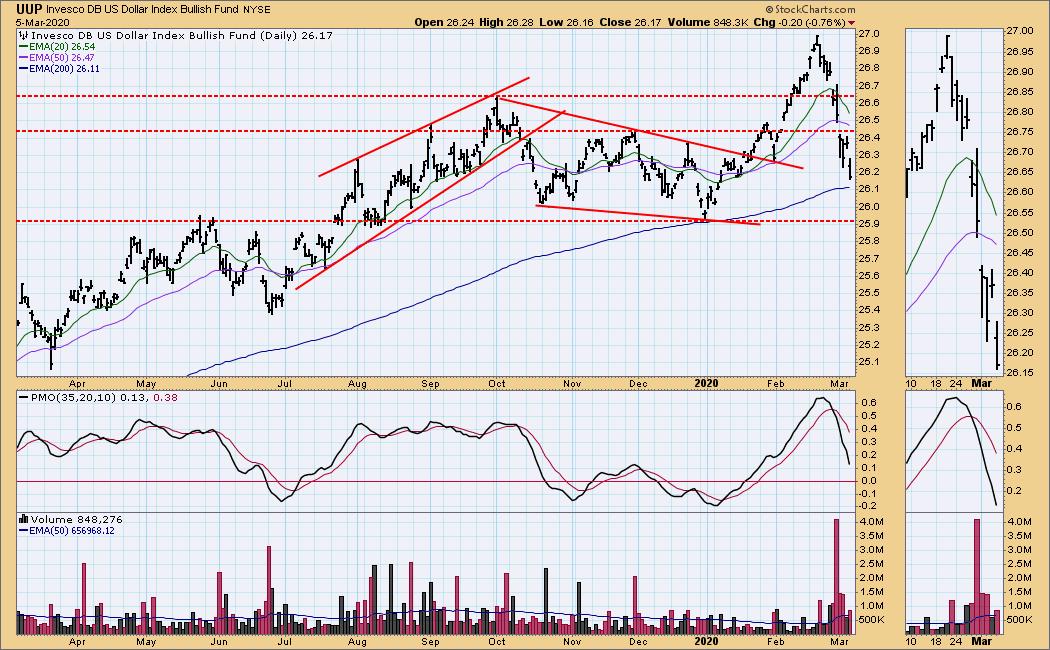
DOLLAR (UUP)
IT Trend Model: BUY as of 1/22/2020
LT Trend Model: BUY as of 5/25/2018
UUP Daily Chart: Well, we've almost reached the 200-EMA which is where I was expecting to see price decline to. The PMO is pointed straight down. Hold on for a decline to support at $25.90. I didn't expect it to test the 200-EMA so quickly.
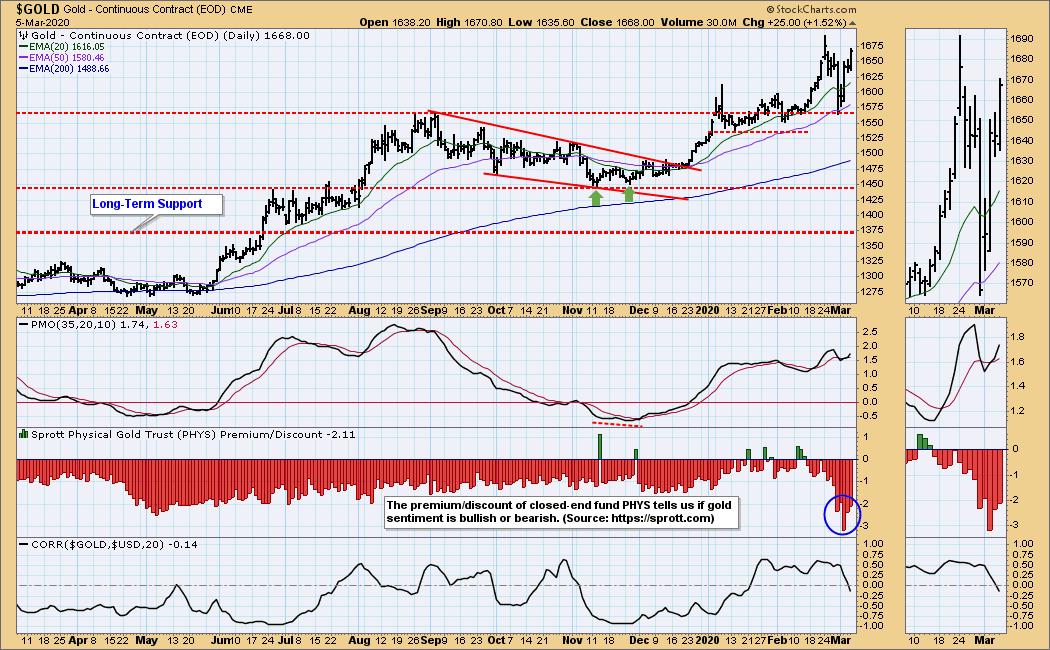
GOLD
IT Trend Model: BUY as of 12/26/2019
LT Trend Model: BUY as of 1/8/2019
GOLD Daily Chart: Gold benefited from a falling Dollar, but it does appear that it is becoming a flight to safety just like Bonds. Interestingly, the discounts are still high on PHYS and that is bullish for Gold. The PMO just whipsawed into another BUY signal. I'm looking for this signal to stick given the bleak outlook for the Dollar.
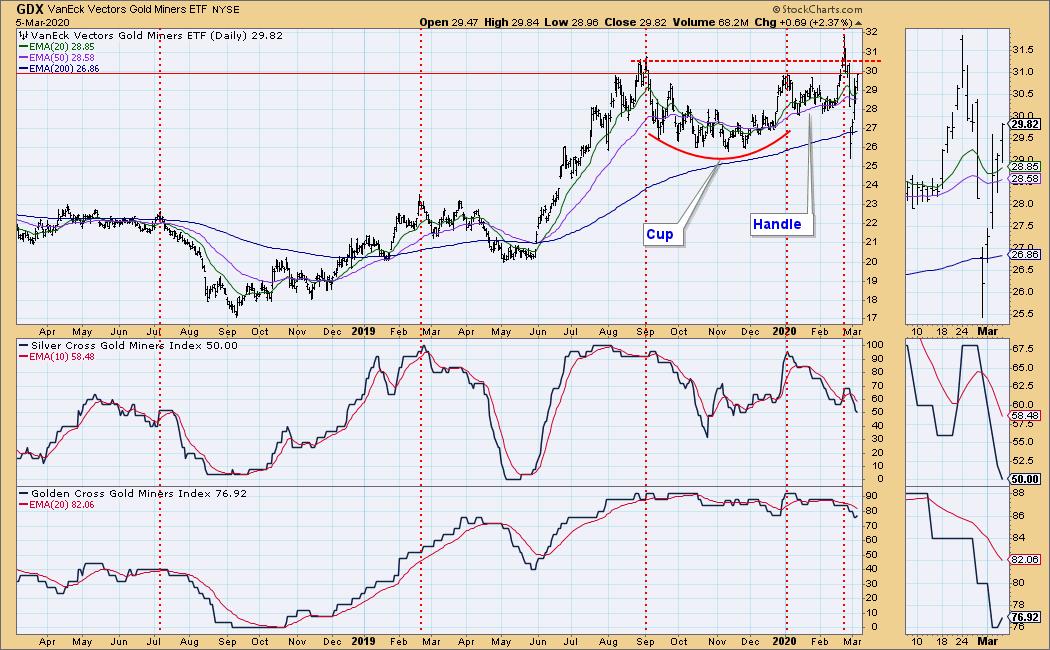
GOLD MINERS Golden and Silver Cross Indexes: Gold Miners benefited from the rise in Gold. Market gravity didn't hold them back either. I'm still concerned though. We are seeing less participation as the SCI continues lower even as price moves higher. The GCI did improve slightly, but not enough to break a declining trend.
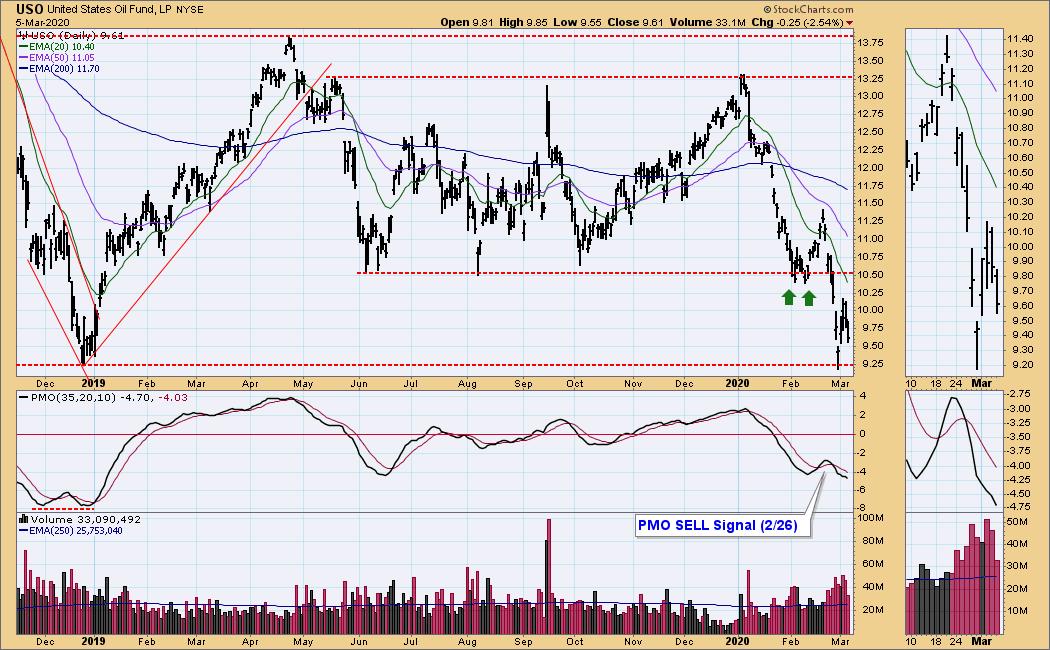
CRUDE OIL (USO)
IT Trend Model: Neutral as of 1/27/2020
LT Trend Model: BUY as of 12/16/2019
USO Daily Chart: Not surprisingly, Oil dropped again today. The PMO is oversold, but not turning back up. I would look toward a new trading range between $9.25 and $10.25, although I think we would be fortunate if USO can hold the $9.25 level. I have heard that OPEC and Russia are trying to figure out how to keep prices from falling so outside forces could soften some of the bearish technicals here.
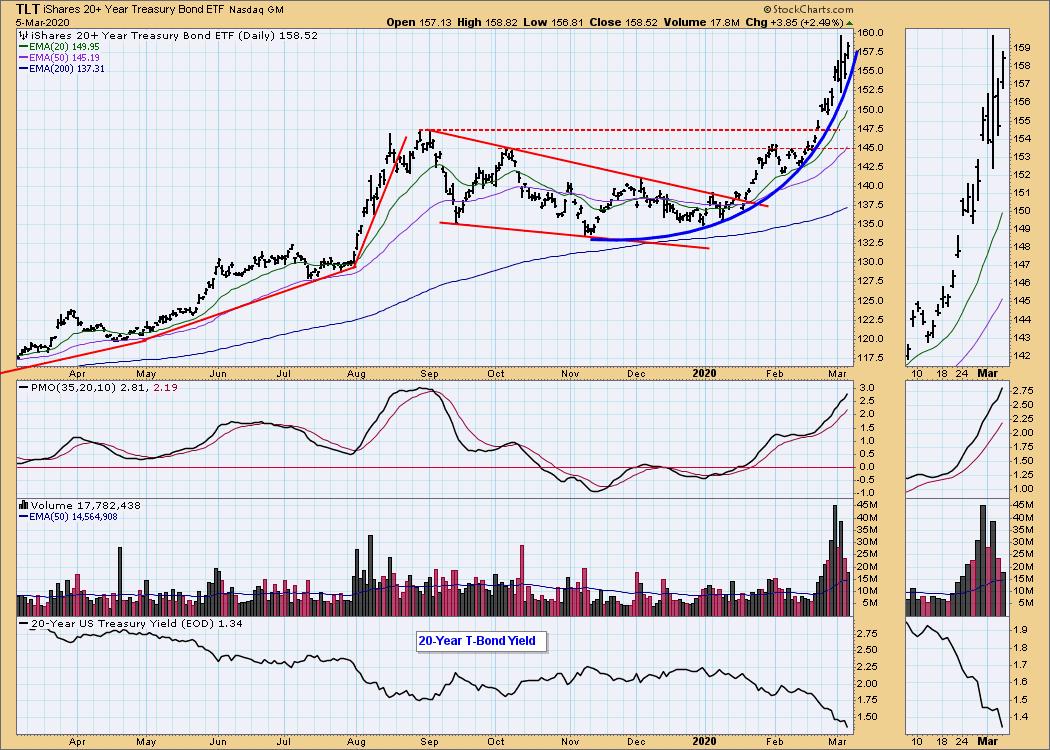
BONDS (TLT)
IT Trend Model: BUY as of 1/22/2020
LT Trend Model: BUY as of 1/2/2019
TLT Daily Chart: The parabola continues. The PMO is very overbought. Investors' appetites for this area of safety could continue to drive prices higher and stretch the PMO into overbought extremes. What we do know is that this pattern and near vertical rise will not likely end pleasantly.
Have you subscribed the DecisionPoint Diamonds yet? DP does the work for you by providing handpicked stocks/ETFs from exclusive DP scans! Add it with a discount! Contact support@decisionpoint.com for more information!
Technical Analysis is a windsock, not a crystal ball.
Happy Charting! - Erin
Email: erin@decisionpoint.com

Erin Swenlin will be presenting at the The MoneyShow Las Vegas May 11-13, 2020! You'll have an opportunity to meet Erin and discuss the latest DecisionPoint news and Diamond Scans. Claim your FREE pass here! You can watch online with this pass too!!
NOTE: The signal status reported herein is based upon mechanical trading model signals, specifically, the DecisionPoint Trend Model. They define the implied bias of the price index based upon moving average relationships, but they do not necessarily call for a specific action. They are information flags that should prompt chart review. Further, they do not call for continuous buying or selling during the life of the signal. For example, a BUY signal will probably (but not necessarily) return the best results if action is taken soon after the signal is generated. Additional opportunities for buying may be found as price zigzags higher, but the trader must look for optimum entry points. Conversely, exit points to preserve gains (or minimize losses) may be evident before the model mechanically closes the signal.
Helpful DecisionPoint Links (Can Be Found on DecisionPoint.com Links Page):
DecisionPoint Shared ChartList and DecisionPoint Chart Gallery
Price Momentum Oscillator (PMO)
Swenlin Trading Oscillators (STO-B and STO-V)