
Two new signals to add to the DecisionPoint Sector Scoreboard. Both the Financial and Real Estate triggered new Trend Model BUY signals with a "golden cross" on XLF and a "silver cross" on XLRE.
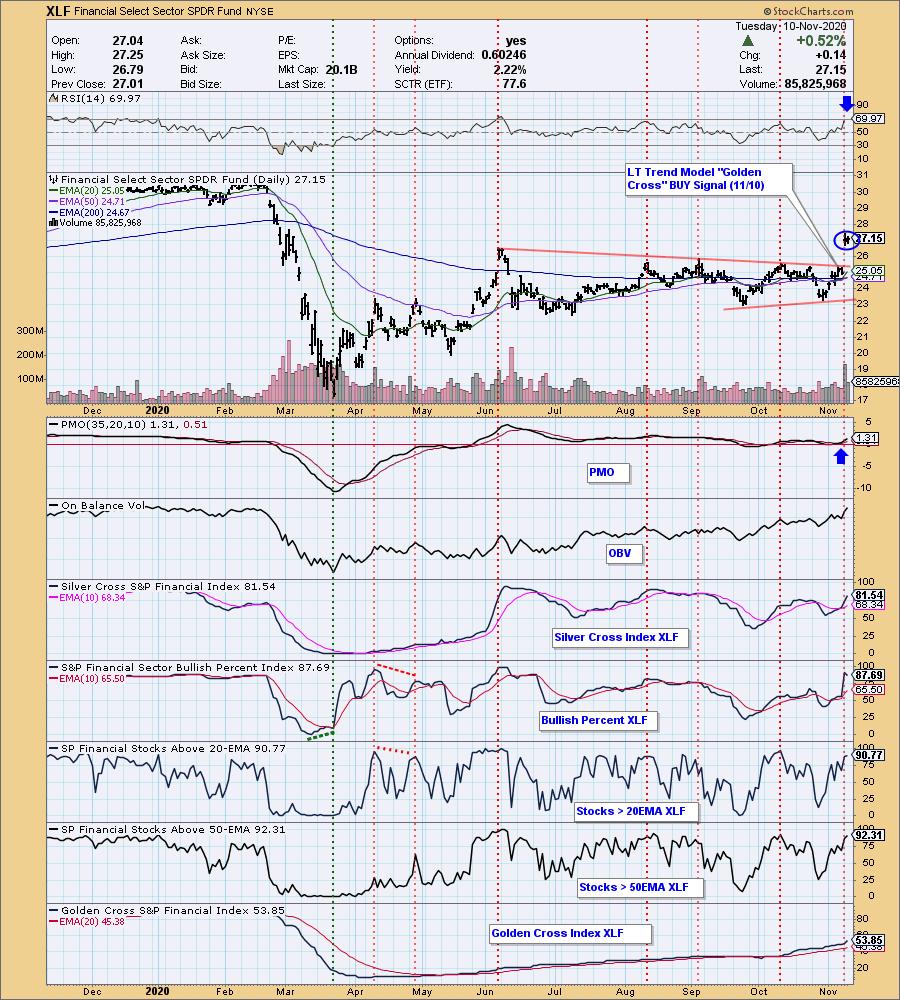
The most bullish breakout of the two would definitely be given to the Financial sector (XLF) which gapped up in a big way yesterday. The new LT Trend Model BUY signal was triggered when the 50-EMA crossed above the 200-EMA, a "golden cross". Today it traded up slightly and didn't give back any of yesterday's stellar gains. The PMO is on a BUY signal. The RSI is on the overbought side, but given the giant gap up, I'm not surprised. Indicators are overbought, but we need those high readings to see a continuation of this week's rally. It will require participation from its members to support a continuation.
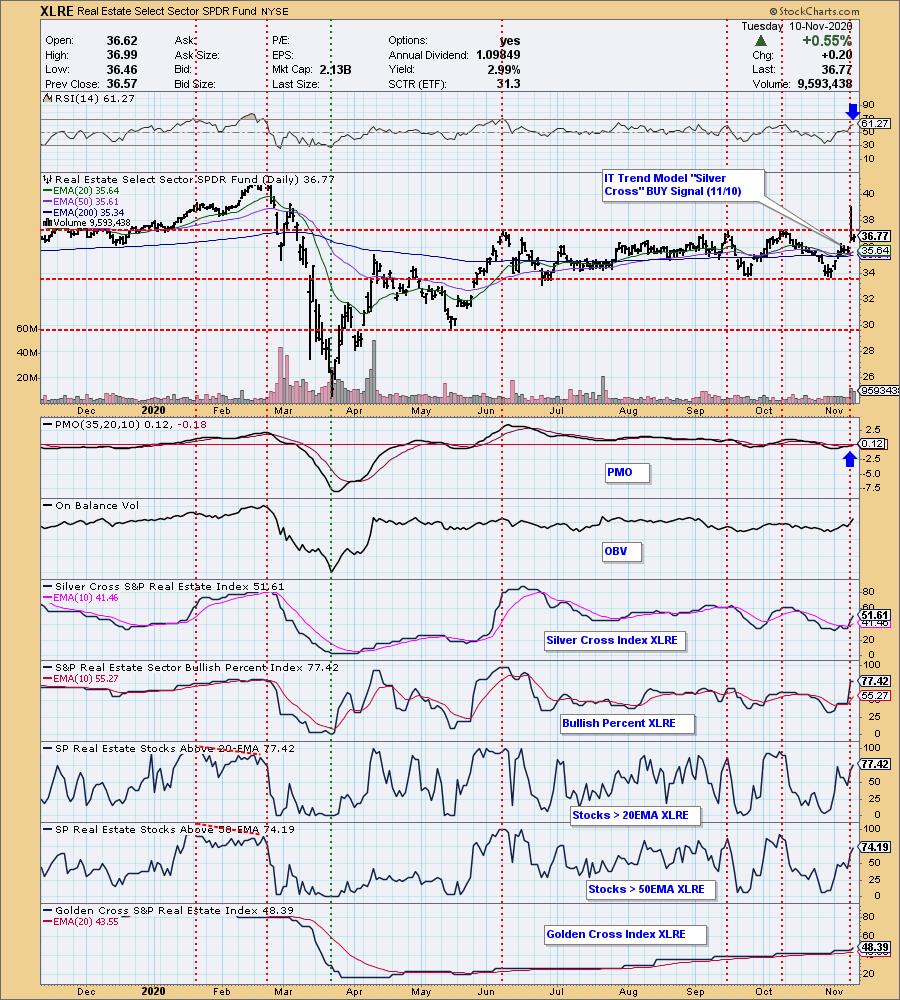
The Real Estate sector (XLRE) ETF broke out spectacularly yesterday, but finished back inside its trading range. Today's saw price stay there. The IT Trend Model BUY signal was triggered when the 20-EMA crossed above the 50-EMA, a "silver cross". You'll note the EMAs are "braiding". When price is in a trading range for this long, the EMAs will come together down the middle of the channel and then criss-cross frequently or "braid". This will cause numerous Trend Model crossover signals. We are seeing a positive RSI and a newly positive PMO that just had a crossover BUY signal. The indicators are very bullish and not overbought; however, I would like to see it maintain above the trading range before risking a trip down to test the bottom of the channel.
The DecisionPoint Alert Weekly Wrap presents an end-of-week assessment of the trend and condition of the Stock Market, the U.S. Dollar, Gold, Crude Oil, and Bonds. The DecisionPoint Alert daily report (Monday through Thursday) is abbreviated and gives updates on the Weekly Wrap assessments.
Watch the latest episode of DecisionPoint on StockCharts TV's YouTube channel here!
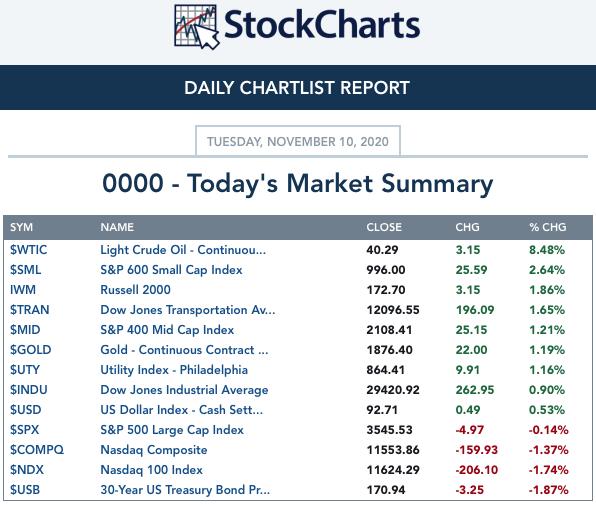
MAJOR MARKET INDEXES
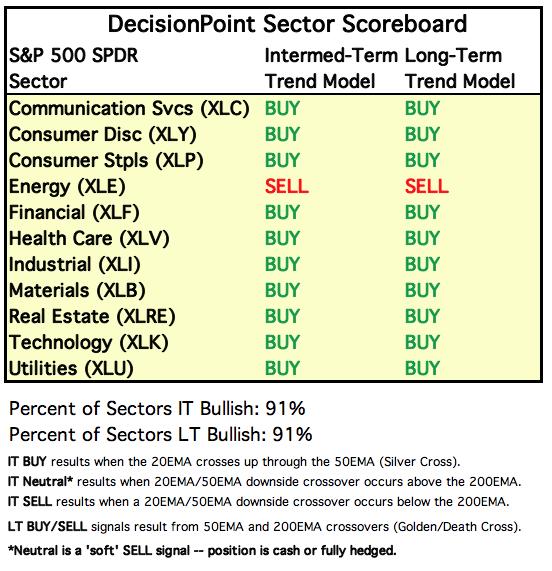
SECTORS
Each S&P 500 Index component stock is assigned to one, and only one, of 11 major sectors. This is a snapshot of the Intermediate-Term (Silver Cross) and Long-Term (Golden Cross) Trend Model signal status for those sectors.
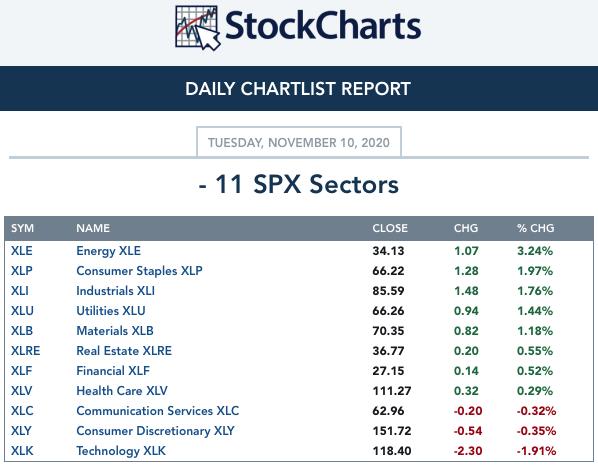
CLICK HERE for Carl's annotated Sector charts.
THE MARKET (S&P 500)
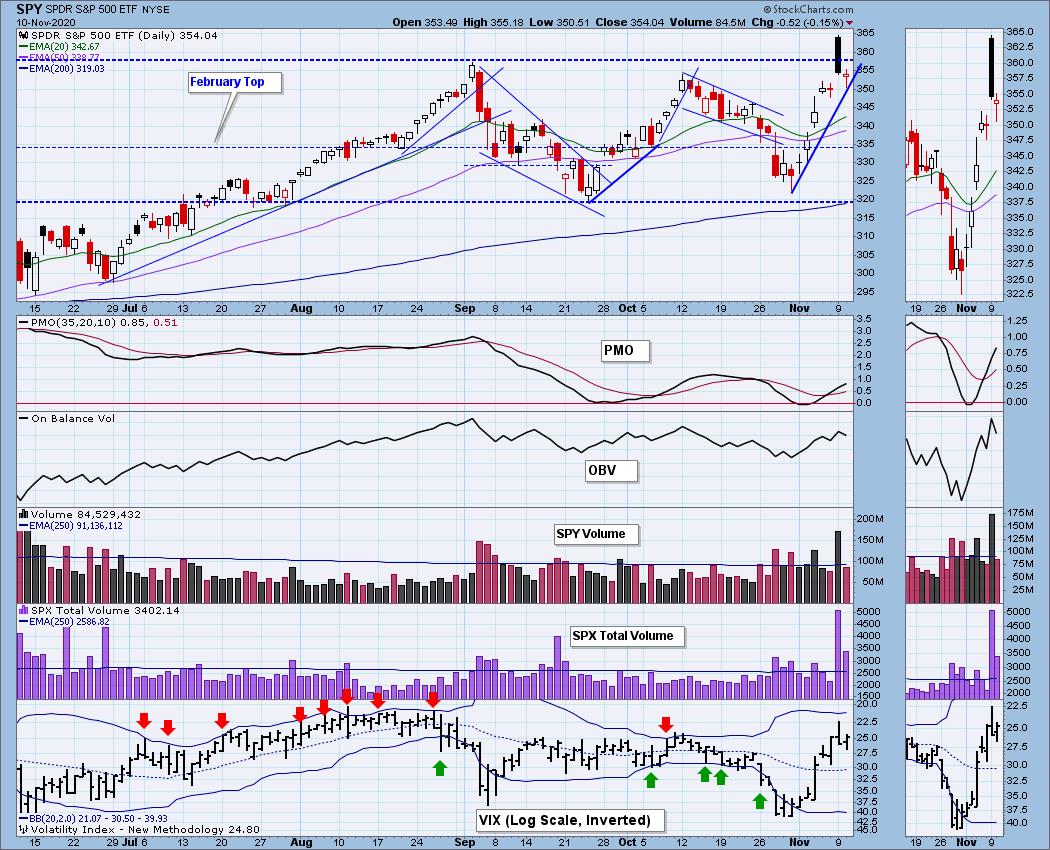
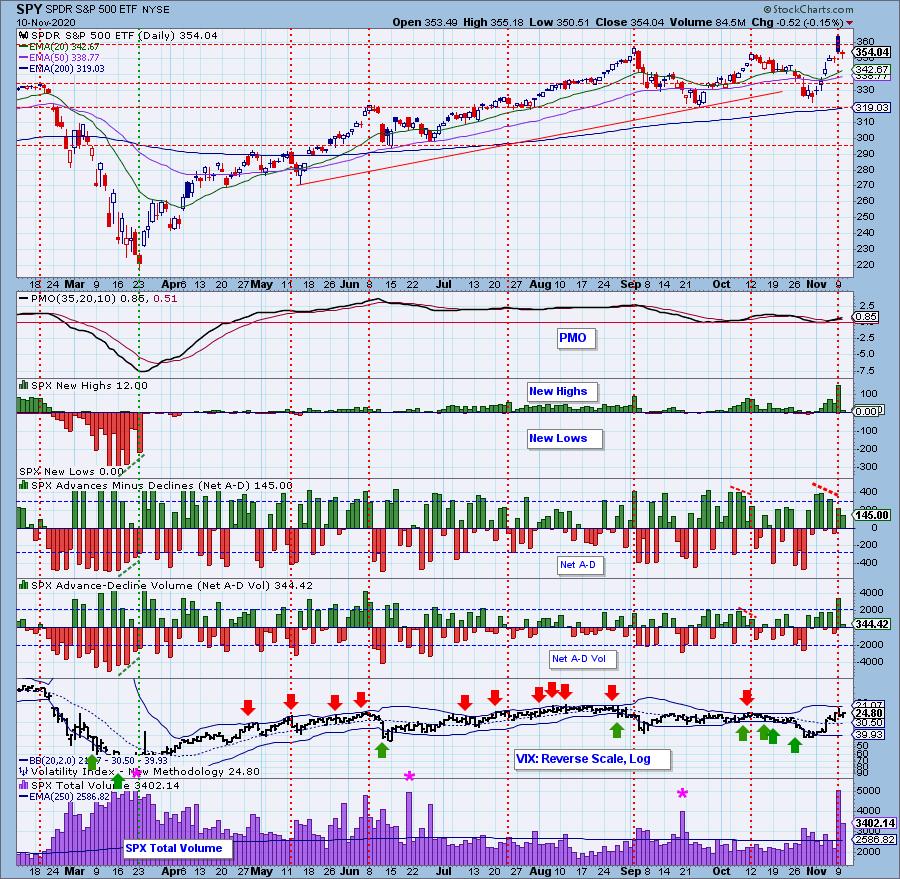
IT Trend Model: BUY as of 5/8/2020
LT Trend Model: BUY as of 6/8/2020
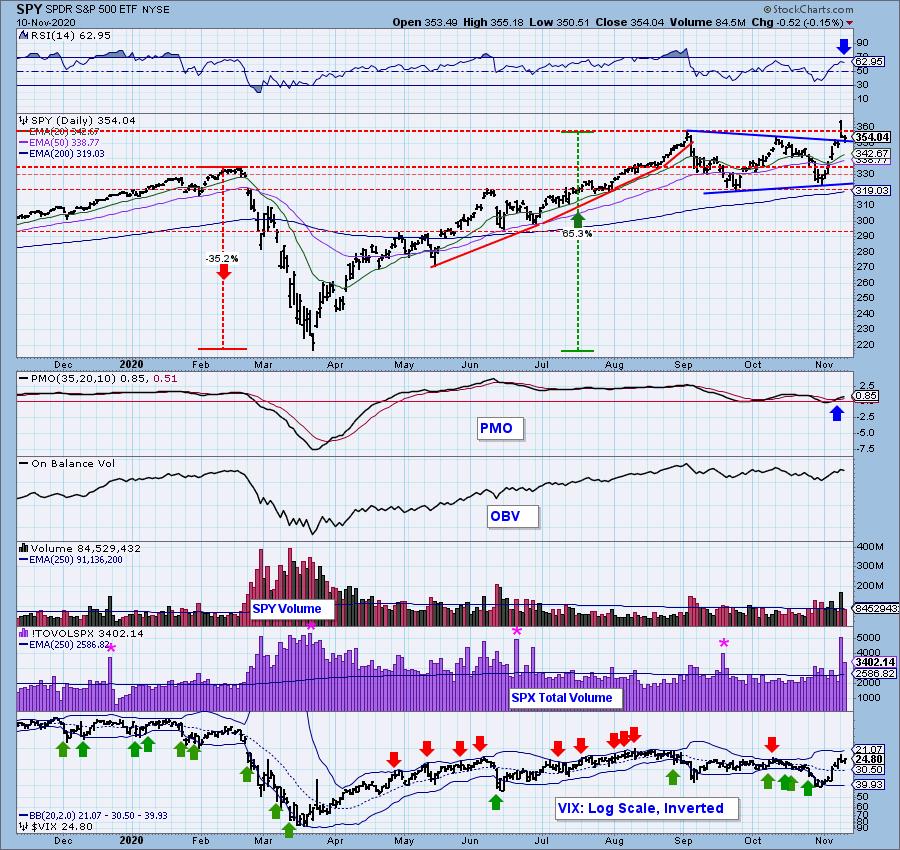
SPY Daily Chart: I doubt many of us were surprised by today's pullback. The SPY is now back in the trading range. So far it is maintaining the rising trend. The VIX topped on our inverted scale and that could mean more short-term downside. The PMO continues to rise on a BUY signal. Total volume was well above average, but significantly lower than yesterday.
Price is back in that trading range, but it did stay above the declining tops trendline. The RSI remains positive and not overbought.

It's Free!
***Click here to register for this recurring free DecisionPoint Trading Room on Mondays at Noon ET!***
Did you miss the 11/9 trading room? Here is a link to the recording -- access code: UxEj0^3e.
For best results, copy and paste the access code to avoid typos.
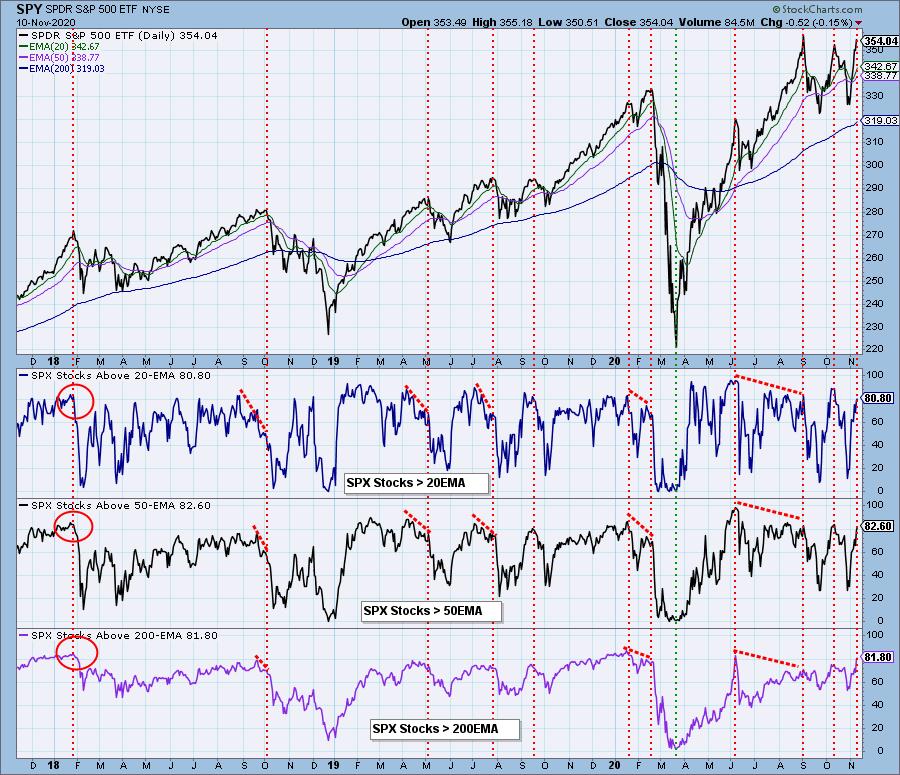
Participation: The following chart uses different methodologies for objectively showing the depth and trend of participation for intermediate- and long-term time frames.
- The Silver Cross Index (SCI) shows the percentage of SPX stocks on IT Trend Model BUY signals (20-EMA > 50-EMA).
- The Golden Cross Index (GCI) shows the percentage of SPX stocks on LT Trend Model BUY signals (50-EMA > 200-EMA).
- The Bullish Percent Index (BPI) shows the percentage of SPX stocks on Point & Figure BUY signals.
We didn't see much in the way of technical damage to the SCI and BPI even though they topped. The GCI continues to rise and it isn't overbought yet.
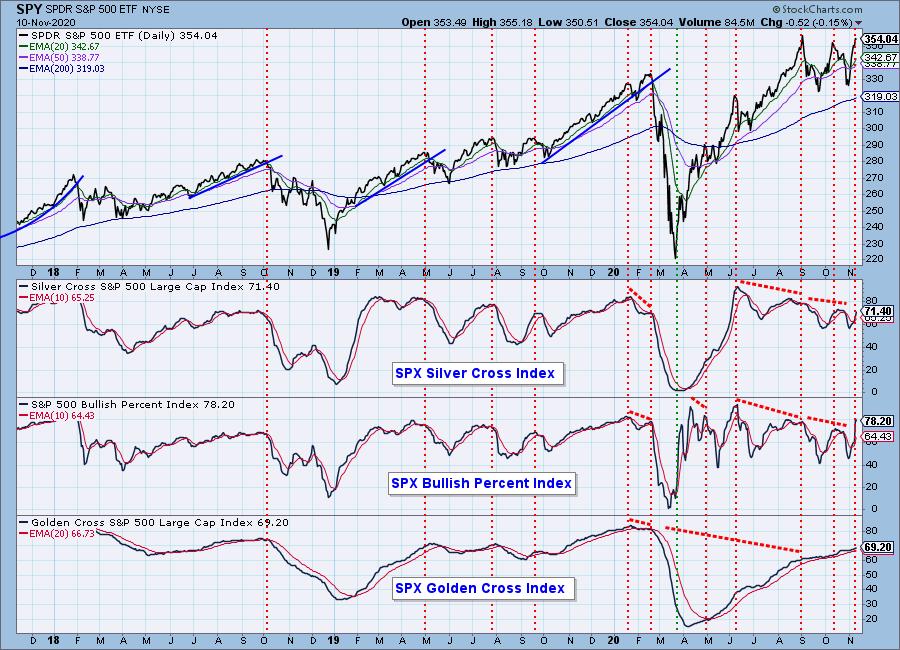
These indicators are overbought, but certainly could accommodate more rally before hitting overbought extremes.
Climactic Market Indicators: No climactic readings today, but we saw a big pullback on New Highs and a continued declining trend on Net A-D.
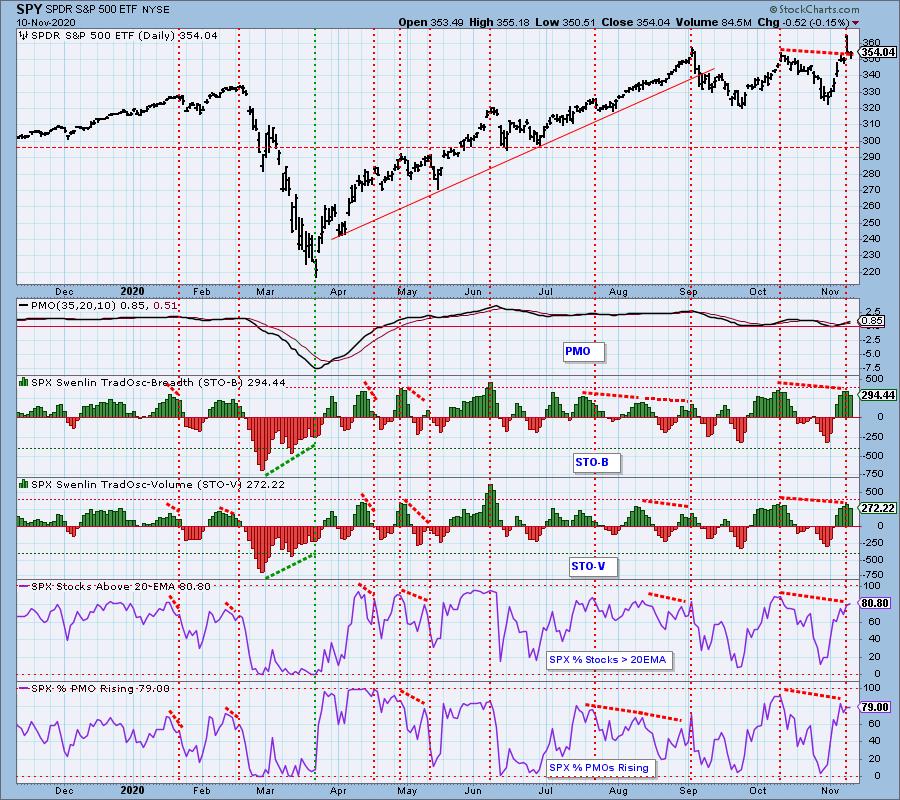
Short-Term Market Indicators: The short-term market trend is UP and the condition is OVERBOUGHT.
Today both STOs dropped. These indicators have been very timely on determining market tops and bottoms. Notice they tend to peak then fall, you don't generally see them bounce around. Seeing tops right now has me concerned about the short term.
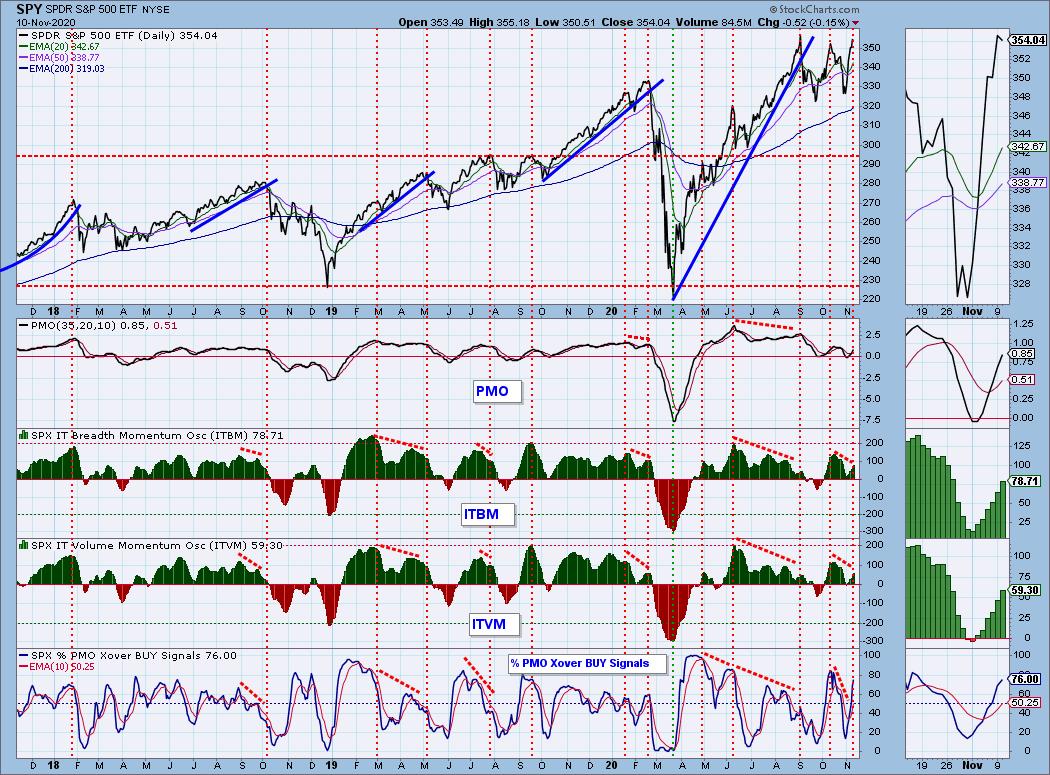
Intermediate-Term Market Indicators: The intermediate-term market trend is UP and the condition is SOMEWHAT OVERBOUGHT. The market bias is BULLISH.
The intermediate term looks far more bullish as we have all of the indicators rising and not in overbought territory.
CONCLUSION: We may've gotten a market rally pop yesterday, but the market paused today. The short-term indicators are overbought and are now in decline so I'm looking for a continuation of today's decline. I wouldn't worry too much about a big corrective move simply based on the very bullish intermediate-term indicators.
Have you subscribed the DecisionPoint Diamonds yet? DP does the work for you by providing handpicked stocks/ETFs from exclusive DP scans! Add it with a discount! Contact support@decisionpoint.com for more information!
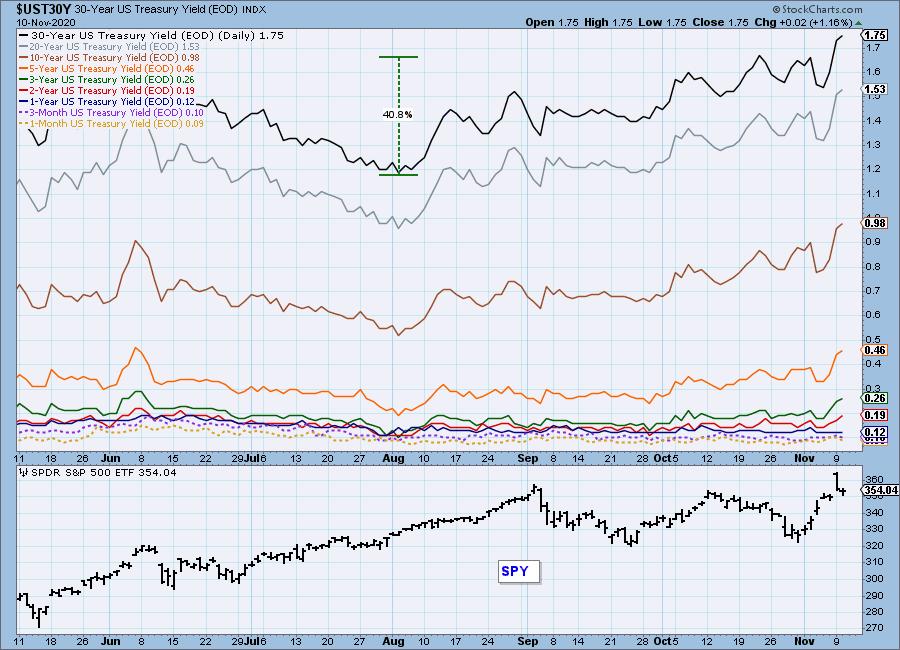
INTEREST RATES
This chart is included so we can monitor rate inversions. In normal circumstances the longer money is borrowed the higher the interest rate that must be paid. When rates are inverted, the reverse is true.
DOLLAR (UUP)
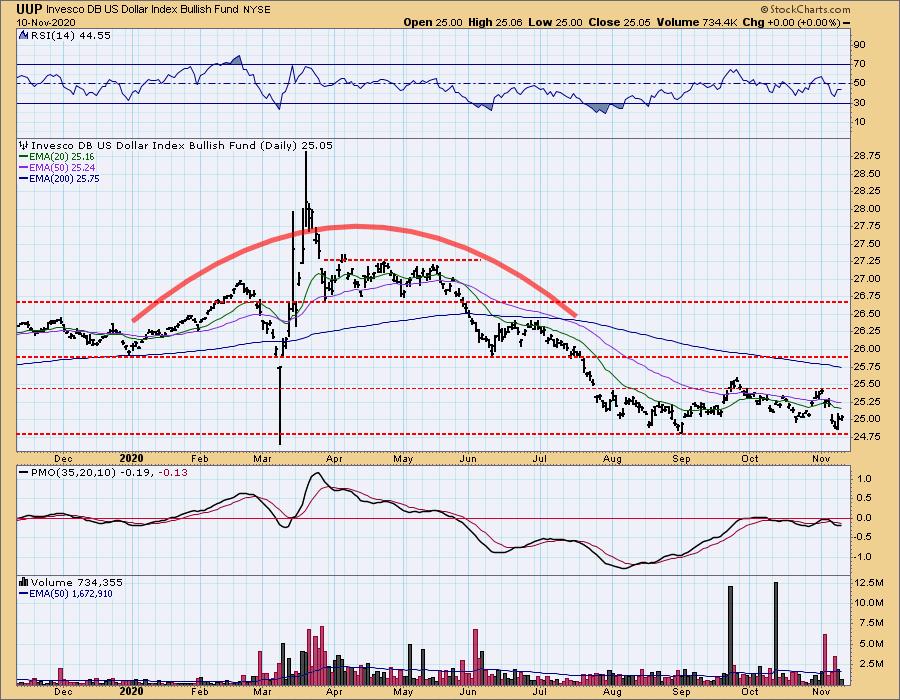
IT Trend Model: NEUTRAL as of 5/28/2020
LT Trend Model: SELL as of 7/10/2020
UUP Daily Chart: The Dollar is in a clear trading range. At this point it is making an attempt to reach the top of it again. The PMO is attempting to reach its signal line for a BUY signal. The RSI is negative but rising slightly. All of this points to a rising Dollar. However, overhead resistance at the 20/50-EMAs is closer and could certainly pose a threat.
GOLD
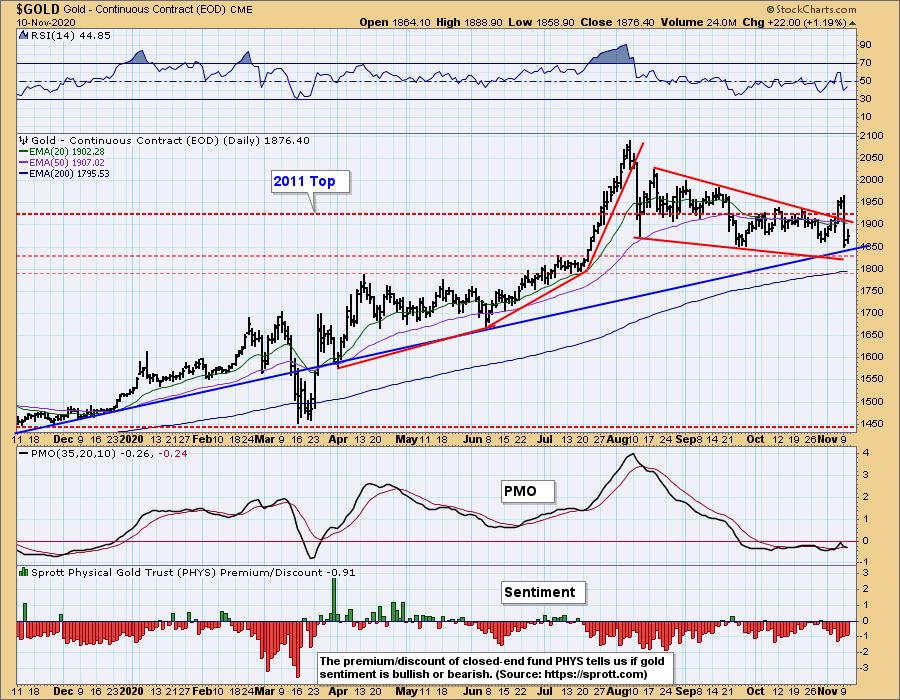
IT Trend Model: BUY as of 10/21/2020
LT Trend Model: BUY as of 1/8/2019
GOLD Daily Chart: Gold rallied nicely today on an unchanged Dollar. There are few things that I very much like on Gold. First, yesterday's bottom occurred slightly above the September low. Additionally it maintained the long-term rising trend. Discounts are still elevated which is bullish for Gold. On the bearish side, the RSI is negative and today a PMO SELL signal was triggered. Overall, I continue to be bullish on Gold.
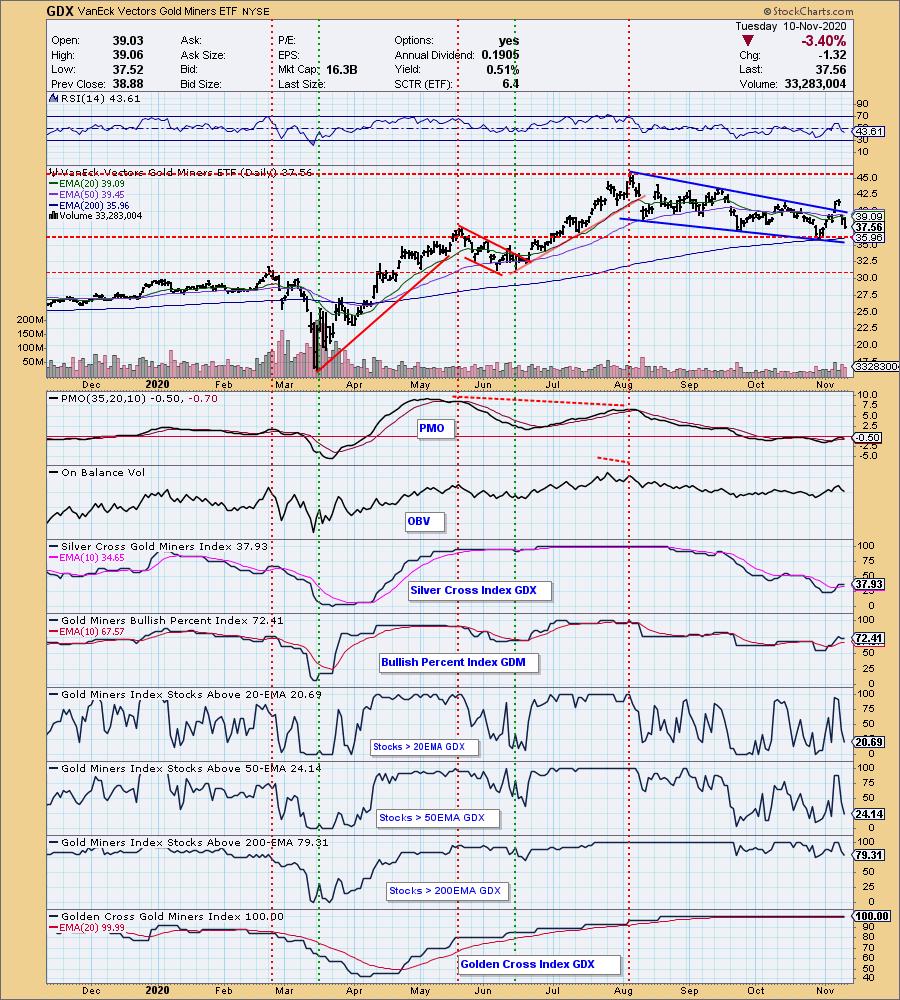
GOLD MINERS Golden and Silver Cross Indexes: Gold Miners have had a bad week and it could get a bit worse based on the PMO topping below the zero line and the RSI moving negative. Fortunately support is nearing at the 200-EMA.
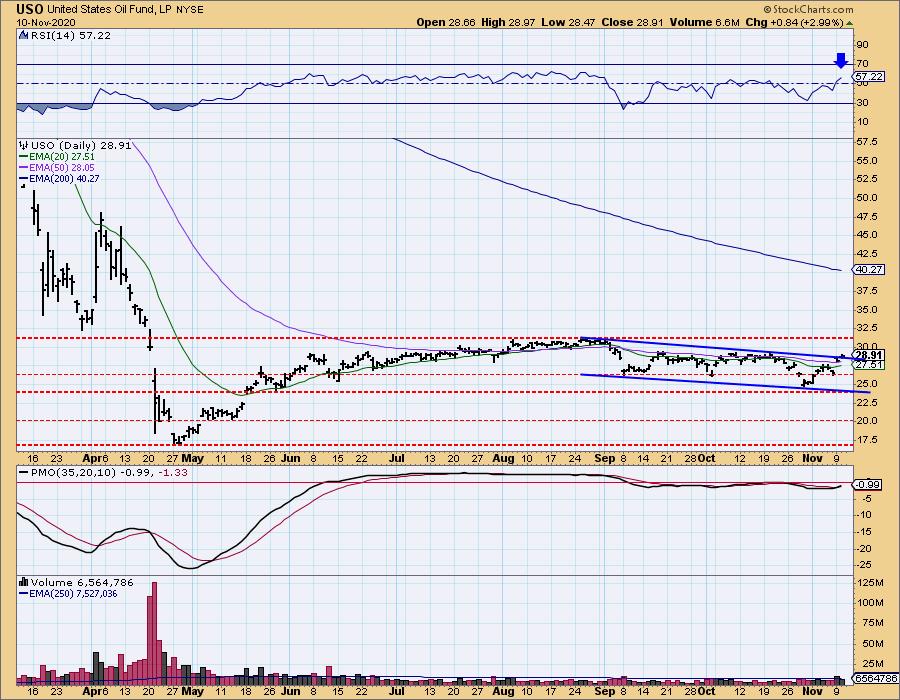
CRUDE OIL (USO)
IT Trend Model: SELL as of 9/8/2020
LT Trend Model: SELL as of 2/3/2020
USO Daily Chart: Despite rallying strongly this week, USO has barely escaped its declining trend channel. Given the very positive RSI and new PMO crossover BUY signal, I would look for USO to test the top of this trading range which would be about a 10% gain.
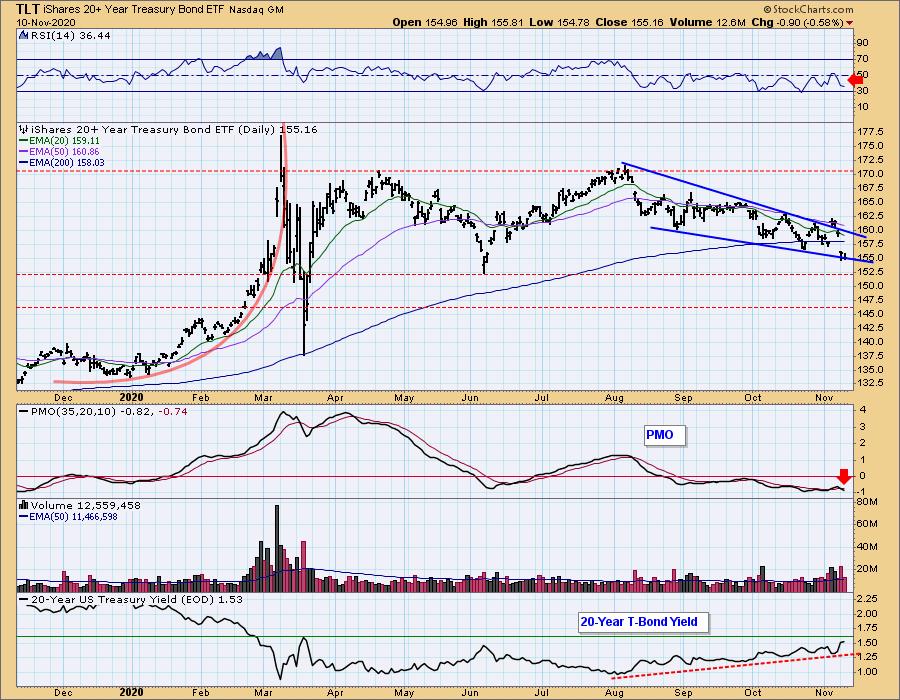
BONDS (TLT)
IT Trend Model: NEUTRAL as of 8/27/2020
LT Trend Model: BUY as of 1/2/2019
TLT Daily Chart: With interest rising, Bonds are feeling the pressure. TLT is barely holding onto the bottom of the bullish falling wedge. The RSI is negative and the PMO just triggered a crossover SELL signal. I am looking for a drop to at least $152.50.
Full Disclosure: I own TLT.
Technical Analysis is a windsock, not a crystal ball.
Happy Charting! - Carl
Disclaimer: This blog is for educational purposes only and should not be construed as financial advice. The ideas and strategies should never be used without first assessing your own personal and financial situation, or without consulting a financial professional. Any opinions expressed herein are solely those of the author, and do not in any way represent the views or opinions of any other person or entity.
NOTE: The signal status reported herein is based upon mechanical trading model signals, specifically, the DecisionPoint Trend Model. They define the implied bias of the price index based upon moving average relationships, but they do not necessarily call for a specific action. They are information flags that should prompt chart review. Further, they do not call for continuous buying or selling during the life of the signal. For example, a BUY signal will probably (but not necessarily) return the best results if action is taken soon after the signal is generated. Additional opportunities for buying may be found as price zigzags higher, but the trader must look for optimum entry points. Conversely, exit points to preserve gains (or minimize losses) may be evident before the model mechanically closes the signal.
Helpful DecisionPoint Links:
DecisionPoint Alert Chart List
DecisionPoint Golden Cross/Silver Cross Index Chart List
DecisionPoint Sector Chart List
Price Momentum Oscillator (PMO)
Swenlin Trading Oscillators (STO-B and STO-V)