
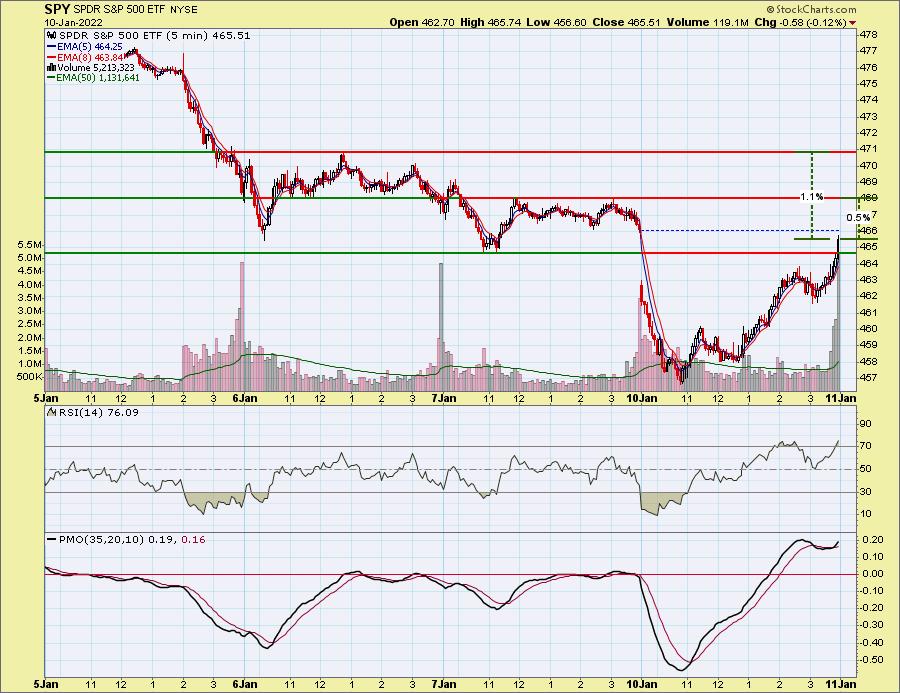
As I finished today's free DecisionPoint Trading Room (register here if you haven't already!) the market was just beginning to recover from intraday lows. The recovery was strong and suggests we could see some follow-through over the next day or two. The 5-minute PMO is back on a BUY signal, but it and the 5-minute RSI are overbought, telling me upside potential is limited. Price is only half a percent away from near-term overhead resistance and even if it manages to overcome that level, it is 1.1% away from even more short-term resistance.
The DecisionPoint Alert Weekly Wrap presents an end-of-week assessment of the trend and condition of the Stock Market, the U.S. Dollar, Gold, Crude Oil, and Bonds. The DecisionPoint Alert daily report (Monday through Thursday) is abbreviated and gives updates on the Weekly Wrap assessments.
Watch the latest episode of DecisionPoint on StockCharts TV's YouTube channel here!
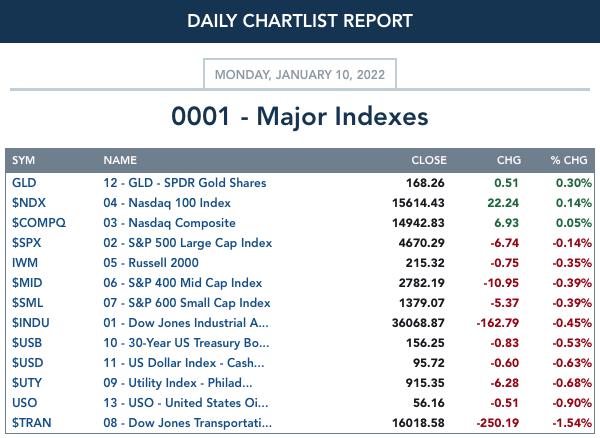
MAJOR MARKET INDEXES
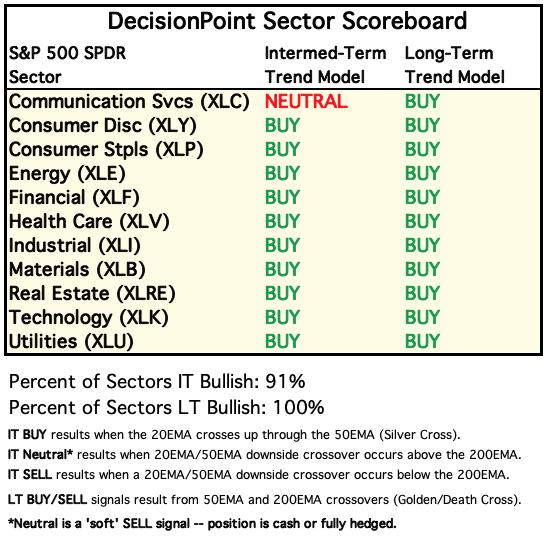
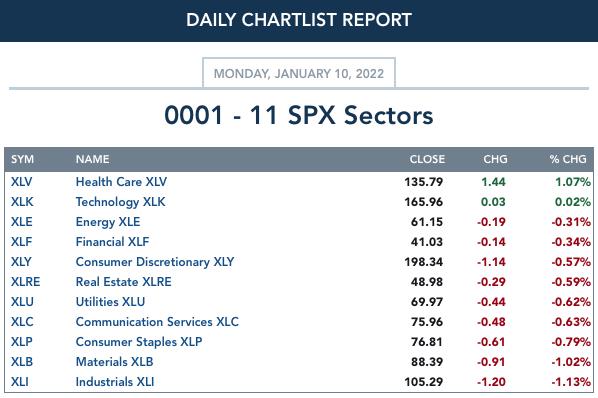
SECTORS
Each S&P 500 Index component stock is assigned to one, and only one, of 11 major sectors. This is a snapshot of the Intermediate-Term (Silver Cross) and Long-Term (Golden Cross) Trend Model signal status for those sectors.
RRG® Chart (Daily): The RRG is fairly easy to read. Strong bullish sectors are XLE, XLF, XLI, XLB and XLP. XLU is also looking bullish given its reversal into a positive northeast heading out of Weakening. XLRE and XLV are about to approach the Lagging quadrant. XLK and XLC are both very bearish as they travel in the negative southwest direction within Lagging quadrant. XLY is an interesting case. While it is headed southerly, it is also angling a bit toward Leading.
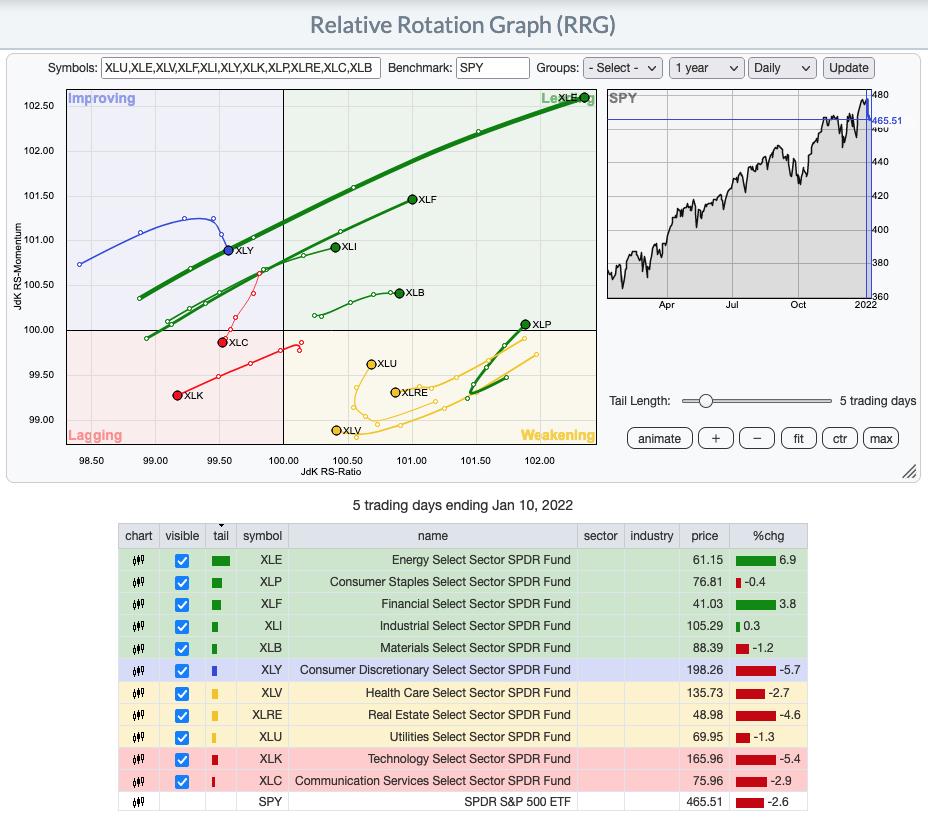
RRG® charts show you the relative strength and momentum for a group of stocks. Stocks with strong relative strength and momentum appear in the green Leading quadrant. As relative momentum fades, they typically move into the yellow Weakening quadrant. If relative strength then fades, they move into the red Lagging quadrant. Finally, when momentum starts to pick up again, they shift into the blue Improving quadrant.
CLICK HERE for an animated version of the RRG chart.
CLICK HERE for Carl's annotated Sector charts.
THE MARKET (S&P 500)
IT Trend Model: BUY as of 10/18/2021
LT Trend Model: BUY as of 6/8/2020
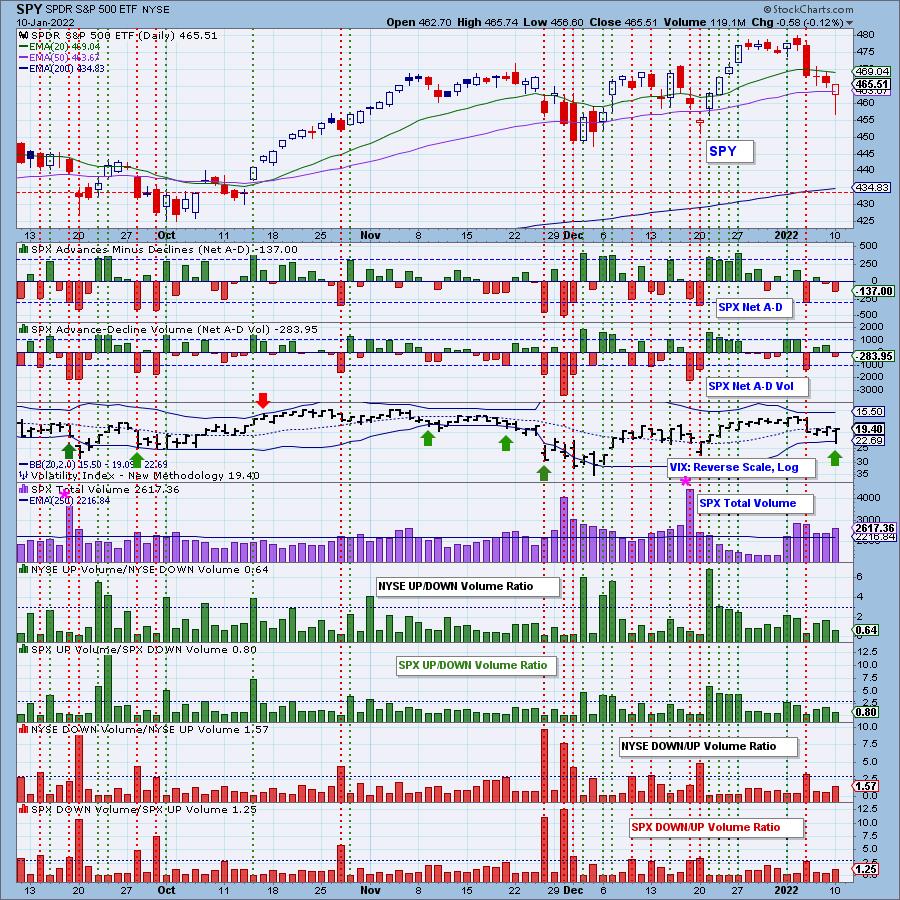
SPY Daily Chart: While the intraday recovery was impressive, we note that price still closed beneath the 50-day EMA. Total Volume was elevated as the bulls swooped in on a buying spree at the end of today. This setup today's candlestick as a "hammer". Those are bullish one-day patterns that suggest we will see higher prices tomorrow.
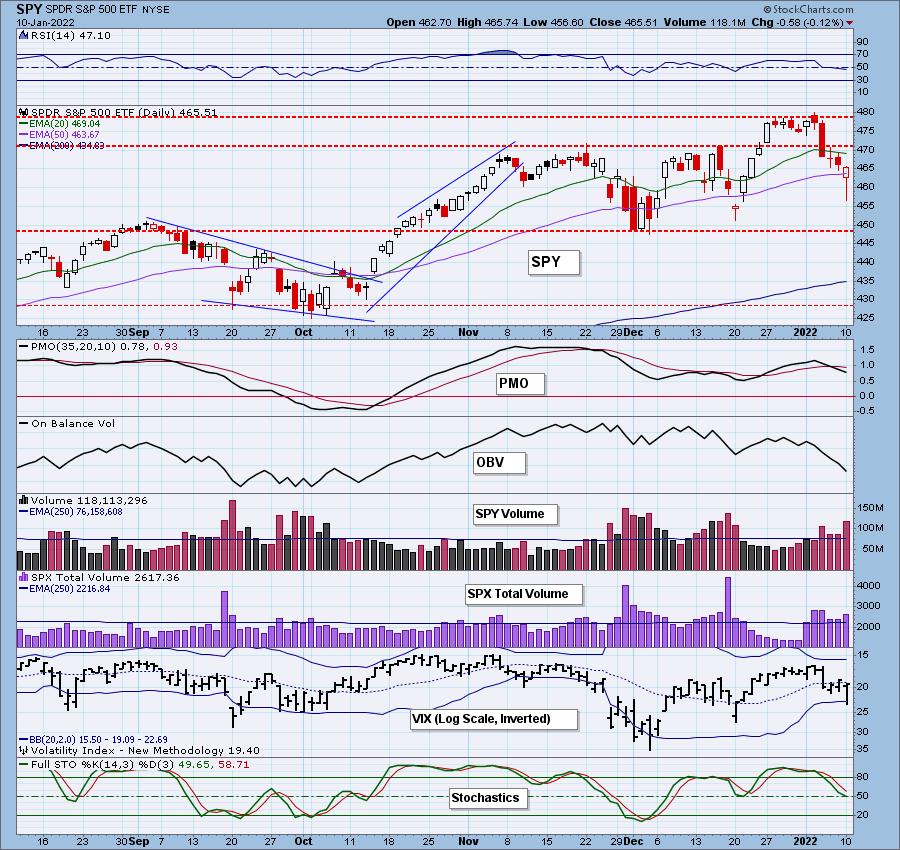
The indicators are still bearish. The RSI is falling below net neutral (50), the PMO is falling on a crossover SELL signal and Stochastics are still falling after dipping below 50. The intermediate-term rising trend is still intact. I was looking for a bounce after price fell to $450, but given today's strong volume finish that recouped earlier losses, we could see that bounce early.

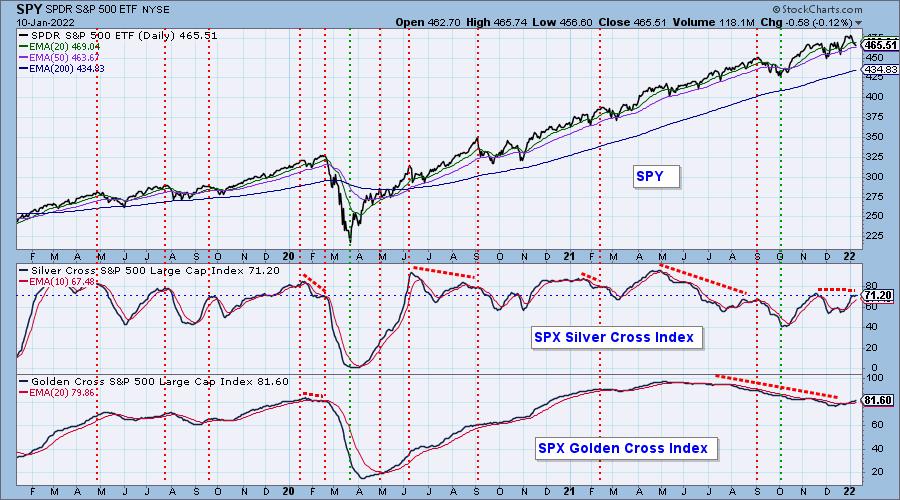
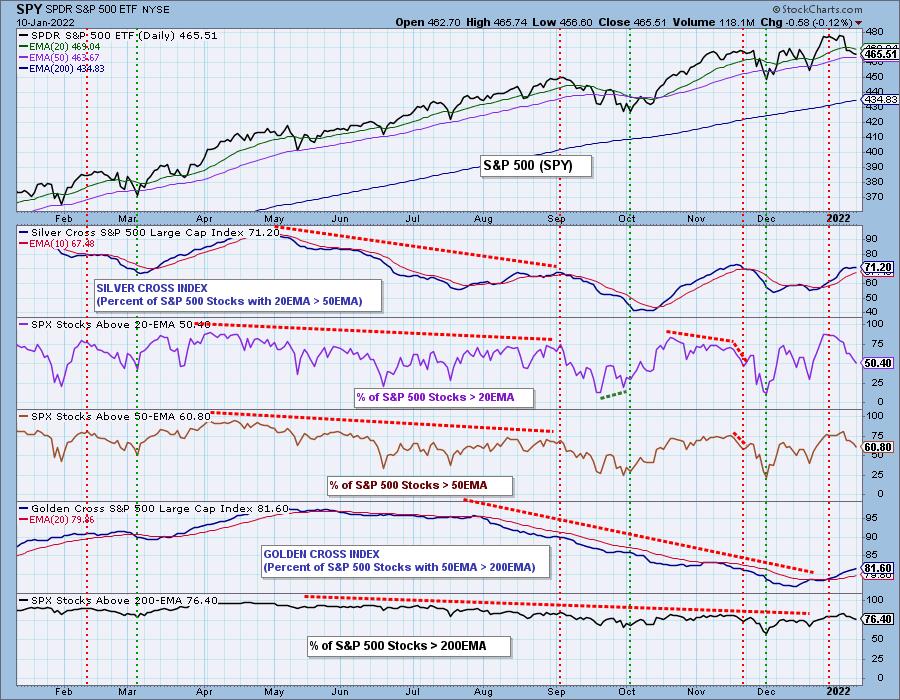
PARTICIPATION: The following chart objectively shows the depth and trend of participation in two time frames.
- Intermediate-Term - the Silver Cross Index (SCI) shows the percentage of SPX stocks on IT Trend Model BUY signals (20-EMA > 50-EMA). The opposite of the Silver Cross is a "Dark Cross" -- those stocks are, at the very least, in a correction.
- Long-Term - the Golden Cross Index (GCI) shows the percentage of SPX stocks on LT Trend Model BUY signals (50-EMA > 200-EMA). The opposite of a Golden Cross is the "Death Cross" -- those stocks are in a bear market.
The SCI was flat today at a somewhat bullish 71%. The GCI continues to rise slowly with a bullish 82% reading.
S&P 500 New 52-Week Highs/Lows: We are now seeing some New Lows which is why the 10-DMA of the High-Low Differential is topping. I do not like to see that indicator top. The market tends to move lower when this indicator tops and declines.
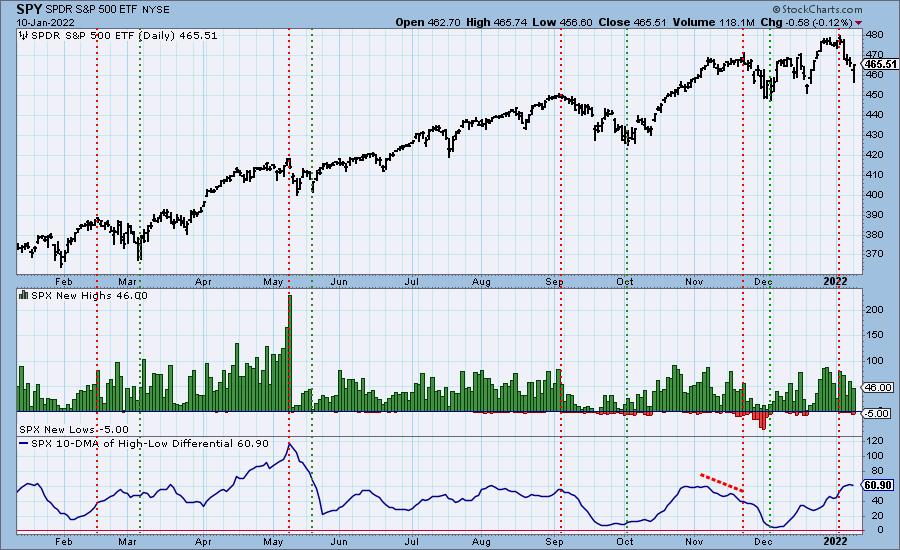
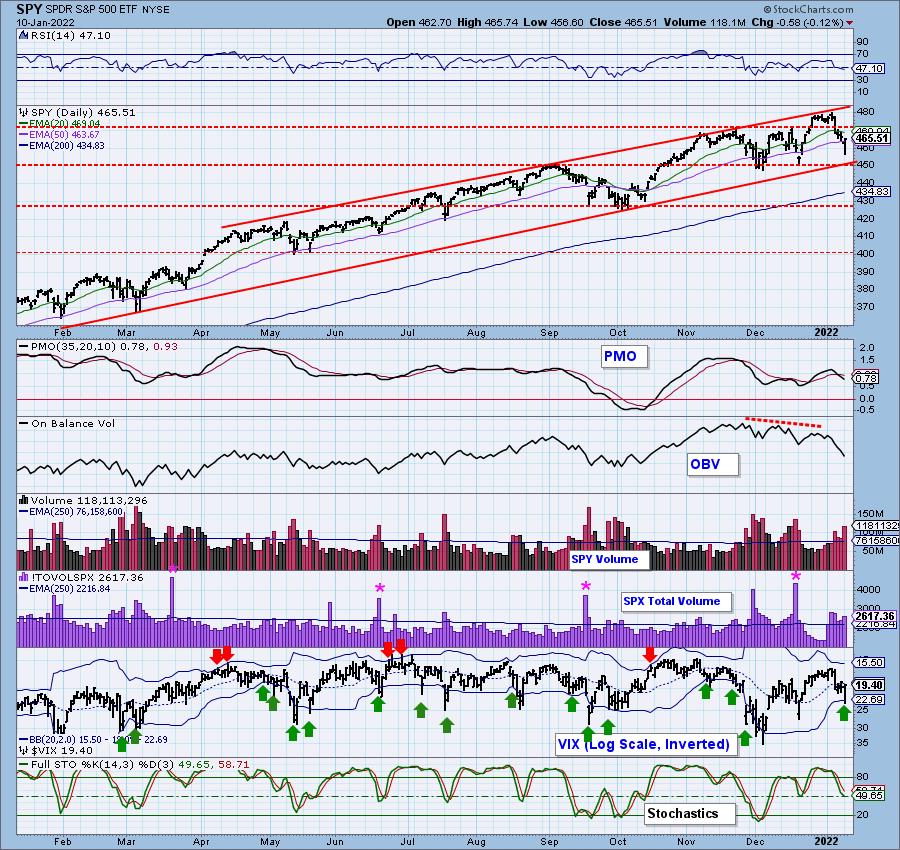
Climax* Analysis: Carl and I were looking for a downside exhaustion climax, but with the late day recovery, Volume Ratios did not exceed our 3.0 threshold. Additionally Net A-D and Net A-D Volume were not climactic. We note the VIX has punctured the lower Bollinger Band on our inverted scale. Typically we will see an upside reversal after these punctures, at least for a day or two.
*A climax is a one-day event when market action generates very high readings in, primarily, breadth and volume indicators. We also include the VIX, watching for it to penetrate outside the Bollinger Band envelope. The vertical dotted lines mark climax days -- red for downside climaxes, and green for upside. Climaxes indicate either initiation or exhaustion.
Short-Term Market Indicators: The short-term market trend is DOWN and the condition is NEUTRAL.
All of these indicators continue lower which is bearish. None of these indicators are oversold, so while a very short-term bounce is probable, this chart suggests it will be very short-lived.
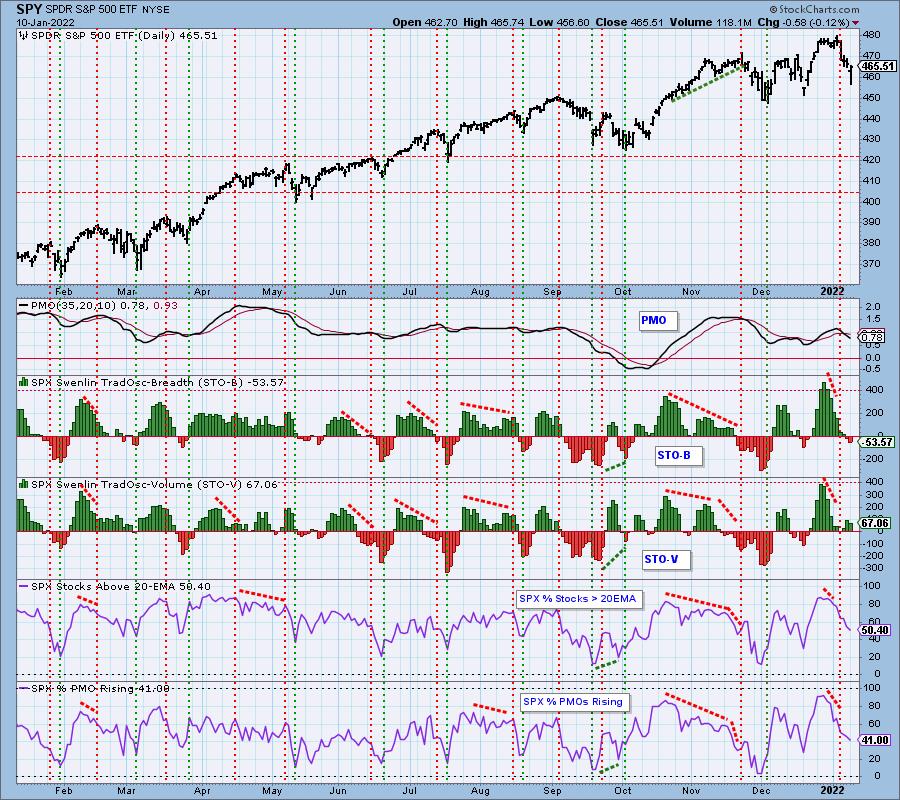
Intermediate-Term Market Indicators: The intermediate-term market trend is UP and the condition is OVERBOUGHT.
The ITBM continues lower, but the ITVM is still inching higher in overbought territory. Both are overbought. A little over half of the SPX are on PMO crossover BUY signals, but we know from the chart above that only 41% have rising PMOs. That indicator will continue to fall if this doesn't change.

Bias Assessment: With participation shrinking among stocks > 20/50-day EMAs, the short-term bias is bearish. The SCI is flat, but holds a bullish 71% reading, giving us a bullish intermediate-term bias (for now). Participation of stocks > 200-day EMAs is contracting and is less than the 82% GCI reading. While the long-term bias is bullish based on the GCI reading, that bias is beginning to deteriorate as more stocks lose support at their 200-day EMAs.
CONCLUSION: The market is weak and the indicators are all leaning bearish. However, given the strong late day recovery, paired with a VIX puncture of the lower Bollinger Band, Carl and I agree that a bounce is likely over the next few days. However, as he closed the DecisionPoint Show today, he warned viewers to be careful as the market "could turn on a dime".
I am 15% exposed to the market with 85% in cash and readily available to trade.
Have you subscribed the DecisionPoint Diamonds yet? DP does the work for you by providing handpicked stocks/ETFs from exclusive DP scans! Add it with a discount! Contact support@decisionpoint.com for more information!
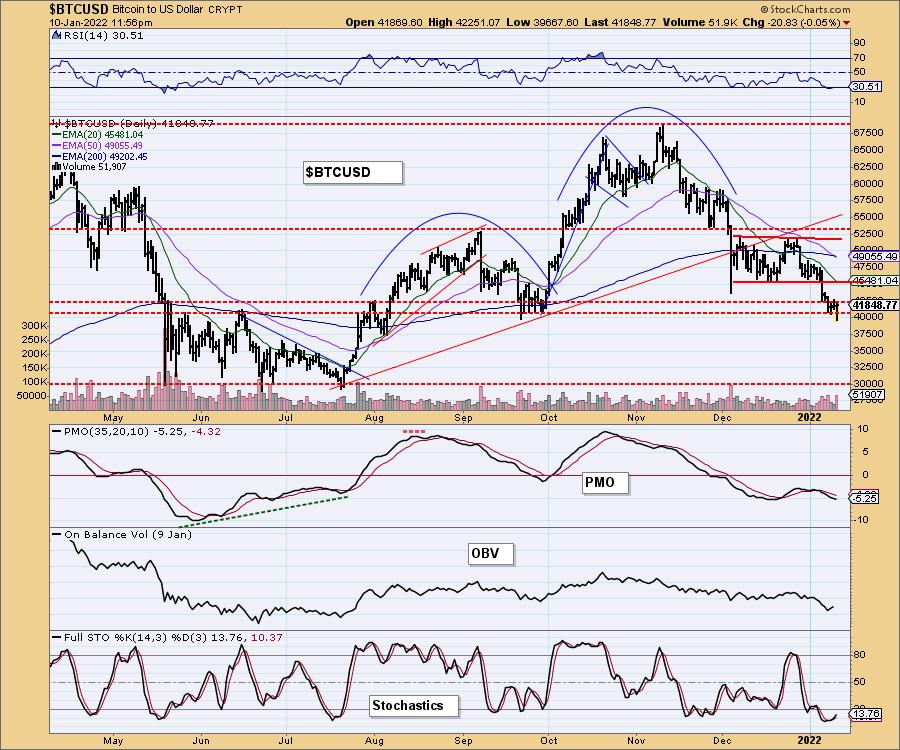
BITCOIN
My 13-year old nephew texted me on Friday that he had bought $5 in Bitcoin. He wanted to know what I thought about Bitcoin. I was the bearer of bad news as I don't like the deep decline in Bitcoin and told him it could drop all the way down to $30,000 before it rallies strongly again. However, I will need to update him. So far Bitcoin is holding support just above $40,000 and Stochastics are turning up in oversold territory. If Bitcoin can rebound here, we could see a nice rally back to $52,000. If it can't, $37,500 could act as support, but in all honesty, strong support doesn't arrive until $30,000.
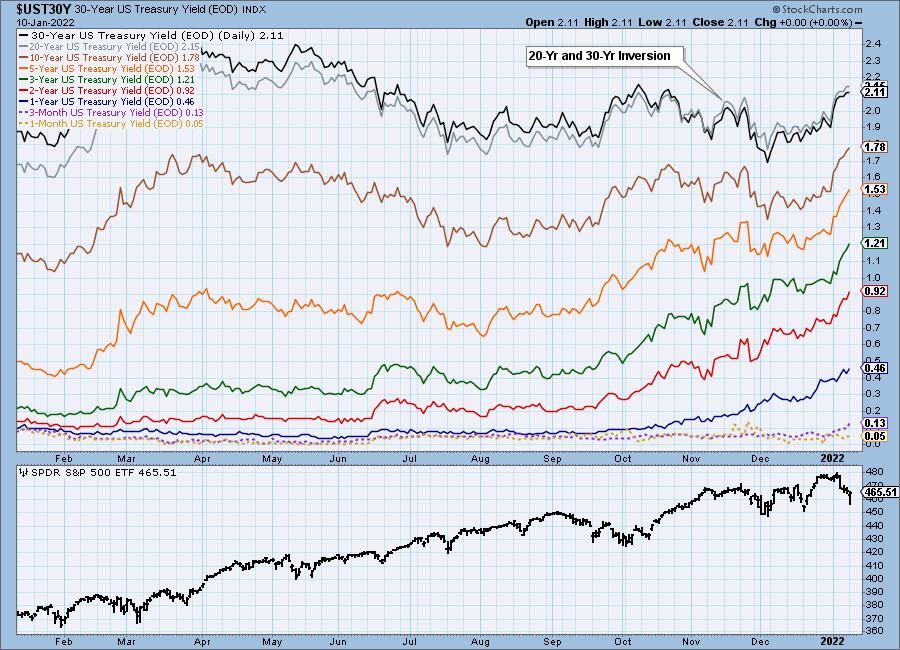
INTEREST RATES
With the FOMC prepared to raise rates further, a rising rate environment will be the new normal.
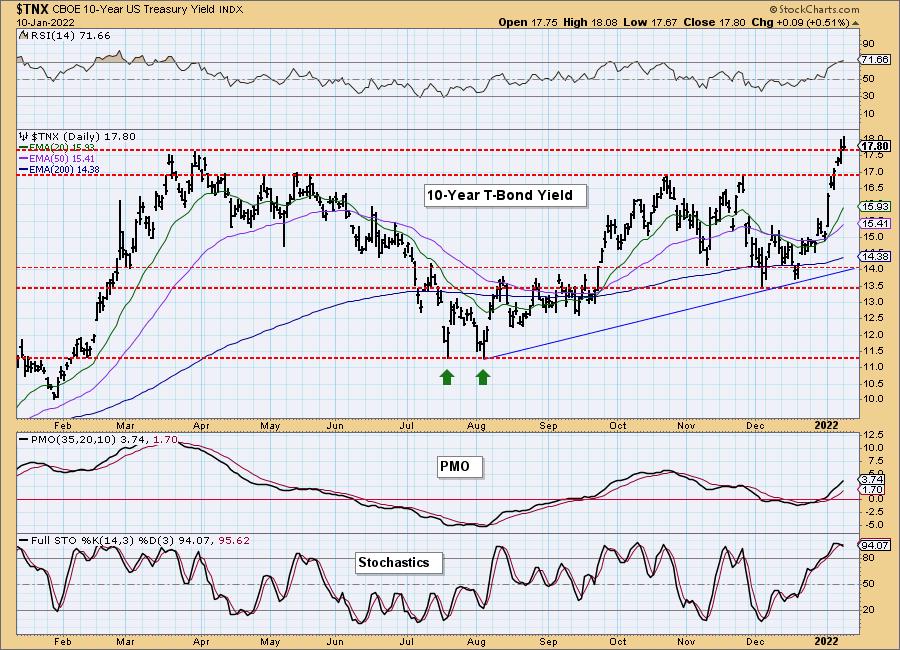
10-YEAR T-BOND YIELD
After breaking out to new highs, the 10-year yield is pausing but sitting atop new support. The RSI is overbought, but we've seen that condition persist as it did in February and March. The PMO is not overbought and is accelerating higher. Stochastics are oscillating above 80 which is bullish as well.
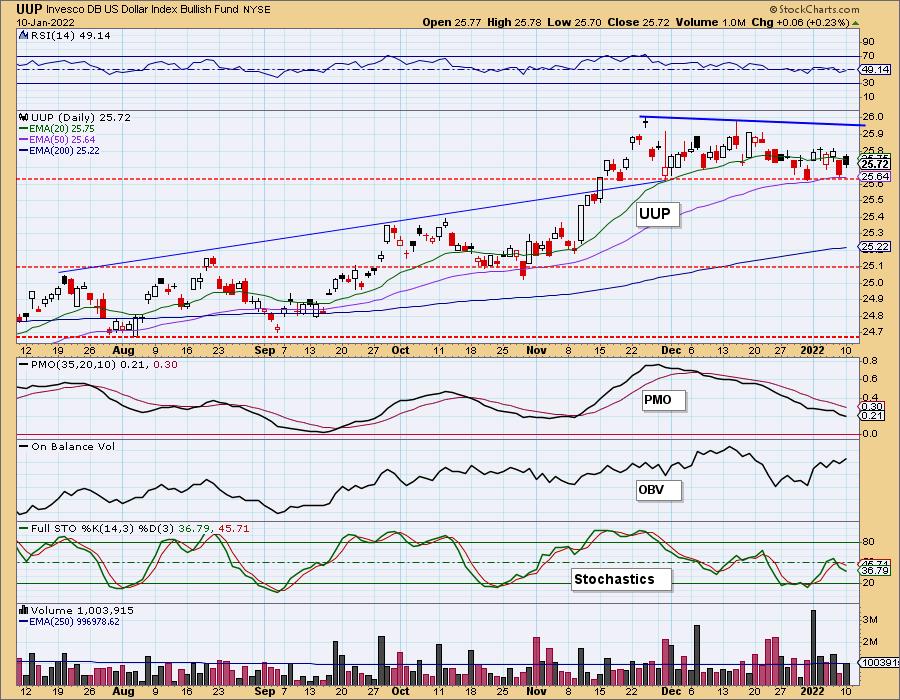
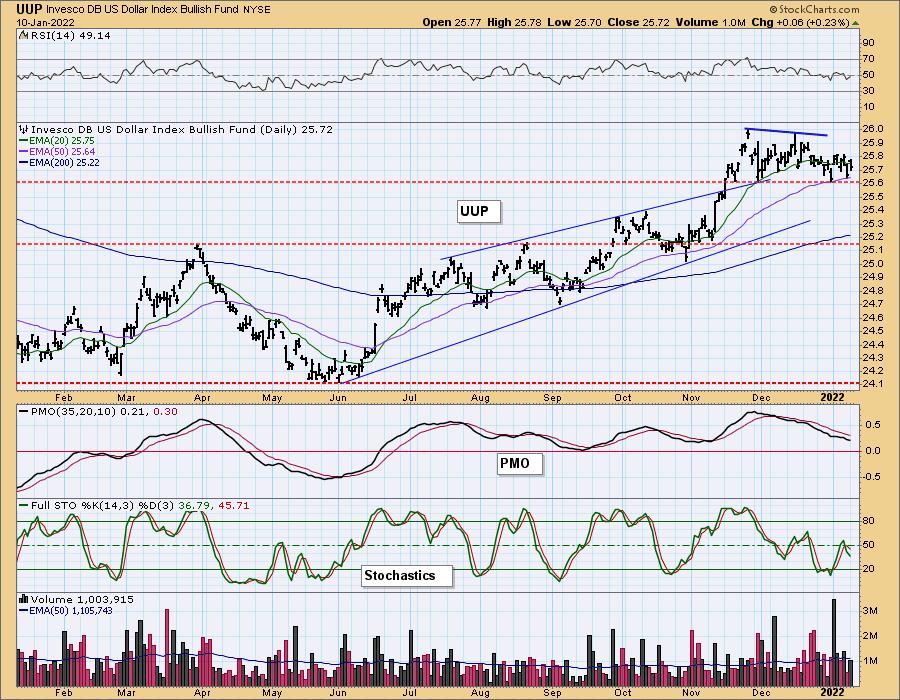
DOLLAR (UUP)
IT Trend Model: BUY as of 6/22/2021
LT Trend Model: BUY as of 8/19/2021
UUP Daily Chart: The Dollar created a bearish filled black candlestick, but overall UUP has been in consolidation mode. We do have a bearish descending triangle (declining tops, flat bottom) that suggests a breakdown will occur at the 50-day EMA. Stochastics and the PMO are declining while the RSI sits in negative territory just below net neutral (50). It appears the Dollar is arriving at a "decision point" given indicators, while negative, are decelerating and could mean another short ride to $25.90.
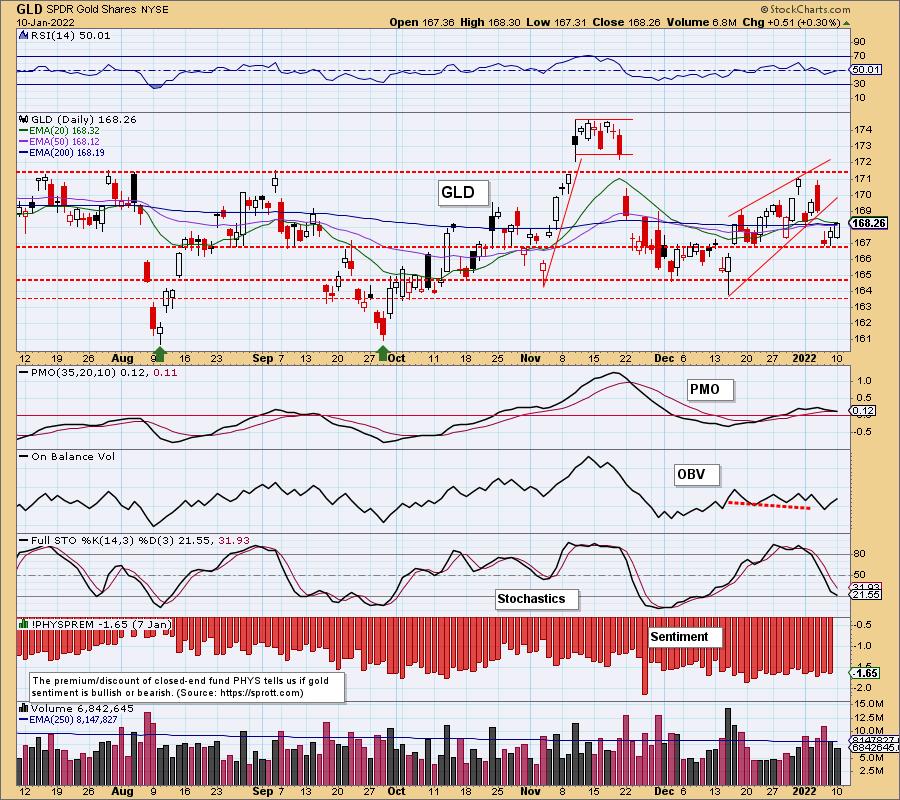
GOLD
IT Trend Model: BUY as of 12/29/2021
LT Trend Model: SELL as of 12/3/2021
GLD Daily Chart: GLD narrowly avoided a PMO crossover SELL signal today. It wasn't able to shed the "death cross" of the 50/200-day EMAs, but price is now above both. When we see Stochastics turn up, I'll get bullish. Right now indicators are neutral at best.
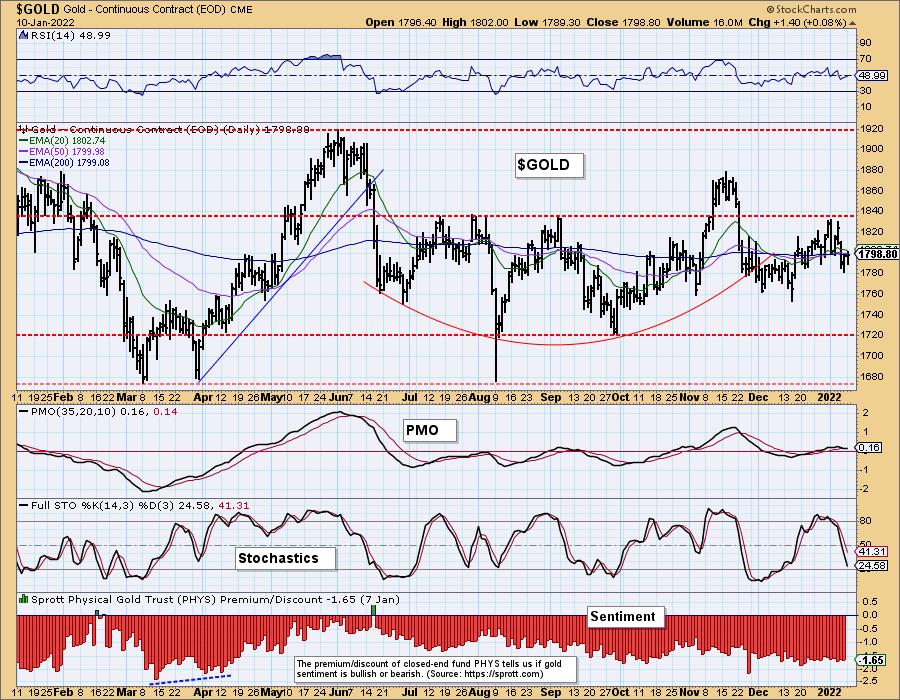
GOLD Daily Chart: Discounts are still elevated on PHYS, but it hasn't really resulted in much. Like the Dollar, Gold is also at a "decision point". As noted above, when Stochastics turn up I'll start looking for a rally. For now, I expect more sideways action with a possible melt up.
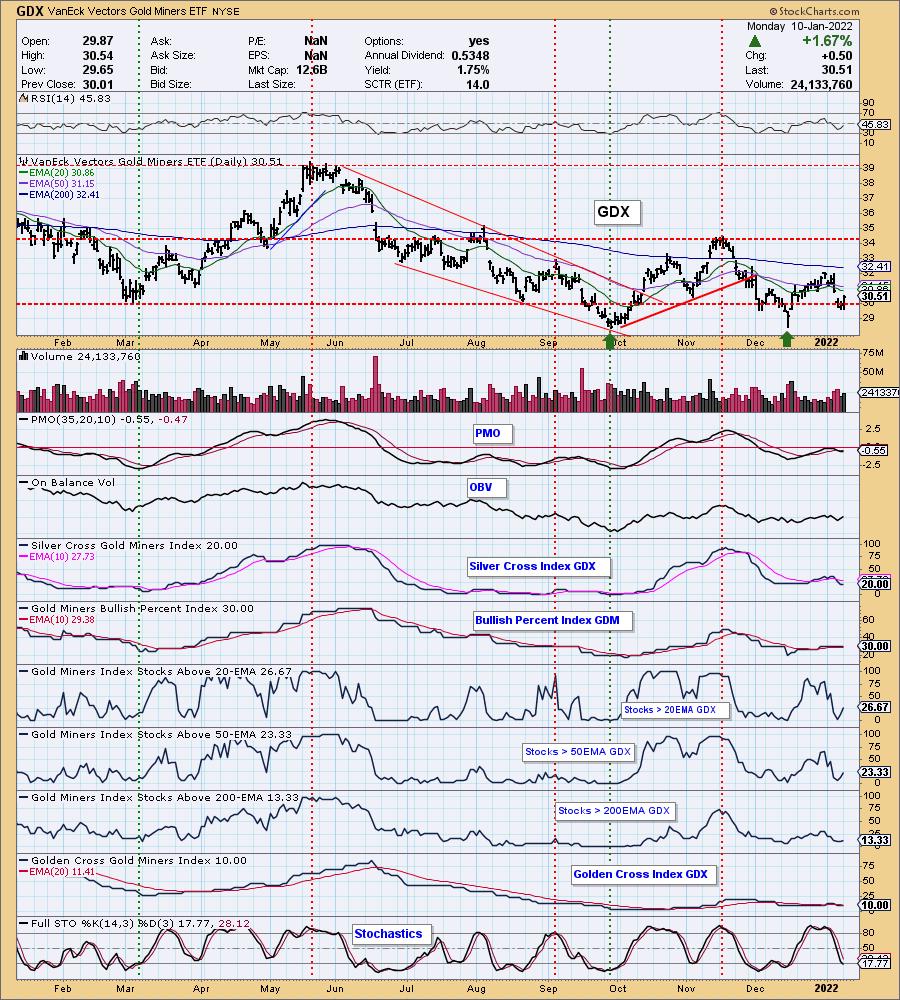
GOLD MINERS Golden and Silver Cross Indexes: Gold Miners did not look this good in the morning. The picture did improve by the close. Gap resistance is still going to be an issue, particularly given it aligns with the 20/50-day EMAs. The SCI has paused and now we are seeing some signs of life in participation.
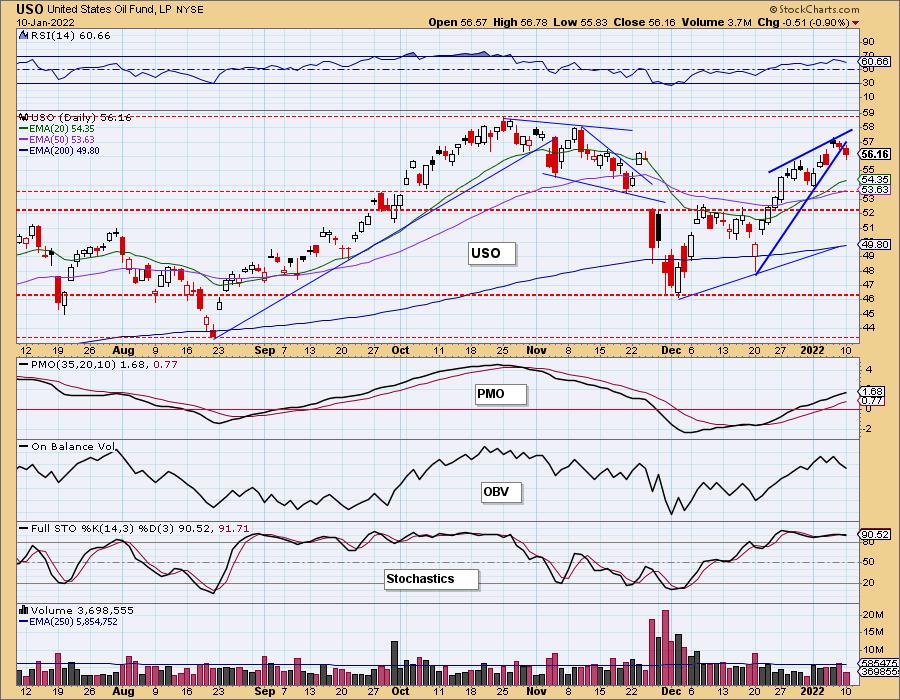
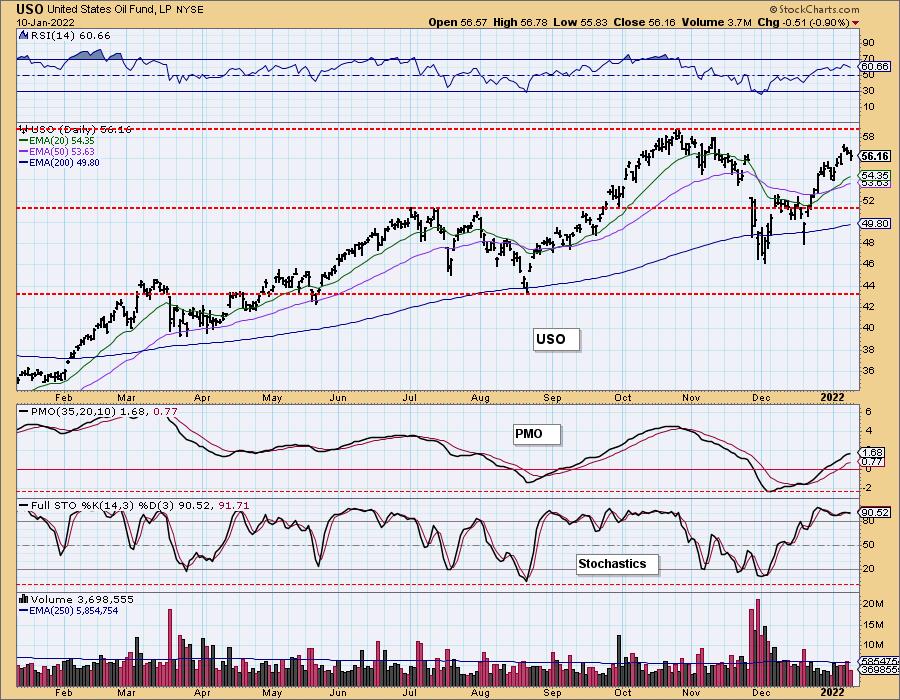
CRUDE OIL (USO)
IT Trend Model: BUY as of 1/3/2022
LT Trend Model: BUY as of 3/9/2021
USO Daily Chart: USO broke down from the bearish rising wedge. Indicators are still very bullish so this seems like digestion of the strong rally out of the mid-December low.
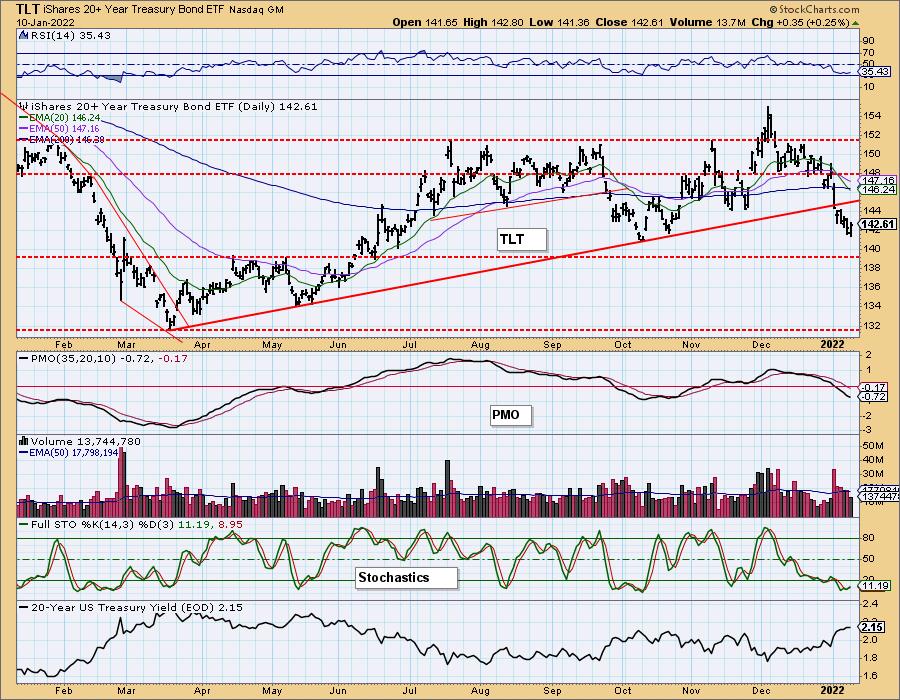
BONDS (TLT)
IT Trend Model: NEUTRALas of 1/5/2022
LT Trend Model: BUY as of 11/5/2021
TLT Daily Chart: Rising yields are killing TLT. It has reached strong short-term support at the October low and Stochastics are starting back up. However, I don't see rates moving significantly lower anytime soon.
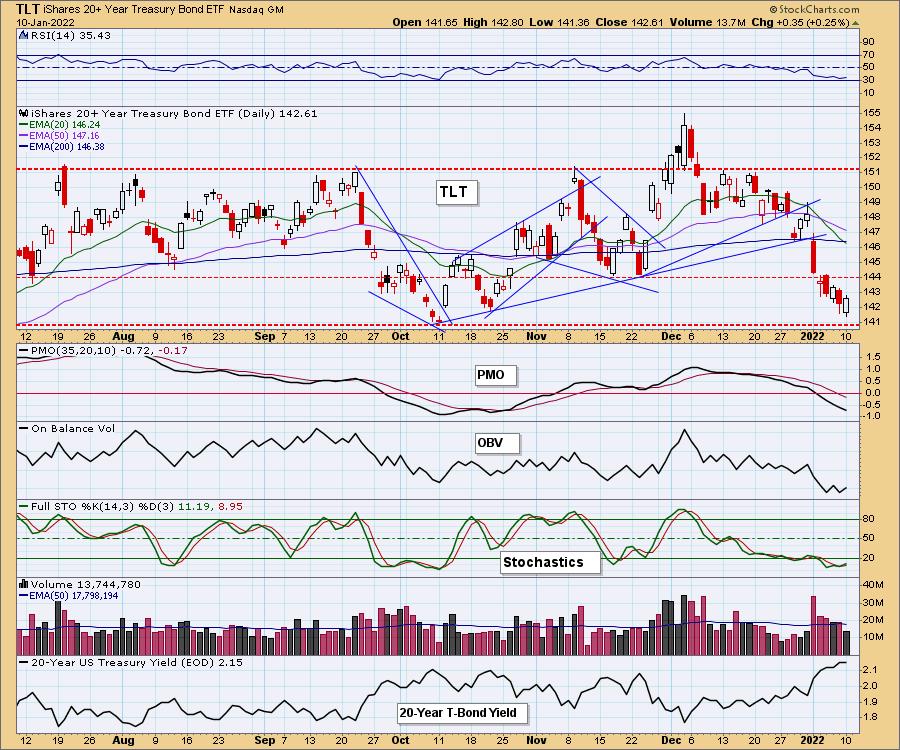
We can also see that while the October low could provide support, the strongest level of support is at $139. More than likely that level will need to be tested.
Happy Trading!
Erin Swenlin
erin@decisionpoint.com
Technical Analysis is a windsock, not a crystal ball.
--Carl Swenlin
(c) Copyright 2022 DecisionPoint.com
Disclaimer: This blog is for educational purposes only and should not be construed as financial advice. The ideas and strategies should never be used without first assessing your own personal and financial situation, or without consulting a financial professional. Any opinions expressed herein are solely those of the author, and do not in any way represent the views or opinions of any other person or entity.
NOTE: The signal status reported herein is based upon mechanical trading model signals, specifically, the DecisionPoint Trend Model. They define the implied bias of the price index based upon moving average relationships, but they do not necessarily call for a specific action. They are information flags that should prompt chart review. Further, they do not call for continuous buying or selling during the life of the signal. For example, a BUY signal will probably (but not necessarily) return the best results if action is taken soon after the signal is generated. Additional opportunities for buying may be found as price zigzags higher, but the trader must look for optimum entry points. Conversely, exit points to preserve gains (or minimize losses) may be evident before the model mechanically closes the signal.
Helpful DecisionPoint Links:
DecisionPoint Alert Chart List
DecisionPoint Golden Cross/Silver Cross Index Chart List
DecisionPoint Sector Chart List
Price Momentum Oscillator (PMO)
Swenlin Trading Oscillators (STO-B and STO-V)
DecisionPoint is not a registered investment advisor. Investment and trading decisions are solely your responsibility. DecisionPoint newsletters, blogs or website materials should NOT be interpreted as a recommendation or solicitation to buy or sell any security or to take any specific action.