
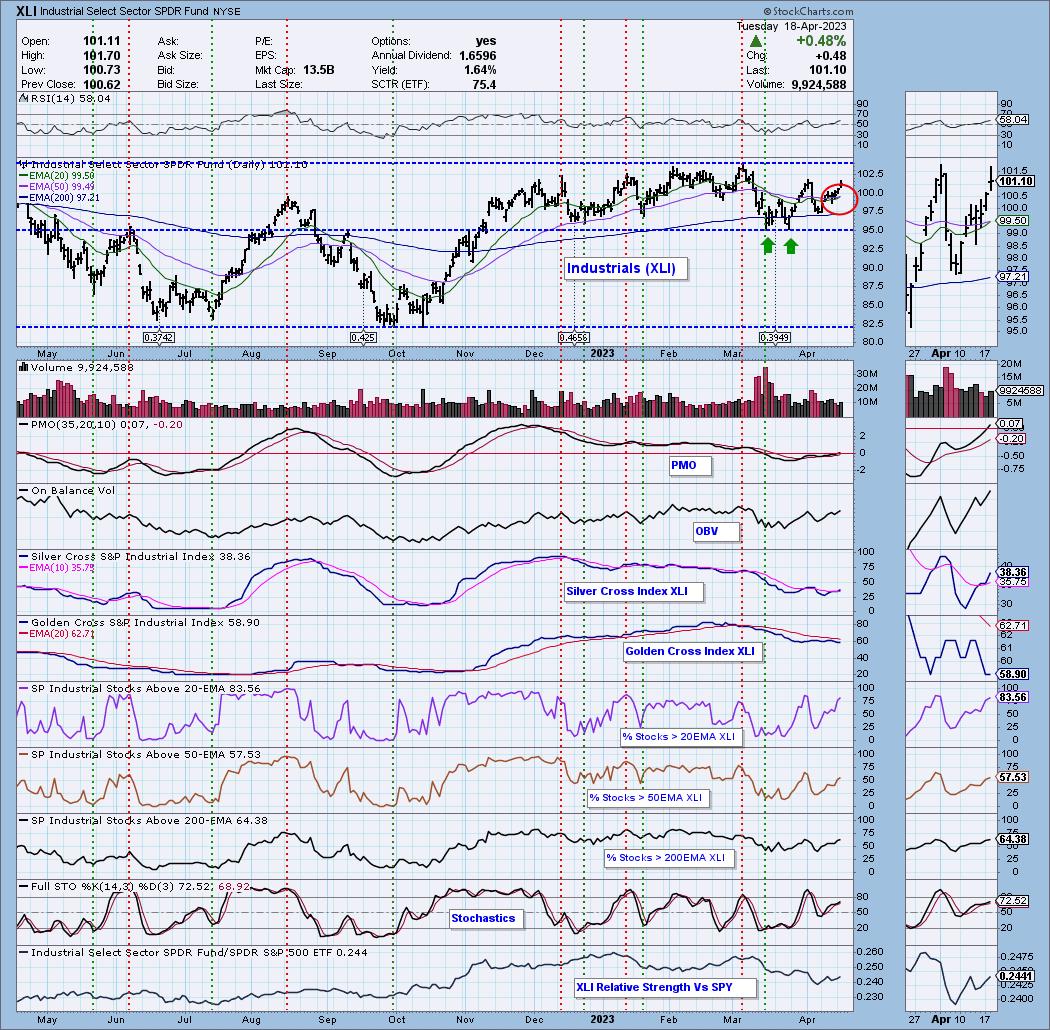
Today the Industrial Sector (XLI) 20-day EMA crossed up through the 50-day EMA (Silver Cross), generating an IT Trend Model BUY Signal. This is another whipsaw, the fifth 20/50-day EMA crossover in a year. XLI is clearly range bound. While participation is modestly bullish given 50%+ readings on Stocks above their 20/50/200-day EMAs with a Silver Cross Index that is rising (although below a 50% bullish reading), we still expect price to struggle once again at the top of the range.
The DecisionPoint Alert Weekly Wrap presents an end-of-week assessment of the trend and condition of the Stock Market, the U.S. Dollar, Gold, Crude Oil, and Bonds. The DecisionPoint Alert daily report (Monday through Thursday) is abbreviated and gives updates on the Weekly Wrap assessments.
Watch the latest episode of DecisionPoint on StockCharts TV's YouTube channel here!
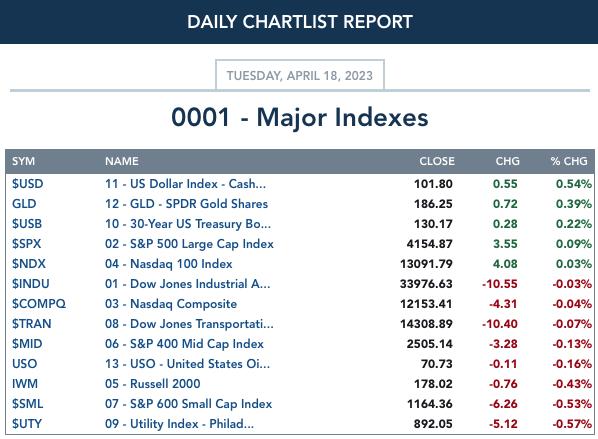
MAJOR MARKET INDEXES
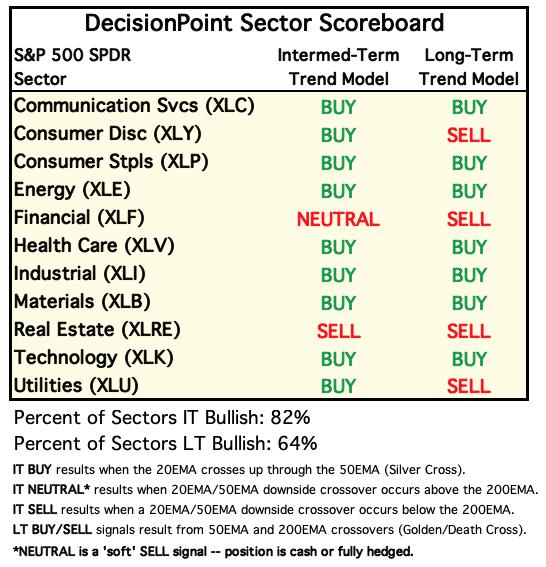
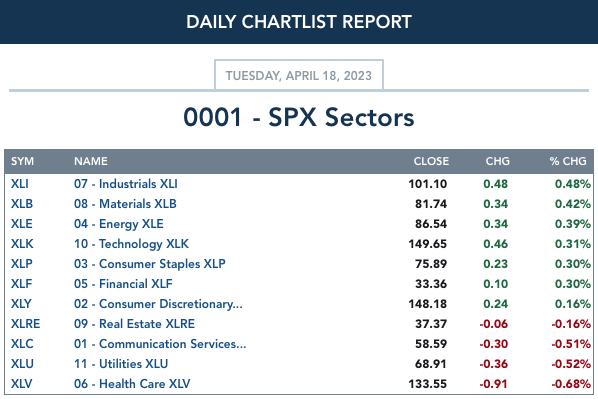
SECTORS
Each S&P 500 Index component stock is assigned to one of 11 major sectors. This is a snapshot of the Intermediate-Term (Silver Cross) and Long-Term (Golden Cross) Trend Model signal status for those sectors.
CLICK HERE for Carl's annotated Sector charts.
THE MARKET (S&P 500)
IT Trend Model: BUY as of 3/30/2023
LT Trend Model: BUY as of 3/29/2023
SPY Daily Chart: Today we saw the formation of a bearish filled black candlestick. These one-day patterns suggest a decline will follow the next day. The bearish rising wedge is about to be busted. While we favor a downside breakdown as the pattern calls for, the breakdown will be less a product of the wedge as simply price drifting out of it. Of course, a strong thrust downward would tell us more.
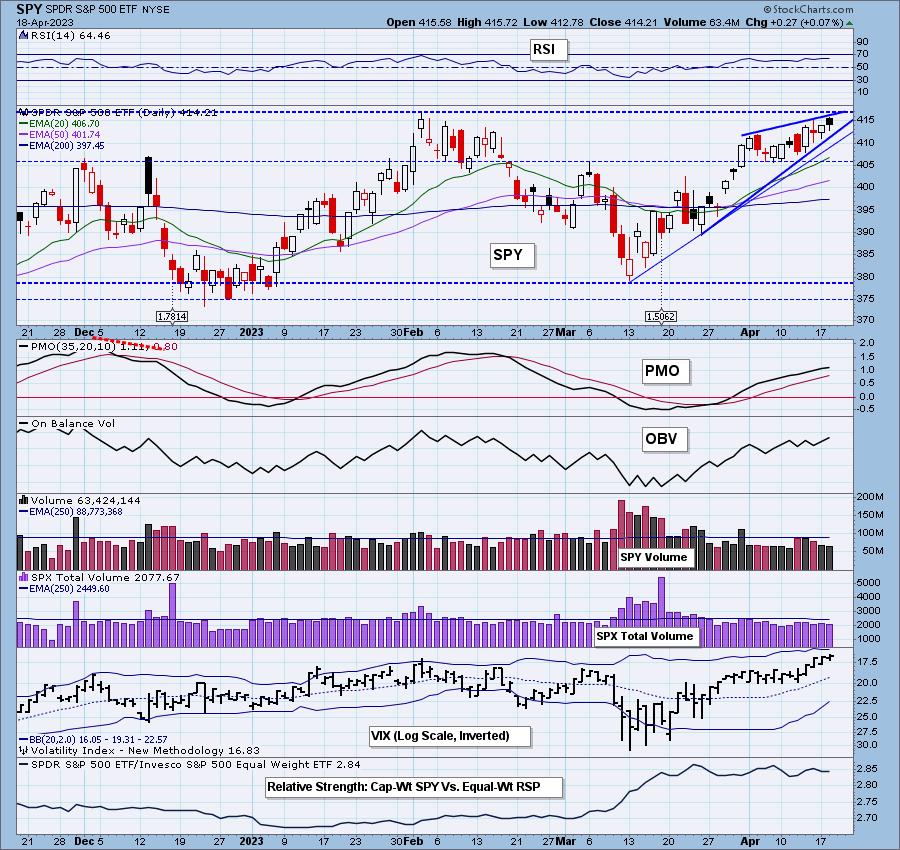
Primary indicators are still very positive. The RSI is comfortably within positive territory and is not overbought. The PMO is rising and isn't overbought. The VIX remains above its moving average and below the upper Bollinger Band on the inverted scale. Combine the VIX with Stochastics oscillating above 80 and we have internal strength.

Here is the latest recording:
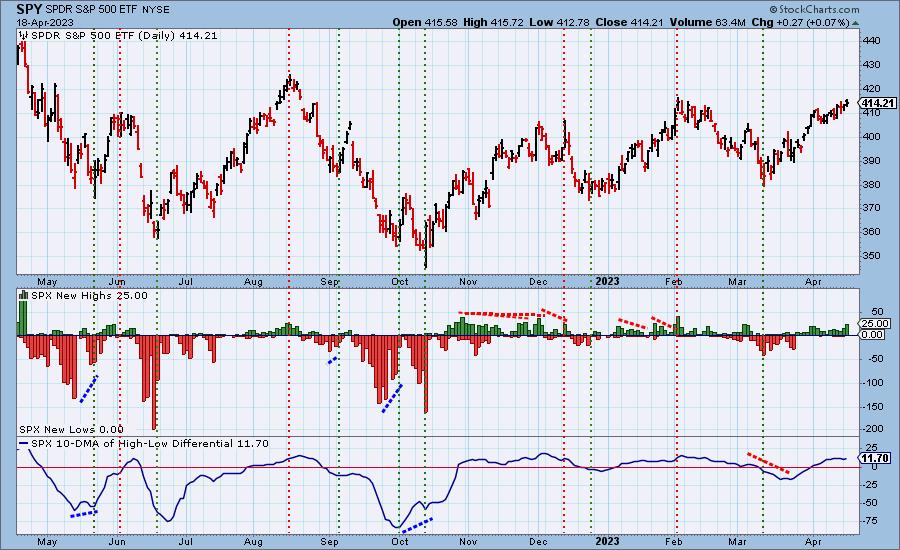
S&P 500 New 52-Week Highs/Lows: New Highs expanded quite a bit on today's mild rally. Remember this is an intraday reading. We see the intraday max value so we aren't reading too much into it. The 10-DMA of the High-Low Differential is rising again, but is near-term overbought.
Climax* Analysis: There were no climax readings today.
*A climax is a one-day event when market action generates very high readings in, primarily, breadth and volume indicators. We also include the VIX, watching for it to penetrate outside the Bollinger Band envelope. The vertical dotted lines mark climax days -- red for downside climaxes, and green for upside. Climaxes are at their core exhaustion events; however, at price pivots they may be initiating a change of trend.
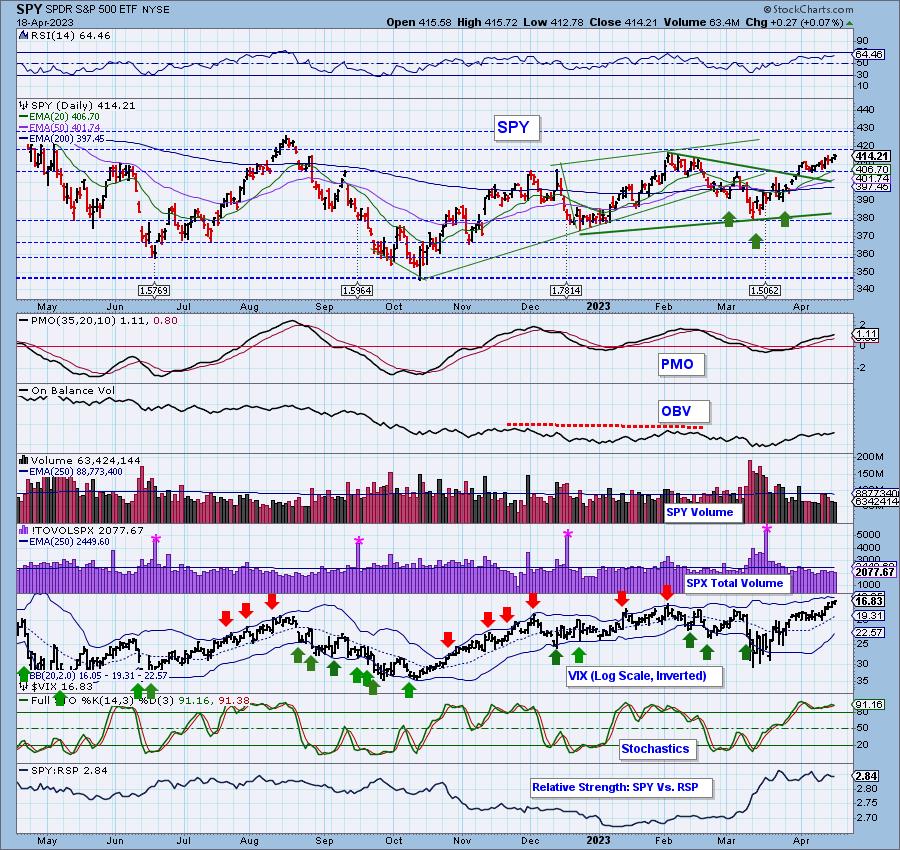
Short-Term Market Indicators: The short-term market trend is UP and the condition is NEUTRAL.
The negative divergences on this chart persist. The STOs both contracted today which isn't a good sign.
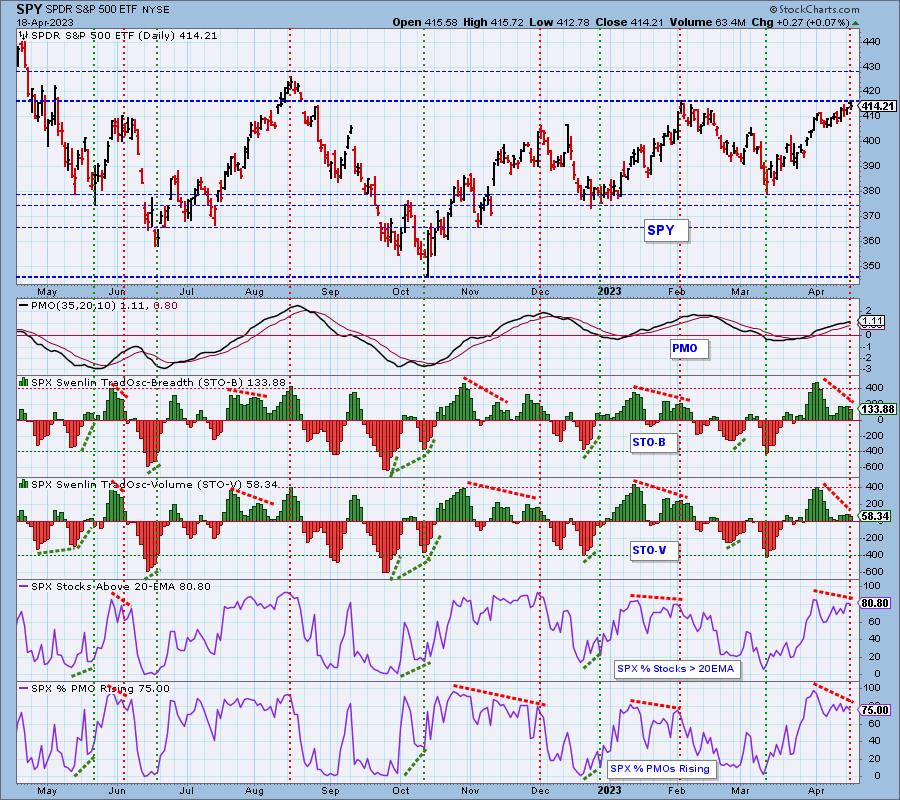
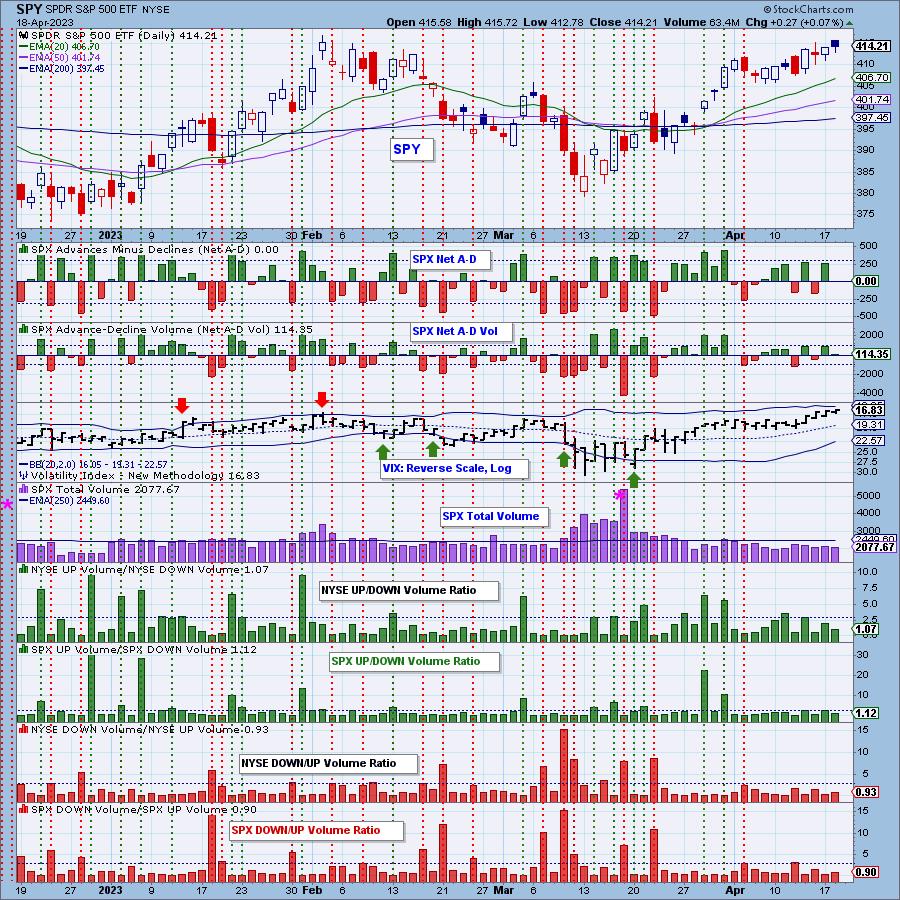
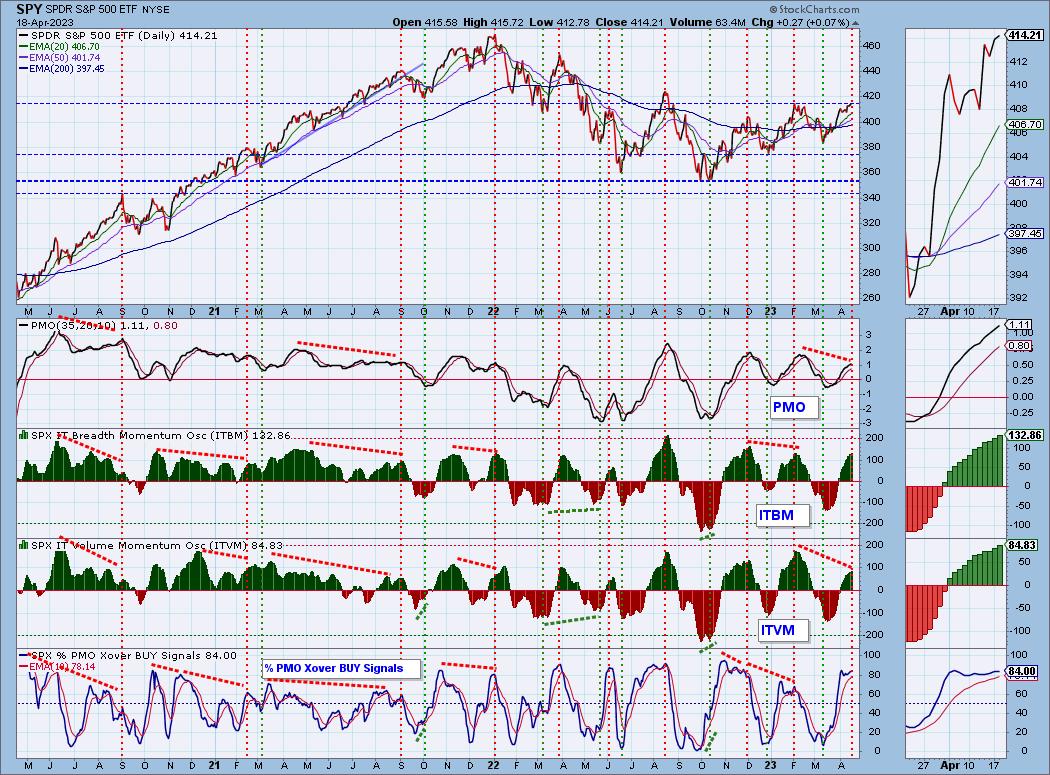
Intermediate-Term Market Indicators: The intermediate-term market trend is UP and the condition is OVERBOUGHT.
The ITBM and ITVM are still rising strongly, but they are very overbought. We suggest you look at prior market tops (marked with dotted red vertical lines) and note that the ITBM and ITVM top right near market tops. So far they are rising, but when they turn down, we will need to heed their warning.
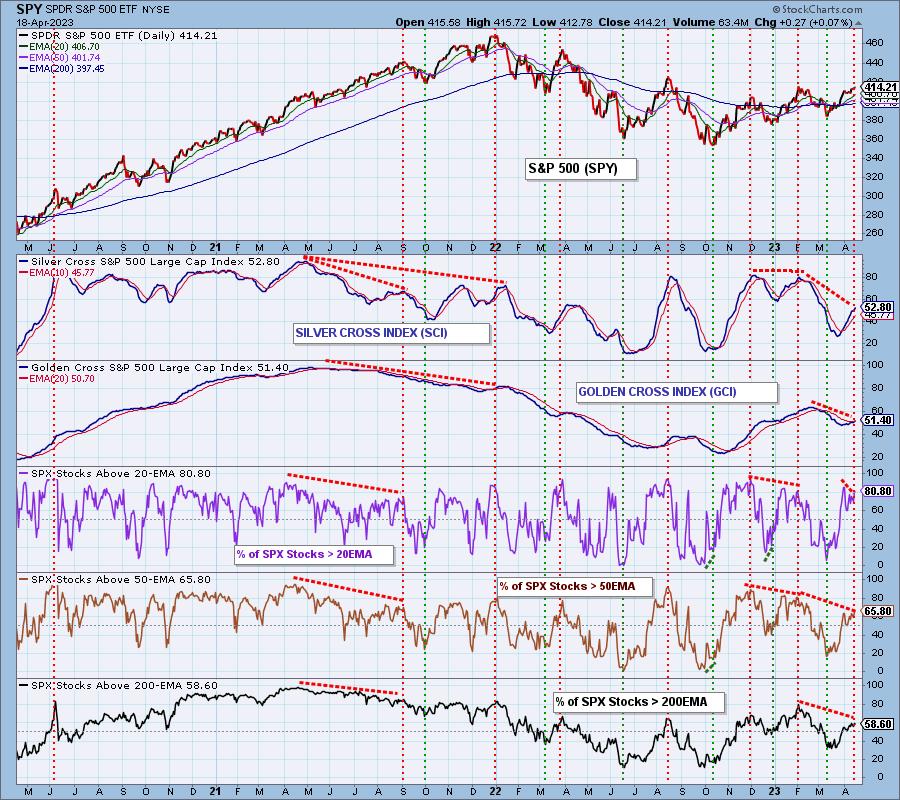
PARTICIPATION and BIAS Assessment: The following chart objectively shows the depth and trend of participation in two time frames.
- Intermediate-Term - the Silver Cross Index (SCI) shows the percentage of SPX stocks on IT Trend Model BUY signals (20-EMA > 50-EMA). The opposite of the Silver Cross is a "Dark Cross" -- those stocks are, at the very least, in a correction.
- Long-Term - the Golden Cross Index (GCI) shows the percentage of SPX stocks on LT Trend Model BUY signals (50-EMA > 200-EMA). The opposite of a Golden Cross is the "Death Cross" -- those stocks are in a bear market.
The market bias is BULLISH in all three timeframes.
The Silver Cross Index (SCI) and Golden Cross Index (GCI) continue to rise with the GCI accomplishing a positive crossover its signal line. We have participation readings that are all above our 50% bullish threshold. We do note that negative divergences are visible on all of these indicators so it does take the shine off that bullish bias.
CONCLUSION: The market continues to push higher, but we are seeing underlying problems that suggest this won't continue much longer. Today's candlestick alongside topping STOs and a mature bearish rising wedge suggest we will see a pause at the very least. IT indicators as well as Stochastics, the PMO and the RSI are still bullish. We think we are getting early warning on an approaching market top given all of the negative divergences. Consider playing defense now. Might be a good time to tighten up stops or at the very least set hard, not mental stops.
Erin is 30% long, 2% short.
Have you subscribed the DecisionPoint Diamonds yet? DP does the work for you by providing handpicked stocks/ETFs from exclusive DP scans! Add it with a discount! Contact support@decisionpoint.com for more information!
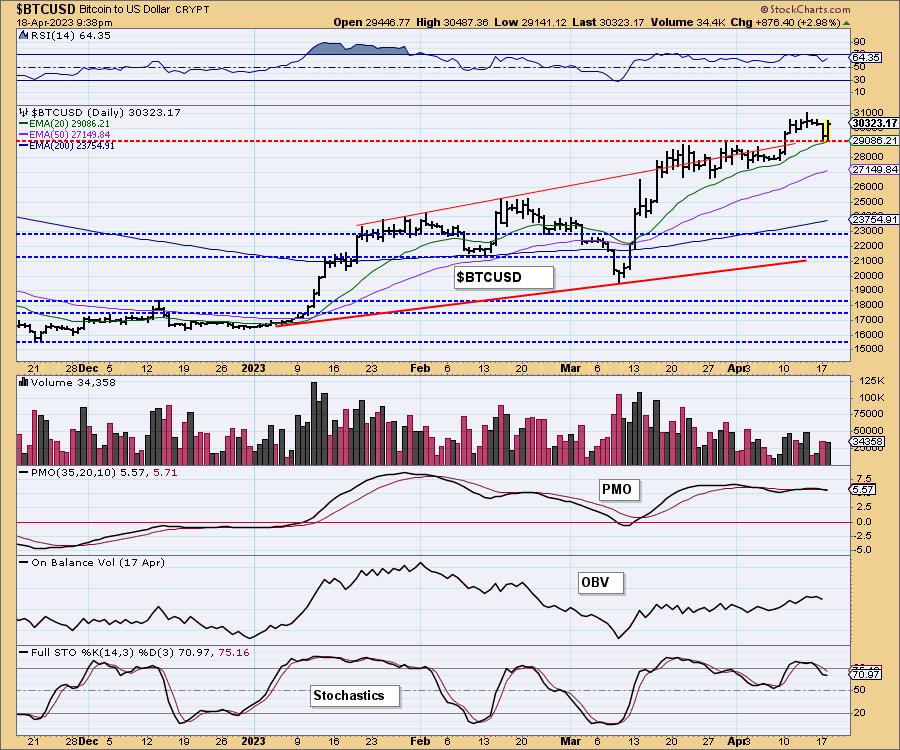
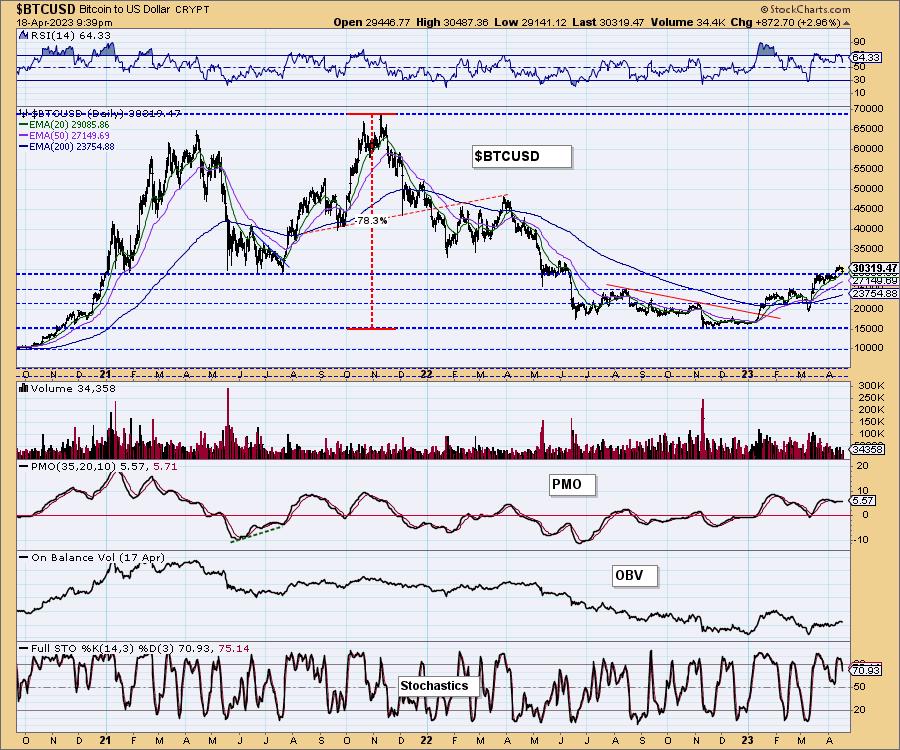
BITCOIN
After breakout out above strong long-term overhead resistance, Bitcoin is having a textbook decline back toward the breakout point. The indicators were negative enough to expect this level of support to not hold. They are still weak given the PMO is on a SELL signal and Stochastics are still technically declining. We would look for some sideways movement here with a possible breakdown ahead.
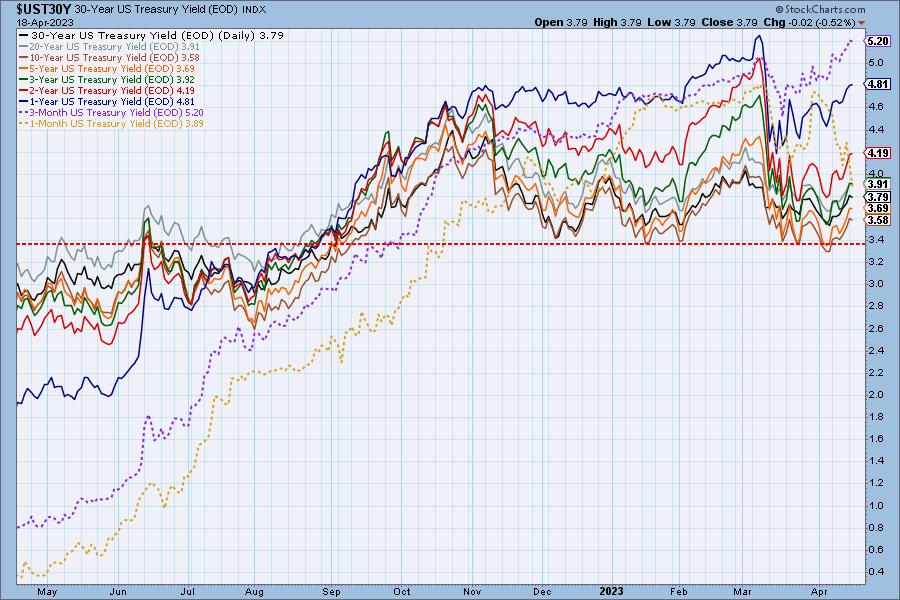
INTEREST RATES
Yields are rising. We expect them to continue to rise toward this year's highs. Bond are under pressure.
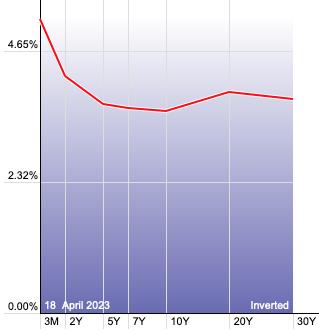
The Yield Curve Chart from StockCharts.com shows us the inversions taking place. The red line should move higher from left to right. Inversions are occurring where it moves downward.
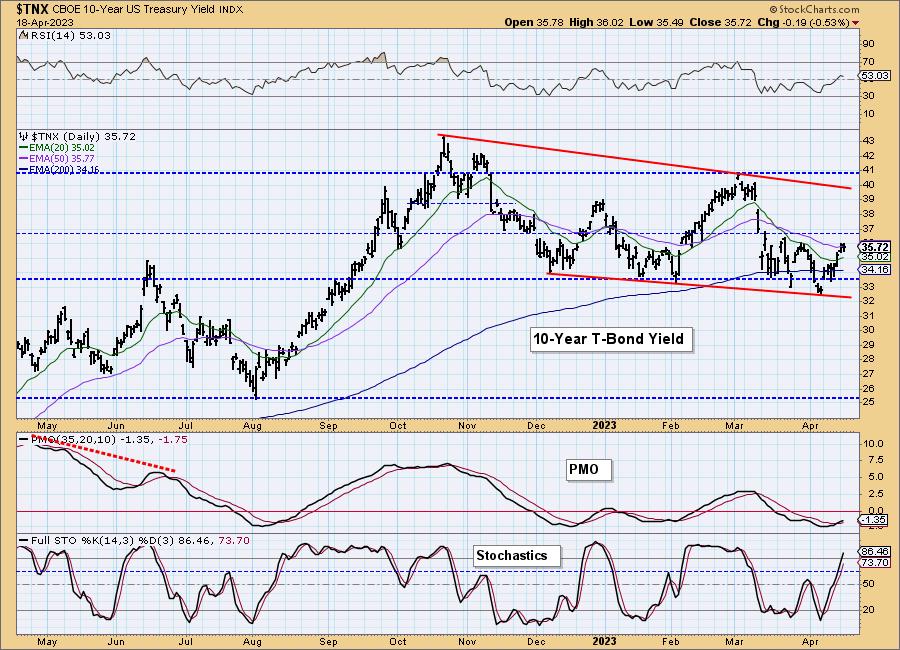
10-YEAR T-BOND YIELD
The indicators are still very positive on today's decline. The RSI did fall a bit on the decline today, but remain in positive territory. The PMO is rising on an oversold BUY signal. Stochastics moved above 80 today. While overhead resistance is nearing, we are looking for a breakout there.
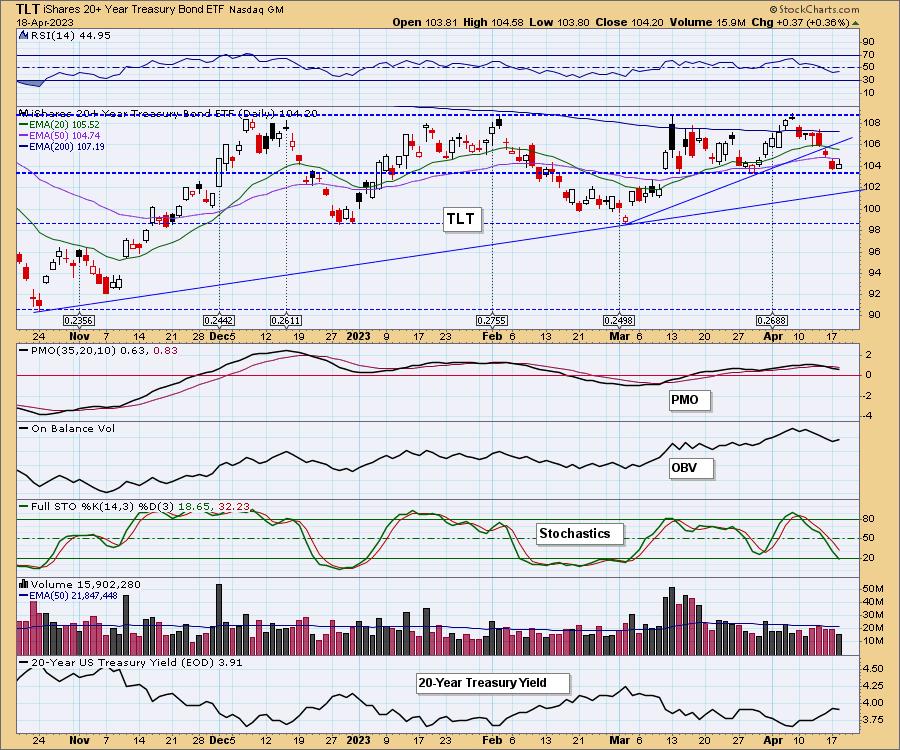
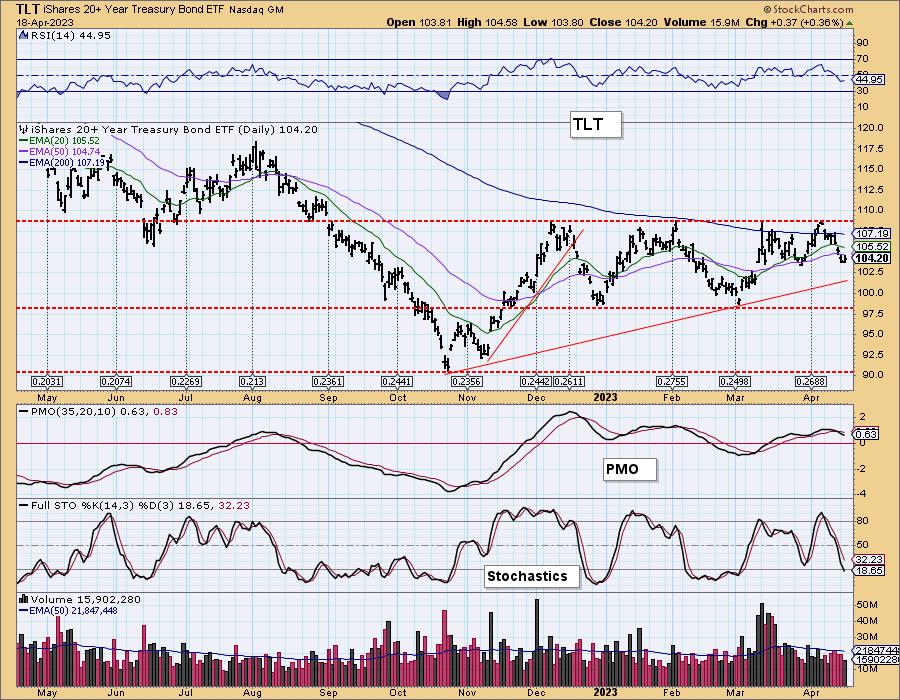
BONDS (TLT)
IT Trend Model: BUY as of 3/17/2023
LT Trend Model: SELL as of 1/19/2022
TLT Daily Chart: TLT held support today, but it didn't improve any of the indicators. We could certainly see this short-term trading range extend, but we would look for a test of the bottom of the intermediate-term trading range at 98.50. We believe the 20-year yield will move higher from here.
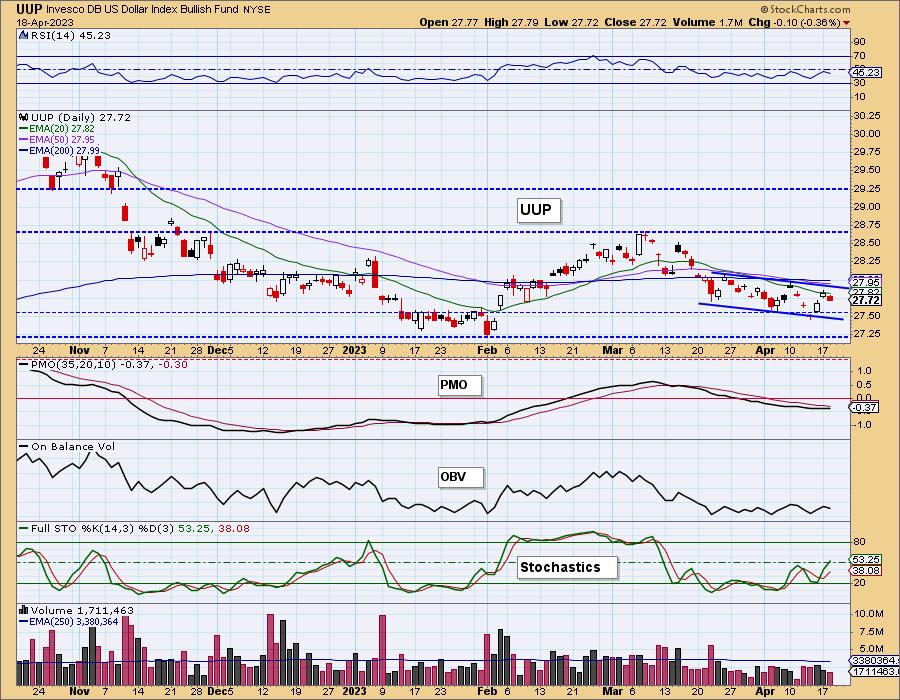
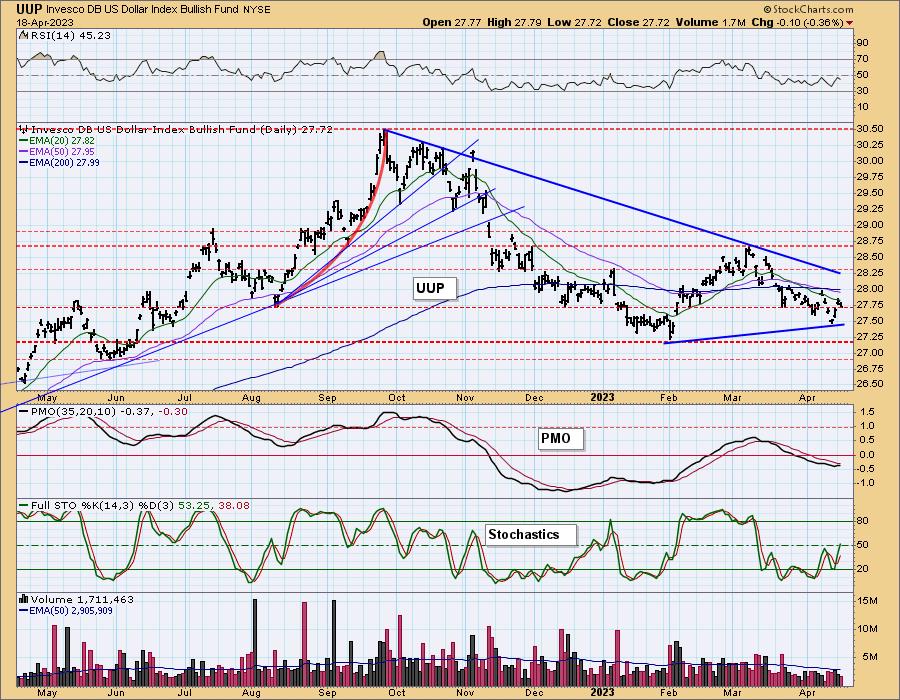
DOLLAR (UUP)
IT Trend Model: NEUTRAL as of 3/28/2023
LT Trend Model: SELL as of 4/12/2023
UUP Daily Chart: The Dollar failed to get above the 20-day EMA. Indicators are trying to improve. We consider Stochastics and early warning indicator and it is rising after reaching above net neutral (50). The PMO is basically neutral. We still see that the Dollar is essentially in a declining trend channel. Ultimately we don't expect much out of the Dollar right now in either direction.
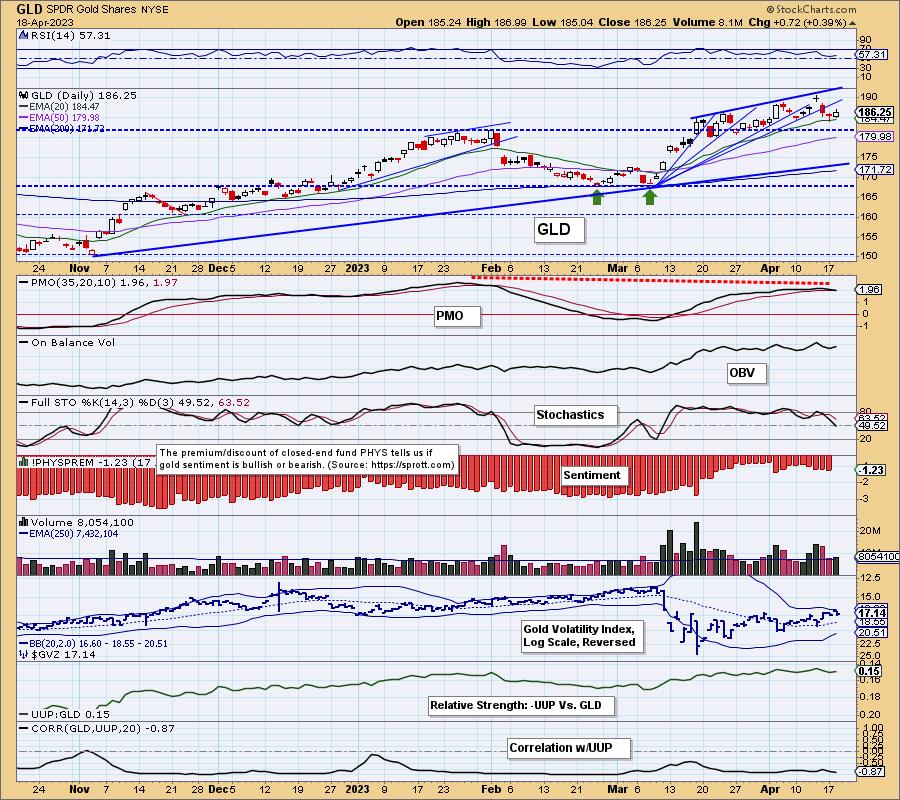
GOLD
IT Trend Model: BUY as of 3/7/2023
LT Trend Model: BUY as of 1/5/2023
GLD Daily Chart: Gold finished higher today. It is in a gently rising trend and so far is holding above the 20-day EMA. The PMO is the big problem on the chart. Today GLD saw a PMO Crossover SELL Signal. The RSI is still positive, but Stochastics have dropped below net neutral (50).
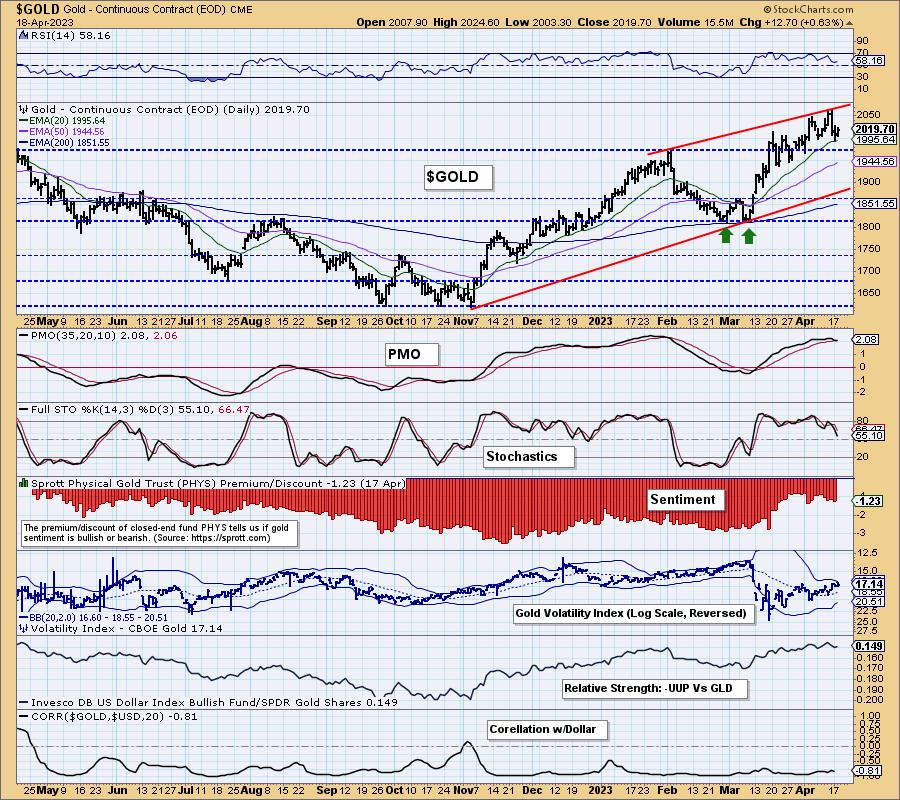
$GOLD Daily Chart: Investors are getting more bearish on Gold given discounts on PHYS are expanding. That isn't helping. At this point we believe Gold will drop lower and test the February high. We will have to reevaluate at that time, but it is certainly vulnerable to testing the longer-term rising bottoms trendline.
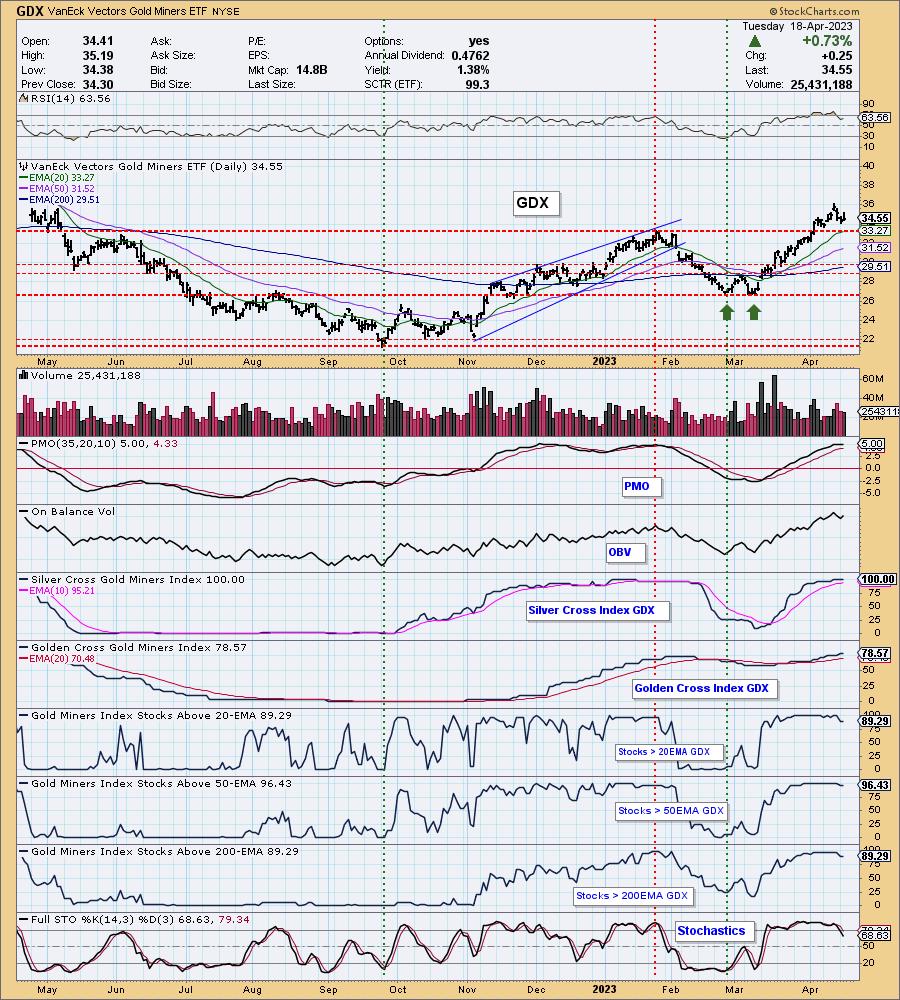
GOLD MINERS Golden and Silver Cross Indexes: Gold Miners did alright today as Gold and the market were higher. We don't believe this pullback is over. This certainly could just be a hiccup, but we are noticing some slight deterioration in participation. In the past, this has usually preceded declines. The PMO is very overbought and it has now topped. We would be very careful with this group right now.
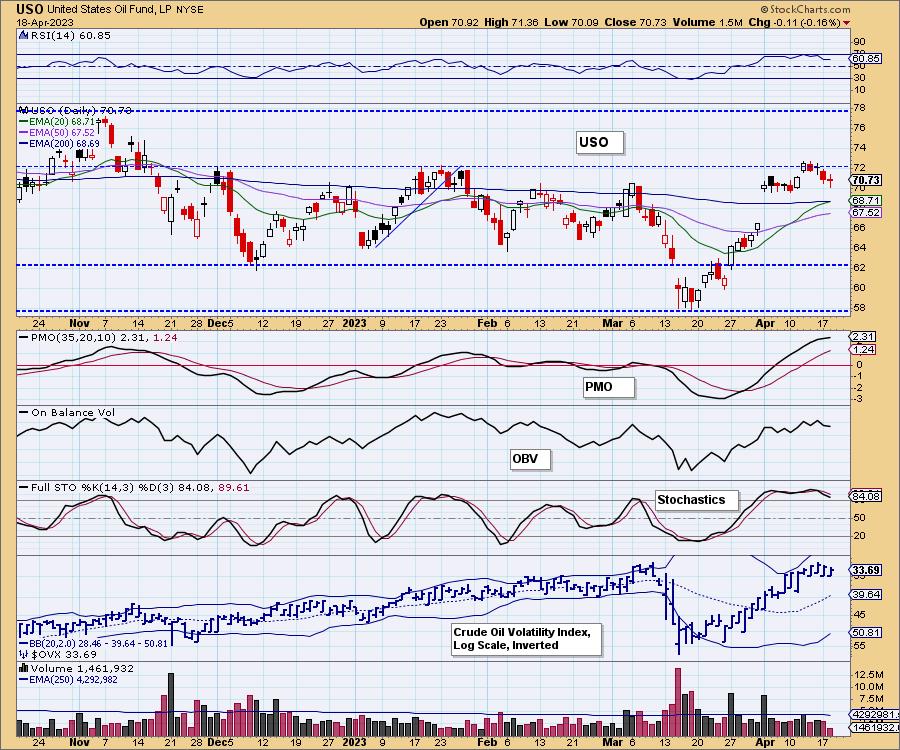
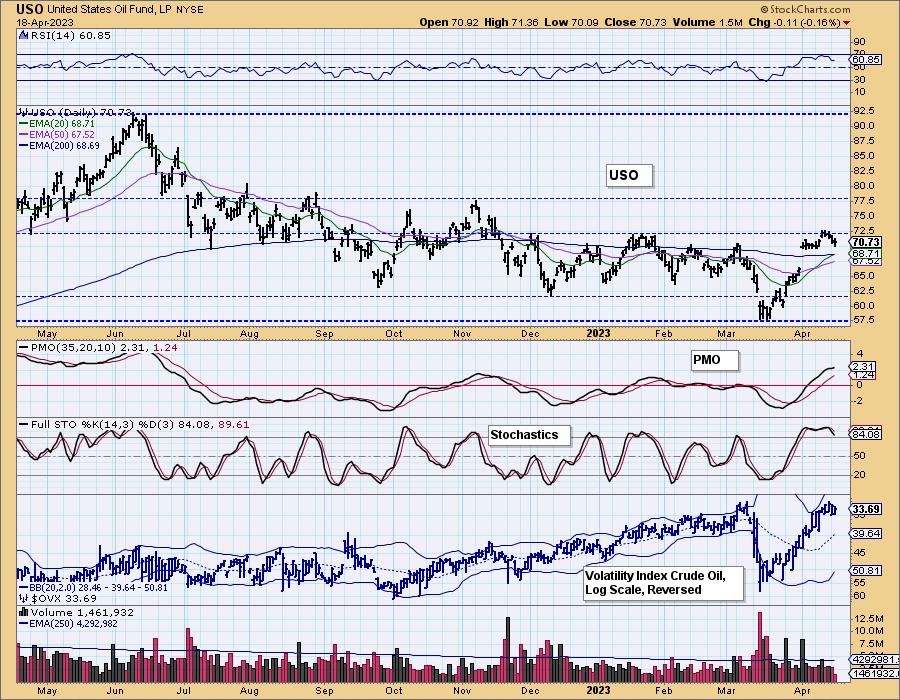
CRUDE OIL (USO)
IT Trend Model: BUY as of 4/10/2023
LT Trend Model: SELL as of 12/6/2022
USO Daily Chart: Yesterday's comments still apply:
"Crude Oil hit the top of its trading range and stalled. Last week's gap was filled. That usually means more downside. However, the indicators haven't broken down much. The RSI is positive and the PMO is still rising. Stochastics are above 80. $OVX, the volatility index for Oil is overbought. At this point, we expect gap support to be tested just below $70. Ultimately we favor a breakout after a period of consolidation above gap support. We will change our tune quickly if the PMO turns down because it is very overbought."
Good Luck & Good Trading!
Erin Swenlin and Carl Swenlin
Technical Analysis is a windsock, not a crystal ball. --Carl Swenlin
(c) Copyright 2023 DecisionPoint.com
Disclaimer: This blog is for educational purposes only and should not be construed as financial advice. The ideas and strategies should never be used without first assessing your own personal and financial situation, or without consulting a financial professional. Any opinions expressed herein are solely those of the author, and do not in any way represent the views or opinions of any other person or entity.
NOTE: The signal status reported herein is based upon mechanical trading model signals, specifically, the DecisionPoint Trend Model. They define the implied bias of the price index based upon moving average relationships, but they do not necessarily call for a specific action. They are information flags that should prompt chart review. Further, they do not call for continuous buying or selling during the life of the signal. For example, a BUY signal will probably (but not necessarily) return the best results if action is taken soon after the signal is generated. Additional opportunities for buying may be found as price zigzags higher, but the trader must look for optimum entry points. Conversely, exit points to preserve gains (or minimize losses) may be evident before the model mechanically closes the signal.
Helpful DecisionPoint Links:
DecisionPoint Alert Chart List
DecisionPoint Golden Cross/Silver Cross Index Chart List
DecisionPoint Sector Chart List
Price Momentum Oscillator (PMO)
Swenlin Trading Oscillators (STO-B and STO-V)
DecisionPoint is not a registered investment advisor. Investment and trading decisions are solely your responsibility. DecisionPoint newsletters, blogs or website materials should NOT be interpreted as a recommendation or solicitation to buy or sell any security or to take any specific action.