
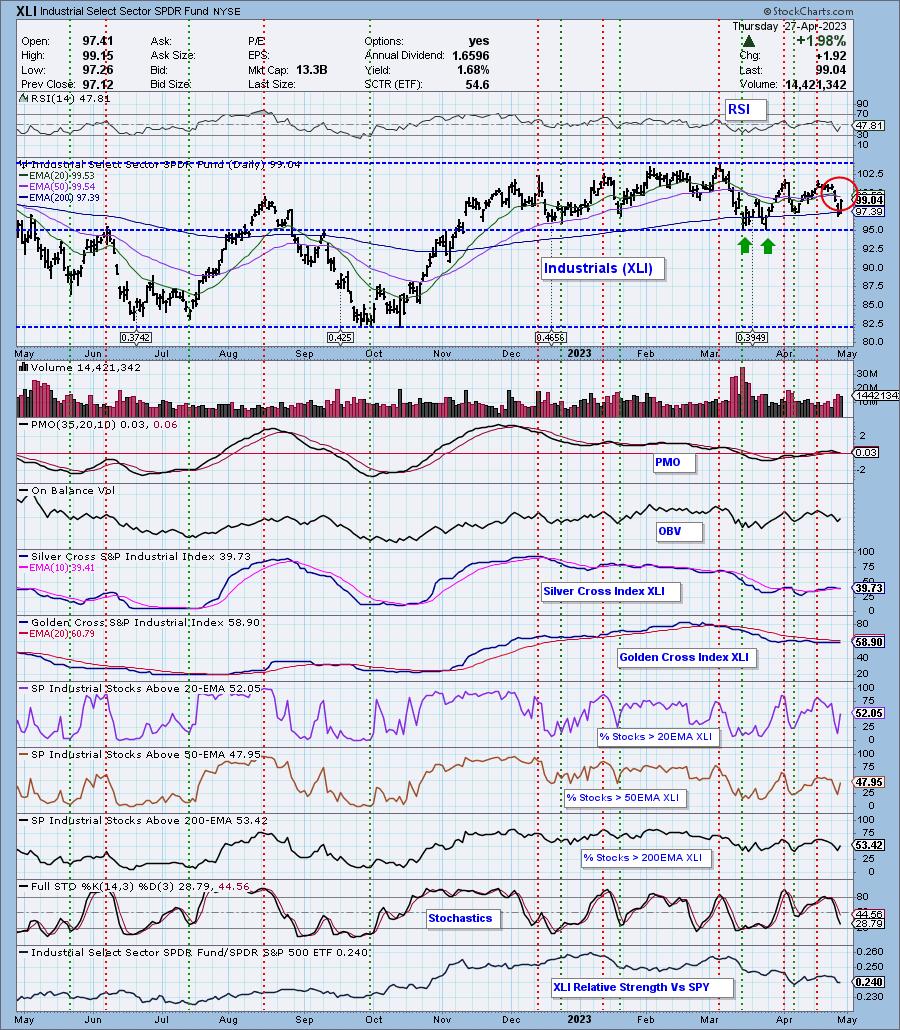
Today the Industrial Sector (XLI) 20-day EMA crossed down through the 50-day EMA (Dark Cross) above the 200-day EMA, generating an IT Trend Model NEUTRAL Signal. To be fair, if price had gone higher today, the crossover would not have happened. A rally above the 50-day EMA will likely reverse the signal. Participation ticked up nicely today, but we still don't have a bullish 50%+ reading on %Stocks > 50/200-day EMAs. The Silver Cross Index had a Bear Shift downside signal line crossover which shouldn't be ignored.
The DecisionPoint Alert Weekly Wrap presents an end-of-week assessment of the trend and condition of the Stock Market, the U.S. Dollar, Gold, Crude Oil, and Bonds. The DecisionPoint Alert daily report (Monday through Thursday) is abbreviated and gives updates on the Weekly Wrap assessments.
Watch the latest episode of DecisionPoint on StockCharts TV's YouTube channel here!
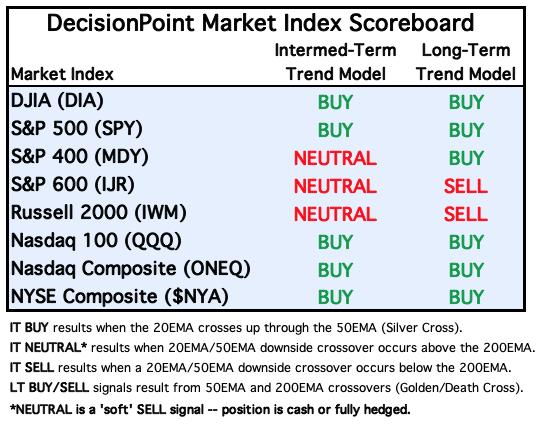
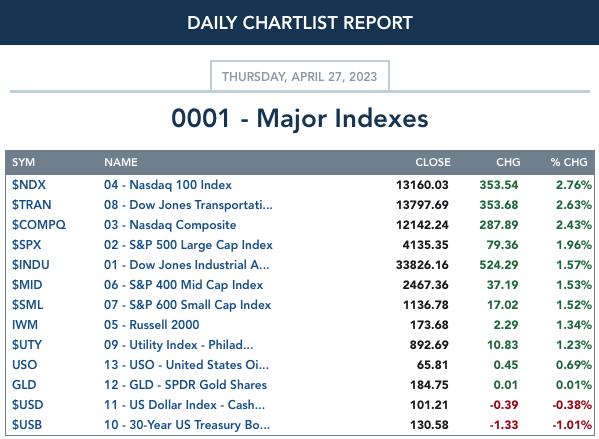
MAJOR MARKET INDEXES
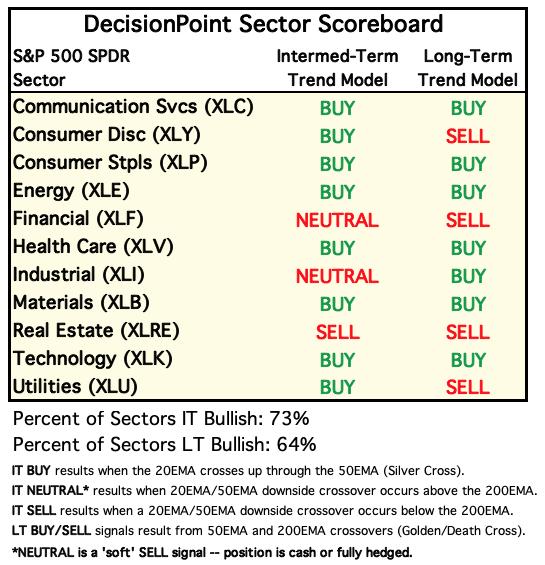
SECTORS
Each S&P 500 Index component stock is assigned to one of 11 major sectors. This is a snapshot of the Intermediate-Term (Silver Cross) and Long-Term (Golden Cross) Trend Model signal status for those sectors.
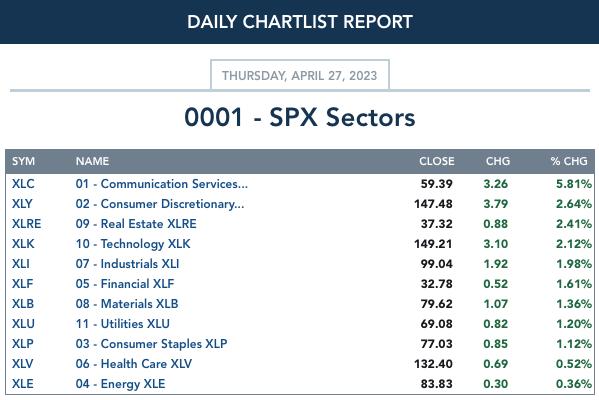
CLICK HERE for Carl's annotated Sector charts.
THE MARKET (S&P 500)
IT Trend Model: BUY as of 3/30/2023
LT Trend Model: BUY as of 3/29/2023
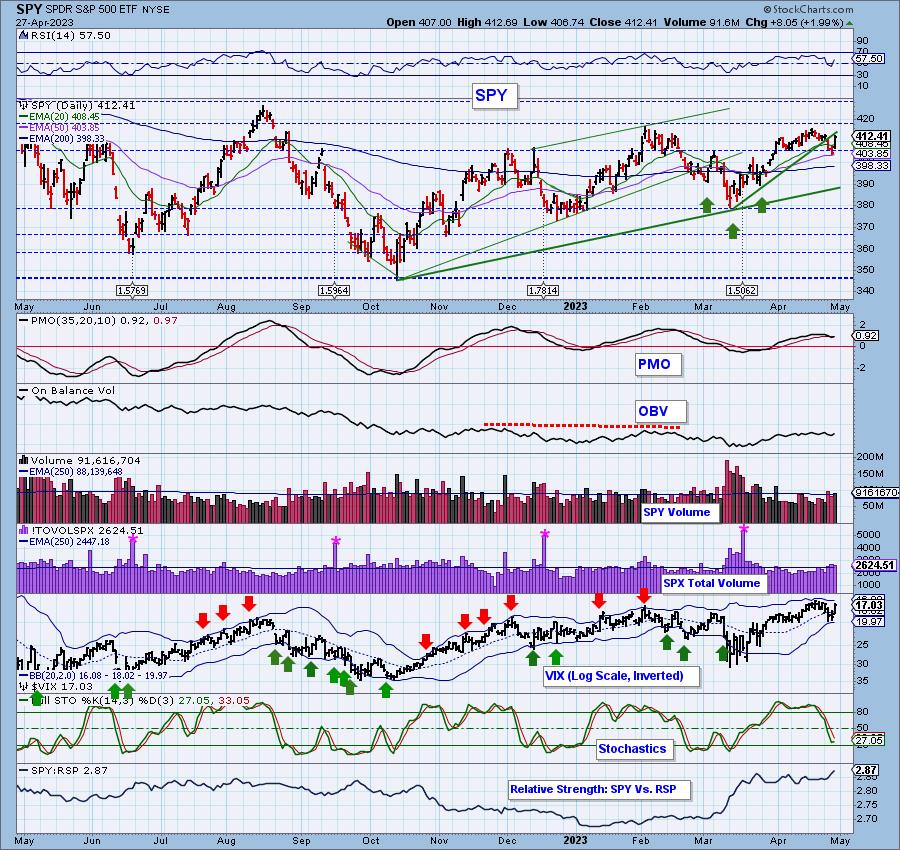
SPY Daily Chart: After yesterday's significant breakdown, price came roaring back today with an almost 2% rally. This was unexpected to us, we had figured we would see a pause or small rally. The rally broke the short-term declining trend and was led by aggressive sectors like Communication Services (XLC), Consumer Discretionary (XLY) and Technology (XLK). If we see this switch up with defensive sectors leading the market higher, we would expect an intermediate-term decline.
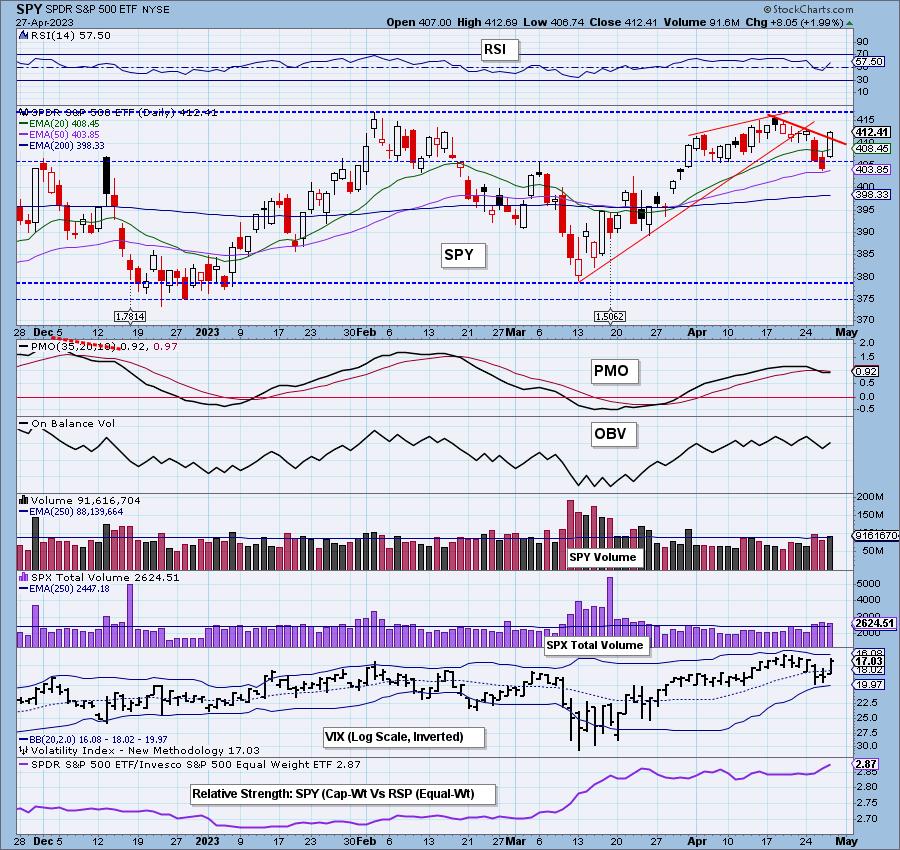
The indicators were mildly impressed with today's rally. The RSI certainly jetted back into positive territory, but Stochastics barely ticked up. The PMO did tick up 0.01, but a PMO BUY Signal would impress us more. The VIX popped on our inverted scale, nearly reaching the upper Bollinger Band. This reading can be considered overbought.
Notice that relative strength of the SPY to equally-weighted RSP rose quite a bit today. This tells us that it was the mega- and large-cap stocks that led this rally. We need a broader rally to get behind a sticky upside reversal.

Here is the latest recording:
S&P 500 New 52-Week Highs/Lows: New Highs expanded close to prior levels as we would expect. Interestingly, the 10-DMA of the High-Low Differential which had just turned down yesterday, turned back up today which is bullish.
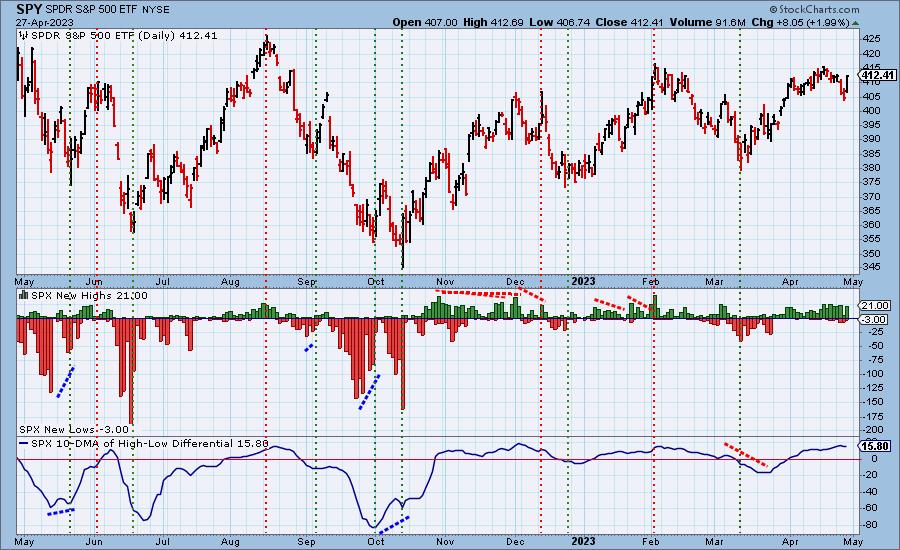
Climax* Analysis: Today there were strong, unanimous climax readings on all four relative indicators, giving us an upside initiation climax.
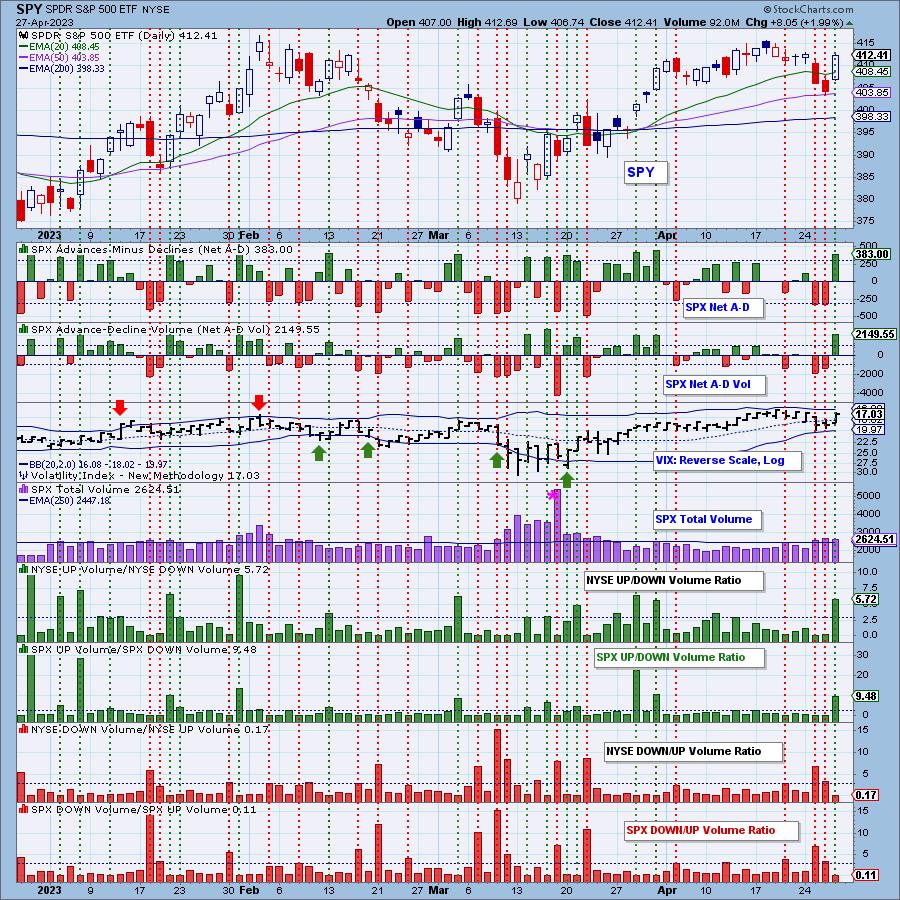
*A climax is a one-day event when market action generates very high readings in, primarily, breadth and volume indicators. We also include the VIX, watching for it to penetrate outside the Bollinger Band envelope. The vertical dotted lines mark climax days -- red for downside climaxes, and green for upside. Climaxes are at their core exhaustion events; however, at price pivots they may be initiating a change of trend.
Short-Term Market Indicators: The short-term market trend is DOWN and the condition is OVERSOLD.
The STOs were impressed by today's rally and turned up. They can be jumpy at times like this so we don't want to read too much into their expansion today, but it certainly suggests some follow-through on today's rally. Participation did expand, but remains below our 50% bullish threshold.
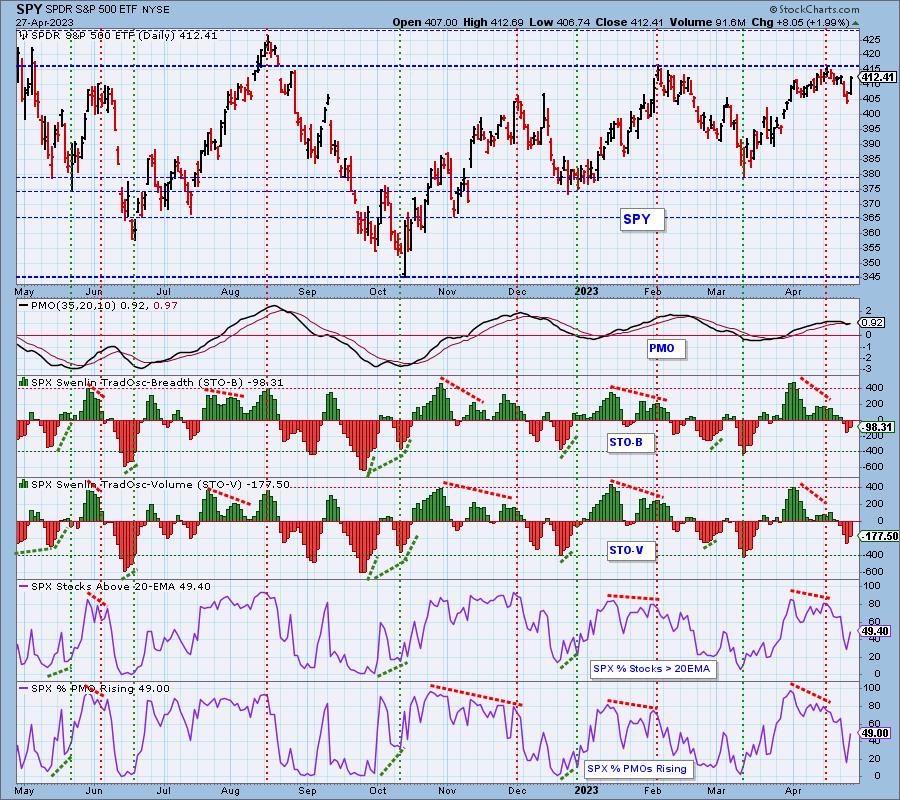
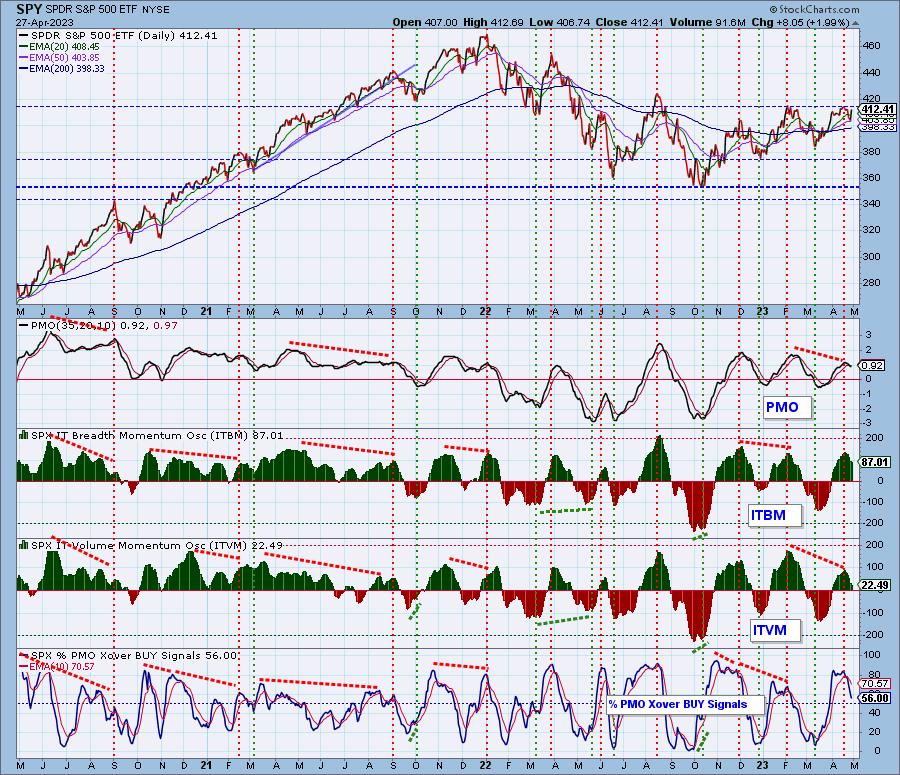
Intermediate-Term Market Indicators: The intermediate-term market trend is UP and the condition is OVERBOUGHT.
The ITBM/ITVM were unimpressed with today's rally as they continued to decline. Had they turned up, we would be singing a different tune, but they suggest any rally right now would be short. We still have more than 50% of stocks with PMO BUY Signals, but this reading is still higher than the number of actual rising PMOs, so it could continue lower tomorrow as they did today.
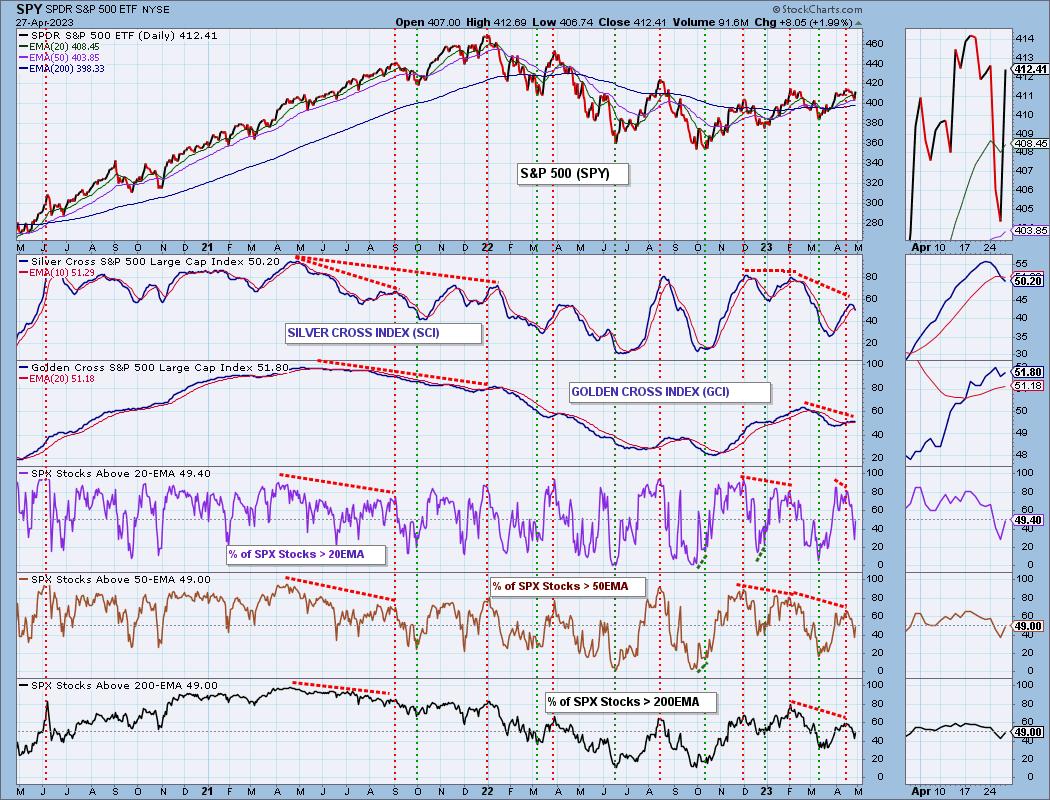
PARTICIPATION and BIAS Assessment: The following chart objectively shows the depth and trend of participation in two time frames.
- Intermediate-Term - the Silver Cross Index (SCI) shows the percentage of SPX stocks on IT Trend Model BUY signals (20-EMA > 50-EMA). The opposite of the Silver Cross is a "Dark Cross" -- those stocks are, at the very least, in a correction.
- Long-Term - the Golden Cross Index (GCI) shows the percentage of SPX stocks on LT Trend Model BUY signals (50-EMA > 200-EMA). The opposite of a Golden Cross is the "Death Cross" -- those stocks are in a bear market.
The short-term bias is BEARISH.
The intermediate-term bias is BEARISH.
The long-term bias is BEARISH.
In spite of today's rally, we are not ready to move any of the biases to Neutral or Bullish.
The bias moved quickly to 'bearish' in all three timeframes. %Stocks above their 20/50/200-day EMAs are below the 50% bullish threshold. This decimation of participation caused both the SCI and GCI to turn lower and given the %Stocks > 20/50/200-day EMAs hold percentages that are lower than the SCI and GCI, we know the SCI/GCI can continue lower.
CONCLUSION: Today's rally was forceful, forceful enough to give us an upside initiation climax and to turn our Swenlin Trading Oscillators higher. We also saw the PMO tick upward. However, with IT indicators still in decline and 50% bullish thresholds not being met yet on participation, we don't think this will be lasting. It does give us an excellent opportunity to begin selling into strength if the IT indicators don't reverse. Should those indicators reverse higher, we will reevaluate our intermediate-term bearish stance, but honestly those indicators are overbought and need to see oversold readings first. This is part of the reason we aren't getting overly excited about today's rally being the beginning of something special.
Erin is 30% long, 4% short.
Have you subscribed the DecisionPoint Diamonds yet? DP does the work for you by providing handpicked stocks/ETFs from exclusive DP scans! Add it with a discount! Contact support@decisionpoint.com for more information!
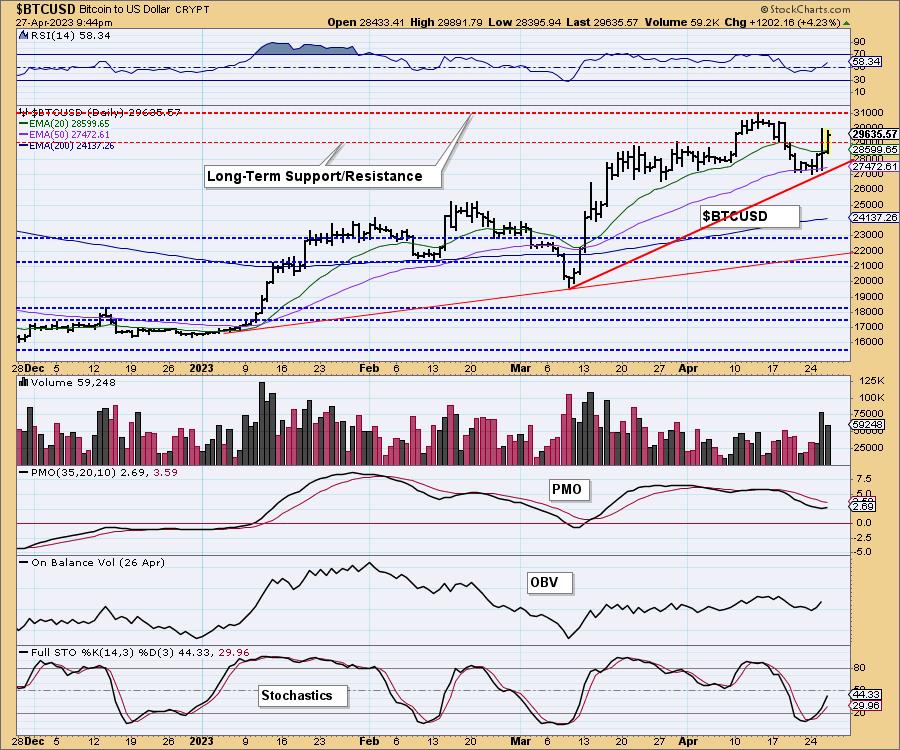
BITCOIN
Bitcoin broke back above prior support and appears ready to push past resistance at the April high. The RSI is rising in positive territory and the PMO has turned up. Stochastics are headed higher. Bitcoin looks very bullish right now.
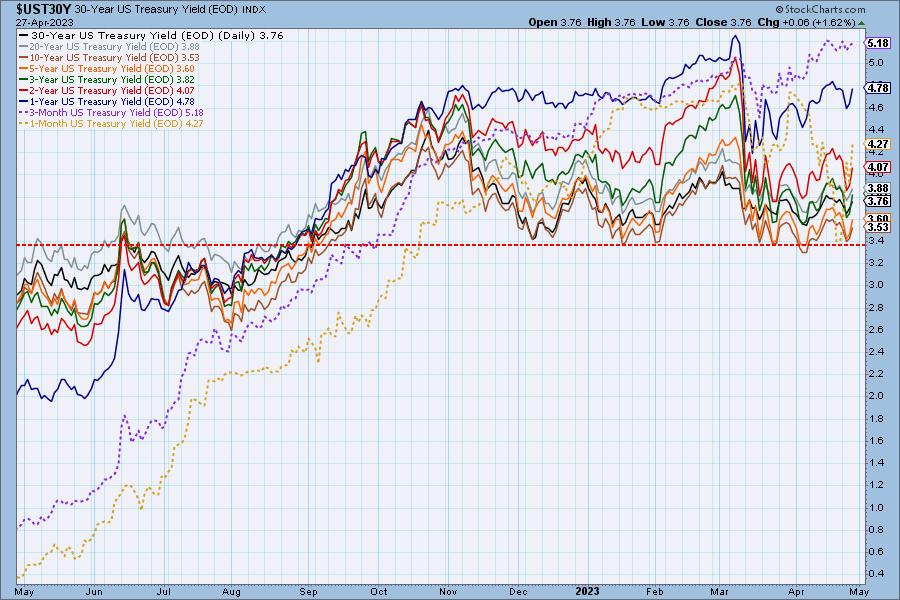
INTEREST RATES
Yields moved higher today. Many decided to get out of Bonds to take advantage of a possible new rally in stocks and that likely pushed yields higher.
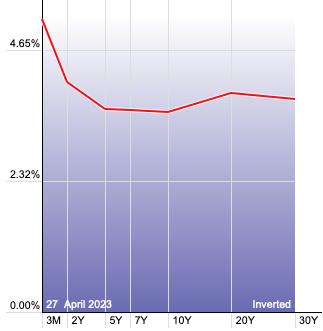
The Yield Curve Chart from StockCharts.com shows us the inversions taking place. The red line should move higher from left to right. Inversions are occurring where it moves downward.
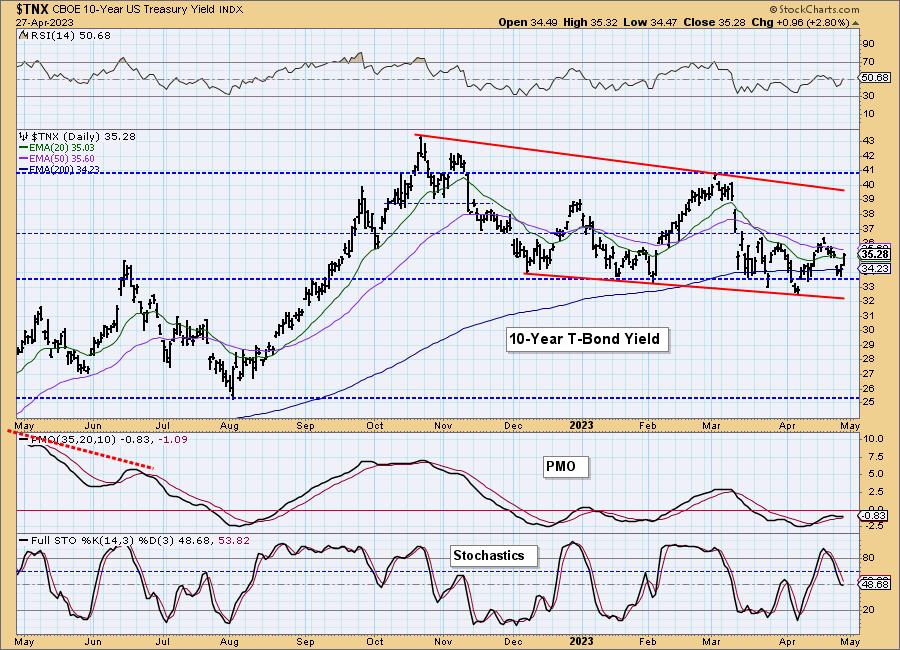
10-YEAR T-BOND YIELD
The 10-year yield has formed a messy reverse head and shoulders, but the pattern suggests a breakout above 3.7%. The RSI has returned to positive territory and the PMO surged above its signal line (bottom above the signal line). While we do believe rates will rise, a stoppage in the rally that started today could put a damper on yields as we would expect Bonds to find favor in a market decline.
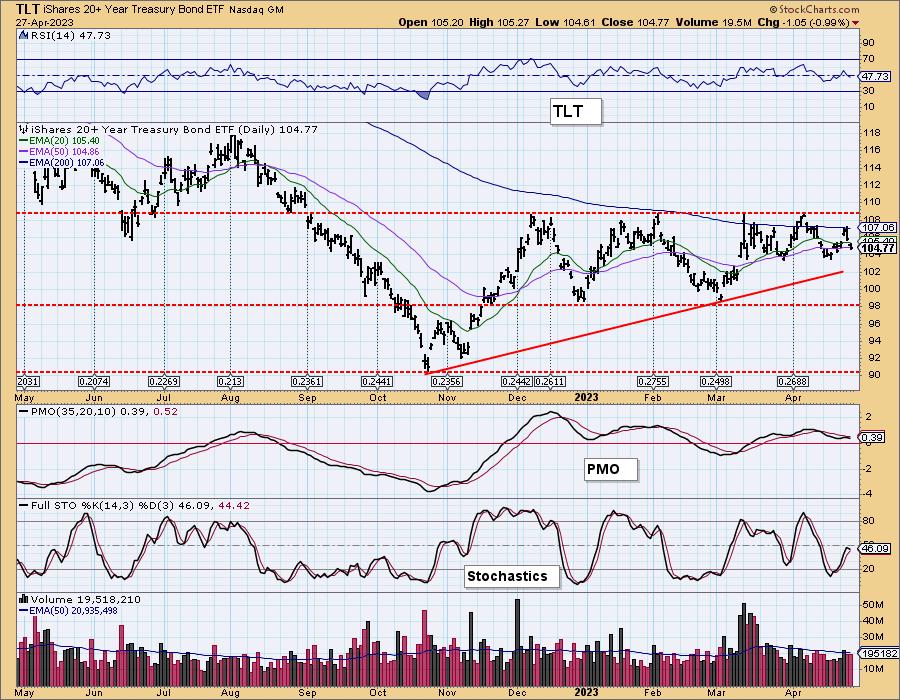
BONDS (TLT)
IT Trend Model: BUY as of 3/17/2023
LT Trend Model: SELL as of 1/19/2022
TLT Daily Chart: Today's rally didn't help out Bonds as most wanted to dump Bonds in anticipation of a longer lasting rally in the market. The trading range should provide support. We don't expect to see the longer-term rising trendline broken, particularly if the market resumes its decline. So while the RSI, PMO and Stochastics show some deterioration, we still expect Bonds to breakout.
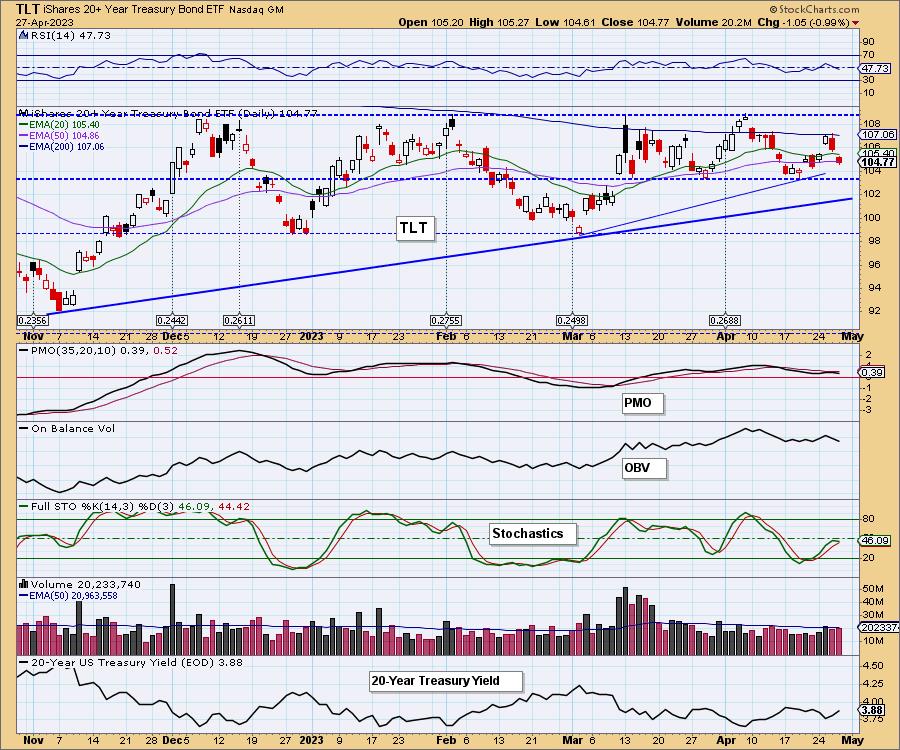
We expect TLT to breakout as it is traveling within a bullish ascending triangle (rising bottoms, flat top). The last two lows did not have to touch the bottom of the pattern. That usually signals a breakout ahead on the next test of resistance. Of course we now have a top that didn't reach the top of the range. As noted above, we expect the rising trend to remain intact and a breakout on the next test of resistance.
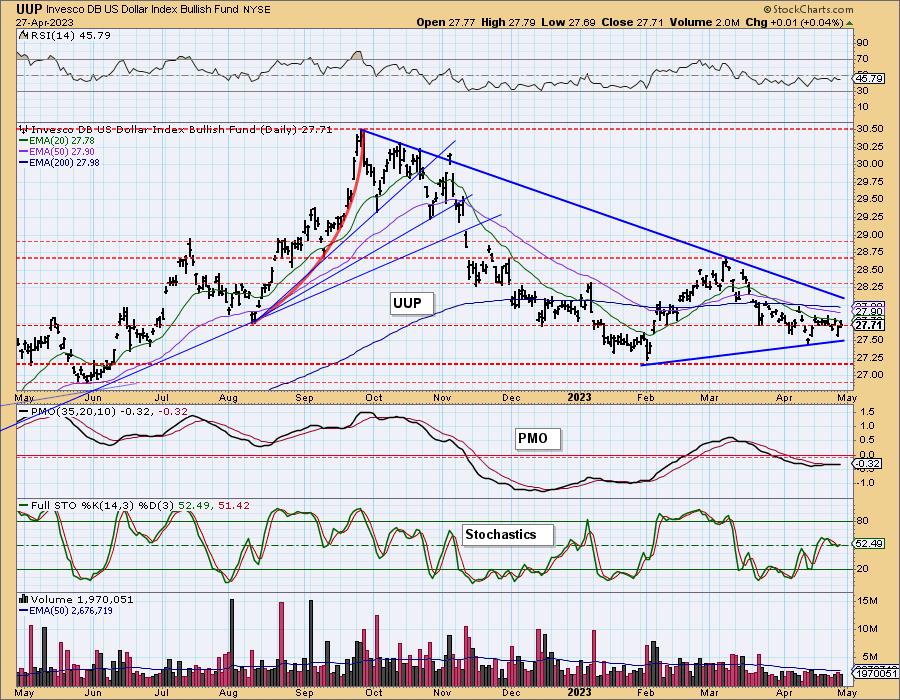
DOLLAR (UUP)
IT Trend Model: NEUTRAL as of 3/28/2023
LT Trend Model: SELL as of 4/12/2023
UUP Daily Chart: The Dollar nearly broke its declining trend, but instead printed a bearish filled black candlestick. Those candles are usually followed by a decline the next day, so more than likely we will have to wait another day or two before we see a breakout.
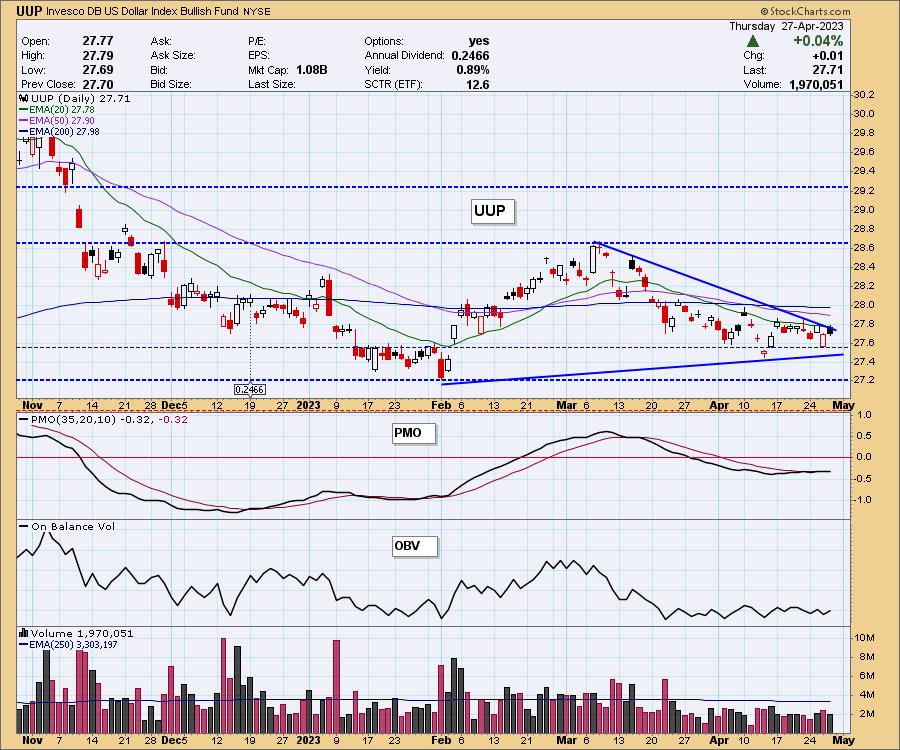
Why a breakout? The PMO is triggering a Crossover BUY Signal and Stochastics turned up in positive territory. We see UUP as bounded by that longer-term declining tops trendline. We expect that declining trend to hold up.
GOLD
IT Trend Model: BUY as of 3/7/2023
LT Trend Model: BUY as of 1/5/2023
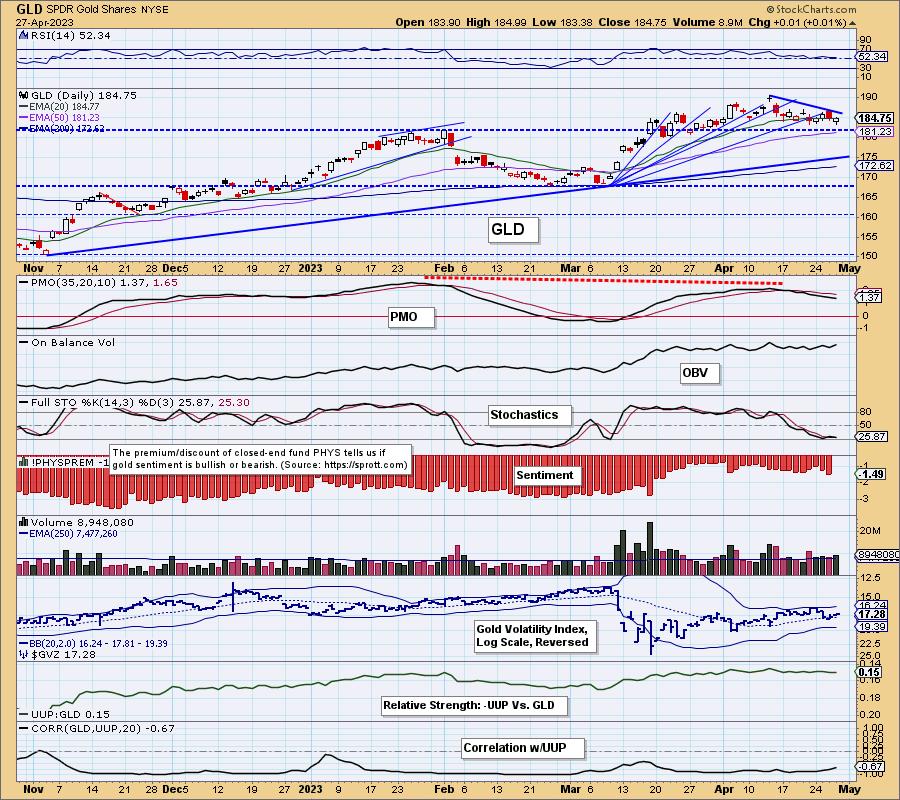
GLD Daily Chart: Gold continues to meander above support. It does have a rounded top and it is in short-term declining trend. Indicators are mixed. The RSI is positive, but the PMO is declining on a SELL signal and Stochastics have turned down in negative territory.
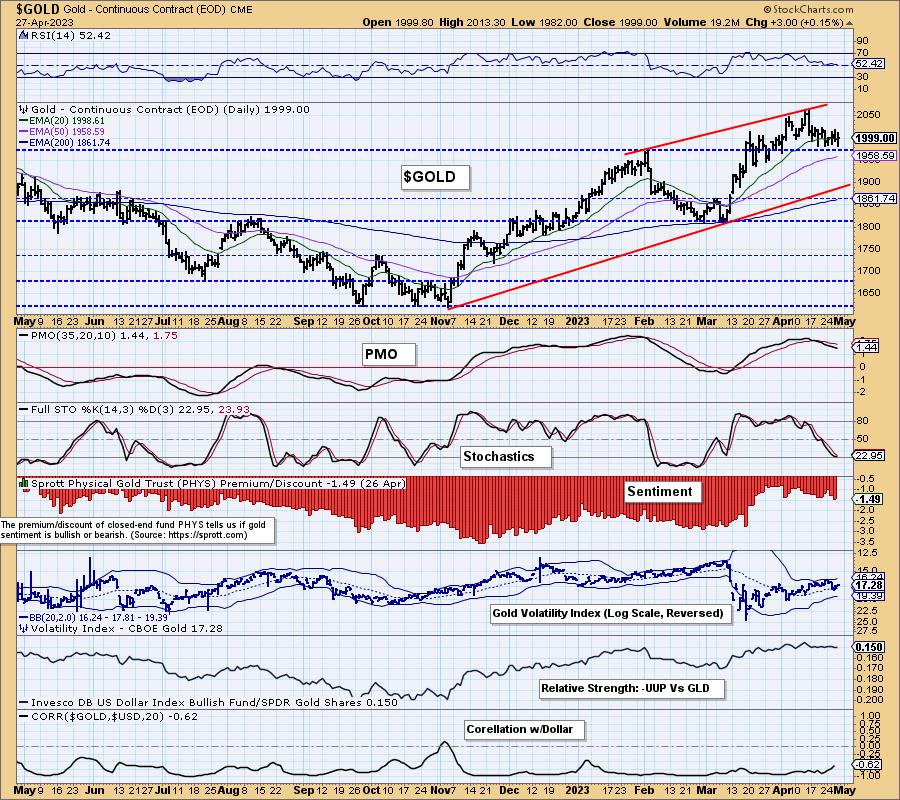
GOLD Daily Chart: The correlation line is suggesting that Gold is decoupling from the Dollar. The natural inverse relationship will still exist, Gold just may not be as tied to it as previously. This will allow both the Dollar and Gold to rise in unison. We don't see that just yet as the bearish bias is clear on the Gold chart right now.
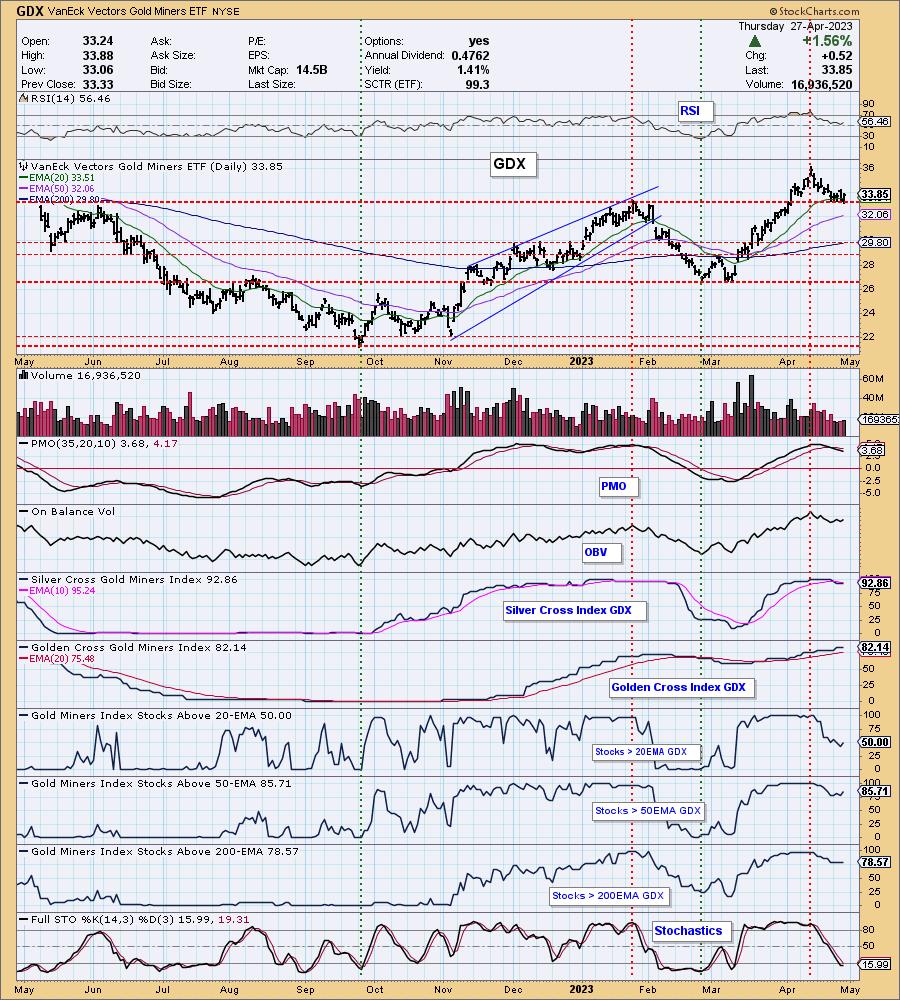
GOLD MINERS Golden and Silver Cross Indexes: With Gold and the market up today, Gold Miners took advantage with a nice rebound of support. However, we still don't favor entry right now. Notice that participation is still in a declining trend and the Silver Cross Index is still on a 'Bear Shift' below its signal line. They are getting interesting right here and if the market can reverse course, this will be an excellent area to invest. Right now the risk seems to high.
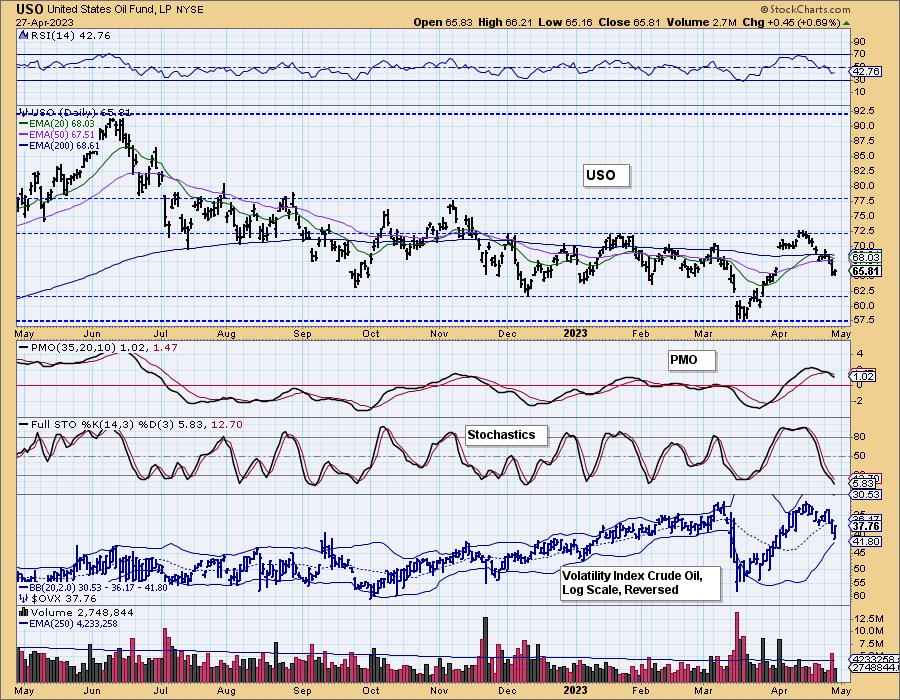
CRUDE OIL (USO)
IT Trend Model: BUY as of 4/10/2023
LT Trend Model: SELL as of 12/6/2022
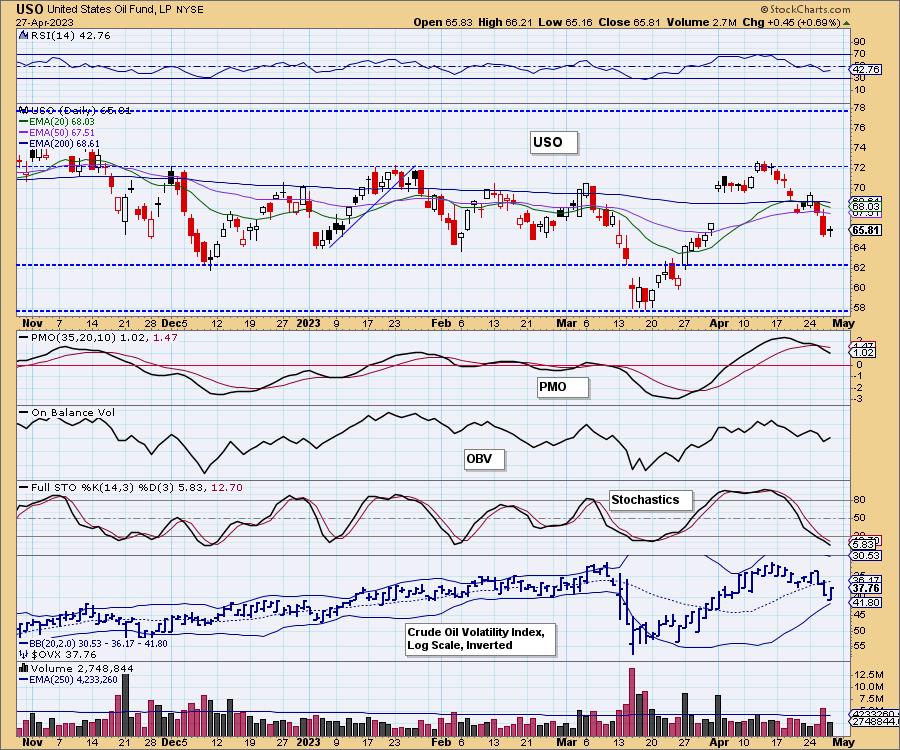
USO Daily Chart: Crude Oil saw a small snapback after two days of dastardly decline. Indicators are still very negative so we expect the decline to continue down to the bottom of the trading range at 62.00 at the very least. The RSI is negative, the PMO is on an overbought Crossover SELL Signal and Stochastics are falling below 20. Oil has further downside ahead.
Good Luck & Good Trading!
Erin Swenlin and Carl Swenlin
Technical Analysis is a windsock, not a crystal ball. --Carl Swenlin
(c) Copyright 2023 DecisionPoint.com
Disclaimer: This blog is for educational purposes only and should not be construed as financial advice. The ideas and strategies should never be used without first assessing your own personal and financial situation, or without consulting a financial professional. Any opinions expressed herein are solely those of the author, and do not in any way represent the views or opinions of any other person or entity.
NOTE: The signal status reported herein is based upon mechanical trading model signals, specifically, the DecisionPoint Trend Model. They define the implied bias of the price index based upon moving average relationships, but they do not necessarily call for a specific action. They are information flags that should prompt chart review. Further, they do not call for continuous buying or selling during the life of the signal. For example, a BUY signal will probably (but not necessarily) return the best results if action is taken soon after the signal is generated. Additional opportunities for buying may be found as price zigzags higher, but the trader must look for optimum entry points. Conversely, exit points to preserve gains (or minimize losses) may be evident before the model mechanically closes the signal.
Helpful DecisionPoint Links:
DecisionPoint Alert Chart List
DecisionPoint Golden Cross/Silver Cross Index Chart List
DecisionPoint Sector Chart List
Price Momentum Oscillator (PMO)
Swenlin Trading Oscillators (STO-B and STO-V)
DecisionPoint is not a registered investment advisor. Investment and trading decisions are solely your responsibility. DecisionPoint newsletters, blogs or website materials should NOT be interpreted as a recommendation or solicitation to buy or sell any security or to take any specific action.