
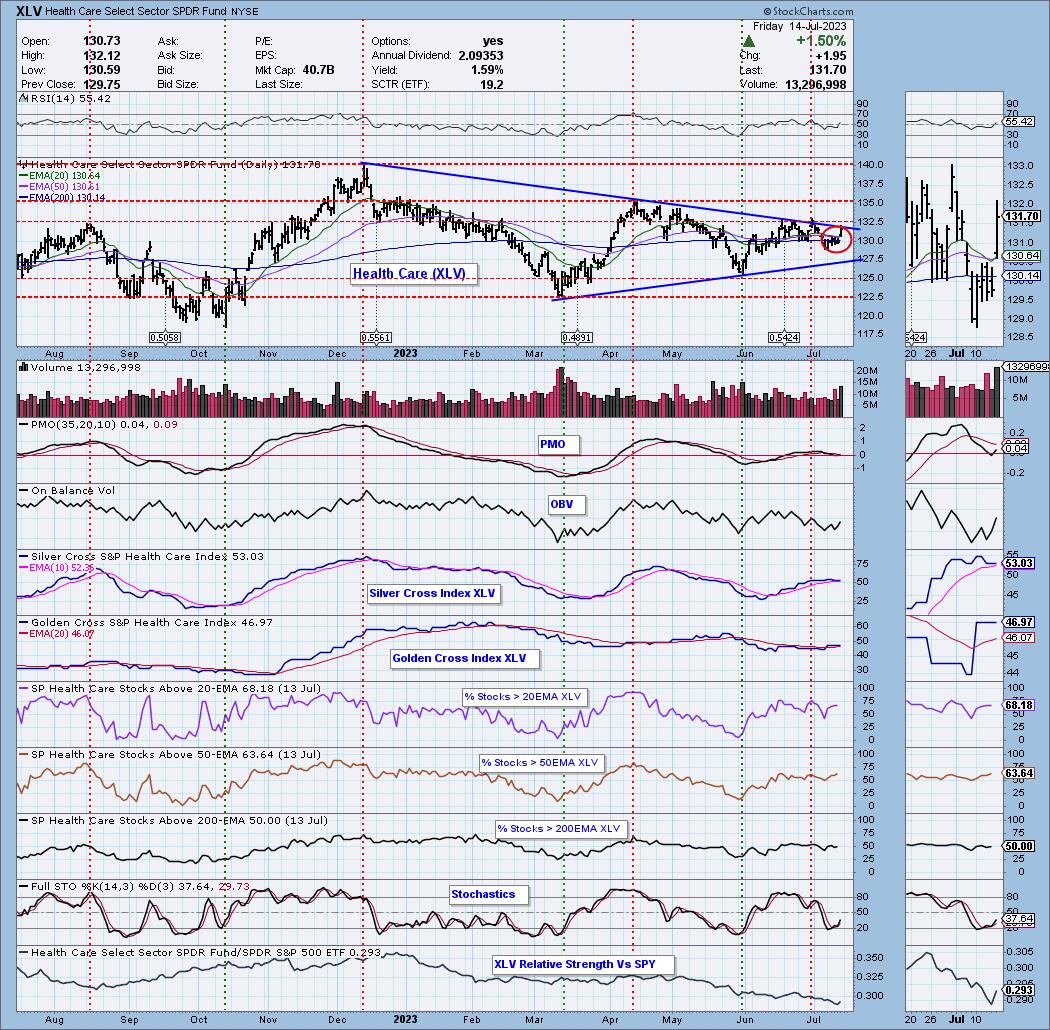
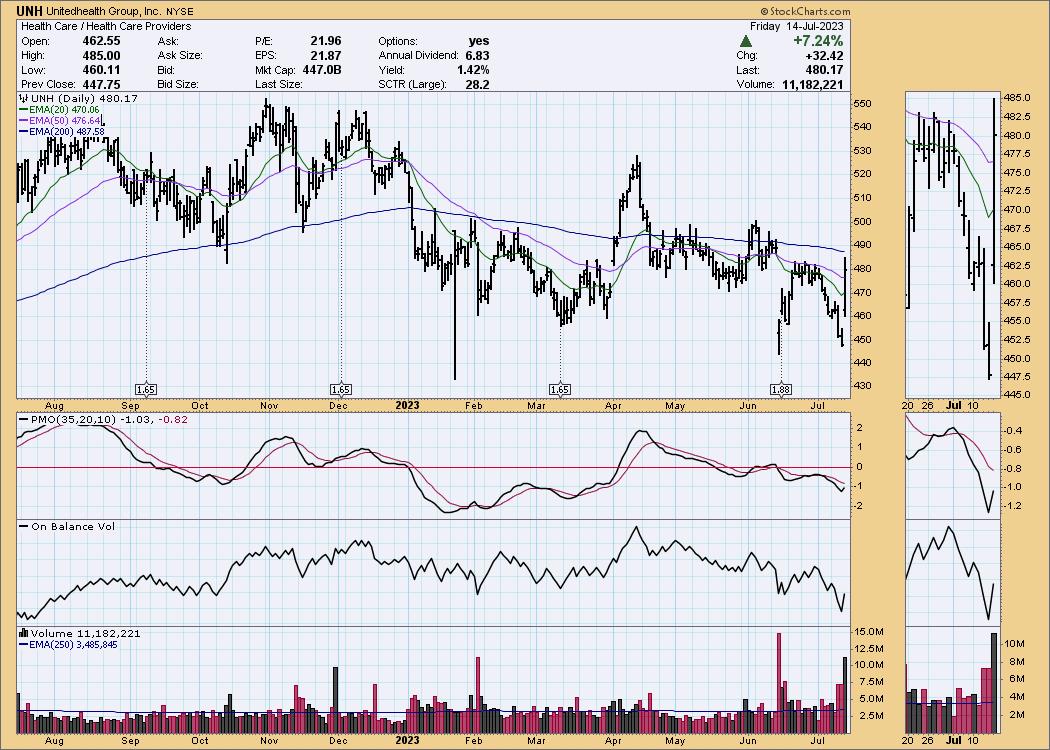
The Health Care Sector went on an IT Trend Model NEUTRAL Signal as the 20-day EMA crossed down through the 50-day EMA (Dark Cross). Today United Healthcare (UNH), a giant in the sector, rallied 7.24% on earnings news, reversing yesterday's downside cross with a 20/50EMA crossover to the upside (Silver Cross), generating a new IT Trend Model BUY Signal. The spread on the EMAs is very close, so there is a potential for another reversal next week.
The DecisionPoint Alert Weekly Wrap presents an end-of-week assessment of the trend and condition of the Stock Market, the U.S. Dollar, Gold, Crude Oil, and Bonds. The DecisionPoint Alert daily report (Monday through Thursday) is abbreviated and gives updates on the Weekly Wrap assessments.
Watch the latest episode of DecisionPoint on StockCharts TV's YouTube channel here!
MAJOR MARKET INDEXES
For Today: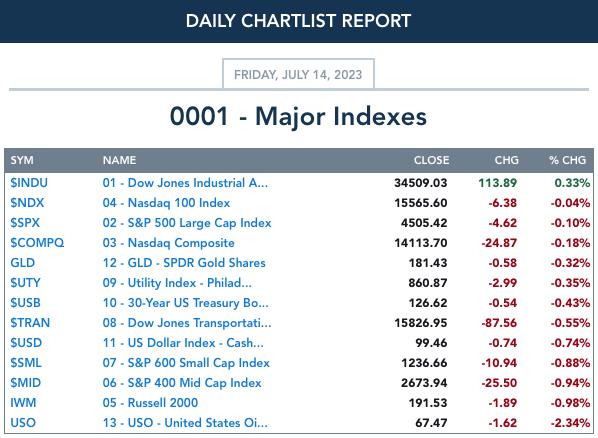
For the Week: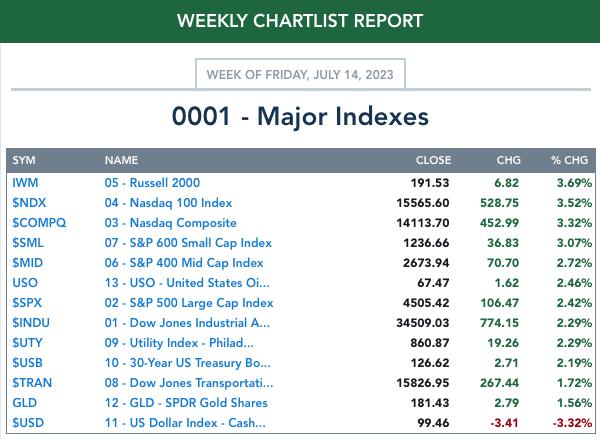
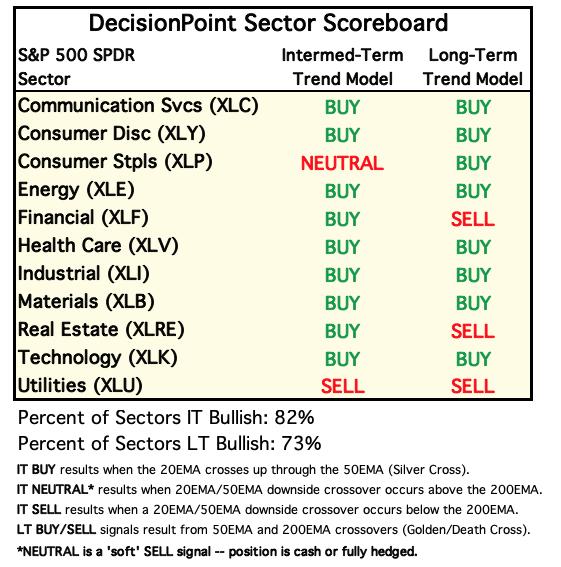
SECTORS
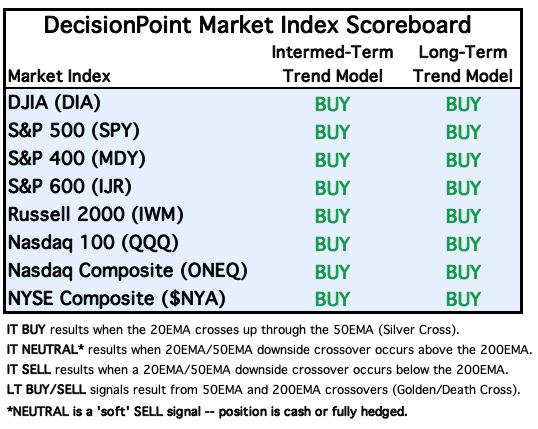
Each S&P 500 Index component stock is assigned to one of 11 major sectors. This is a snapshot of the Intermediate-Term (Silver Cross) and Long-Term (Golden Cross) Trend Model signal status for those sectors.
For Today: 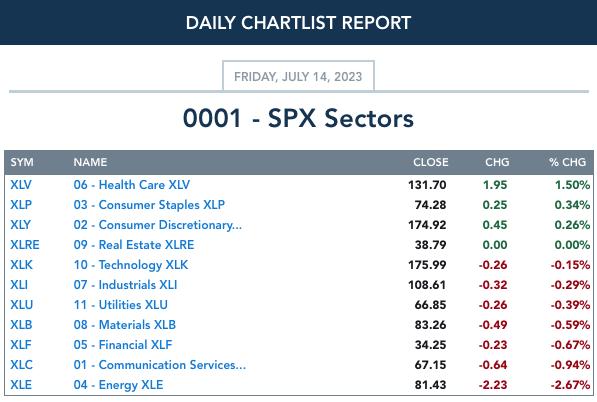
For the Week: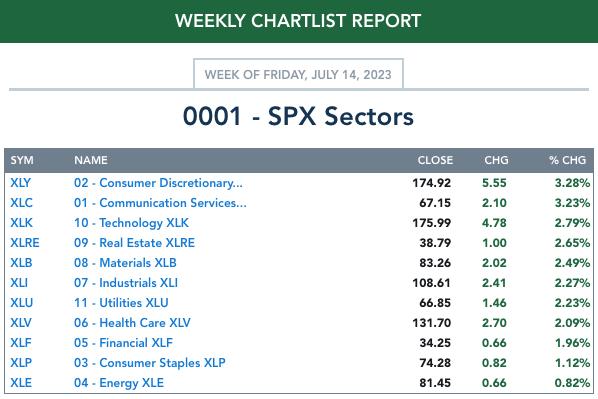
CLICK HERE for Carl's annotated Market Index, Sector, and Industry Group charts.
THE MARKET (S&P 500)
IT Trend Model: BUY as of 3/30/2023
LT Trend Model: BUY as of 3/29/2023
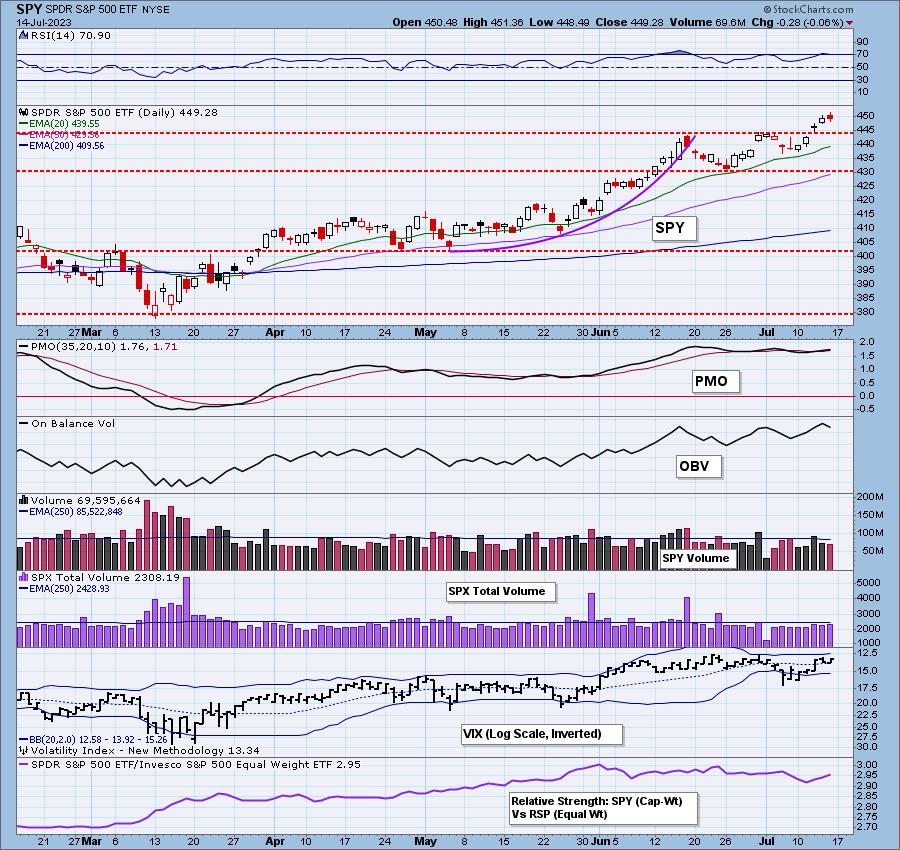
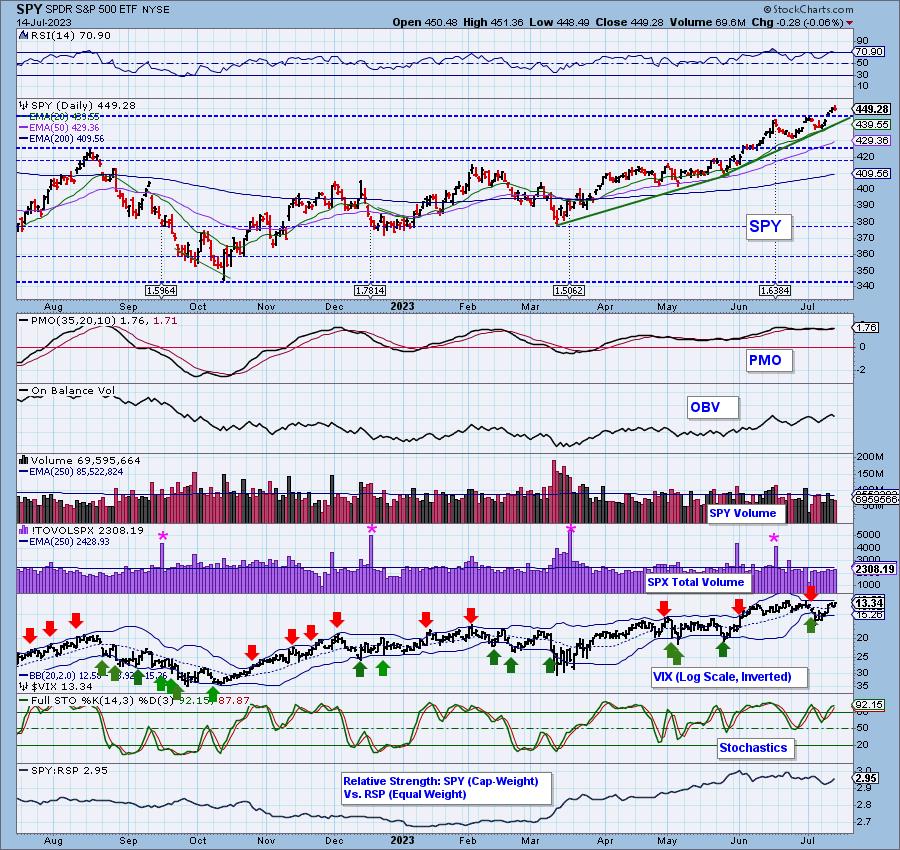
SPY Daily Chart: All major indexes were marginally down today, except the Dow, which was buoyed by UNC.

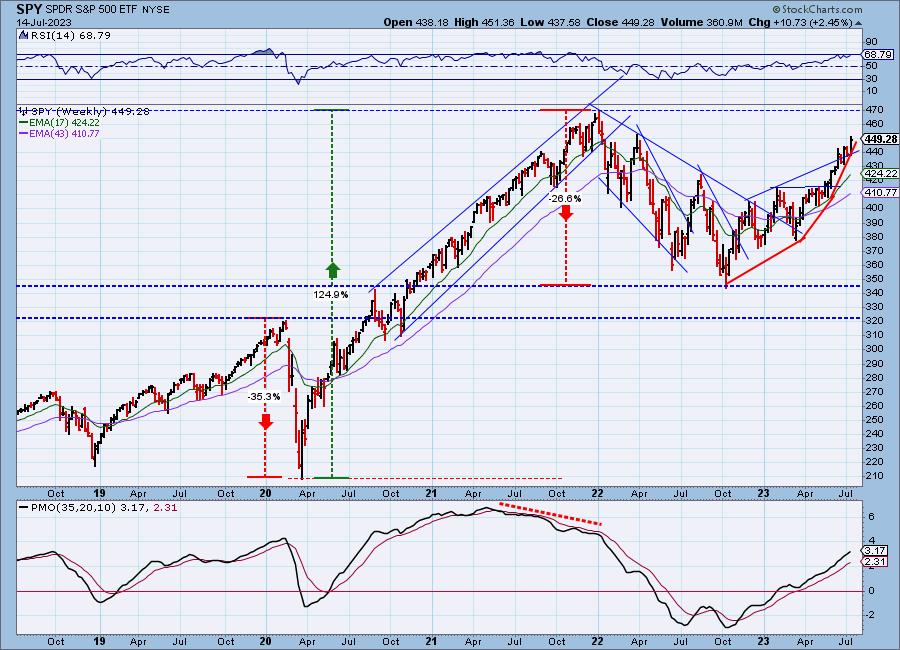
SPY Weekly Chart: The price advance in this time frame is beginning to go parabolic, which has longer-term implications -- that a pullback will be more serious.
New 52-Week Highs/Lows: SPY made new intraday highs, but New Highs contracted again. This is bearish for the short-term.
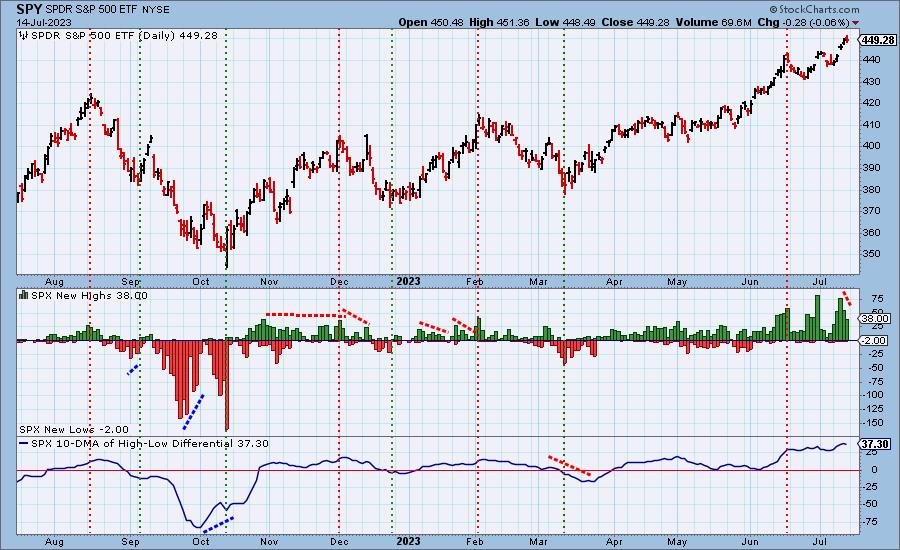
Climax Analysis: There was only one climax reading on the four relevant indicators today, and we think that the juice from Tuesday's upside initiation climax has about run out.
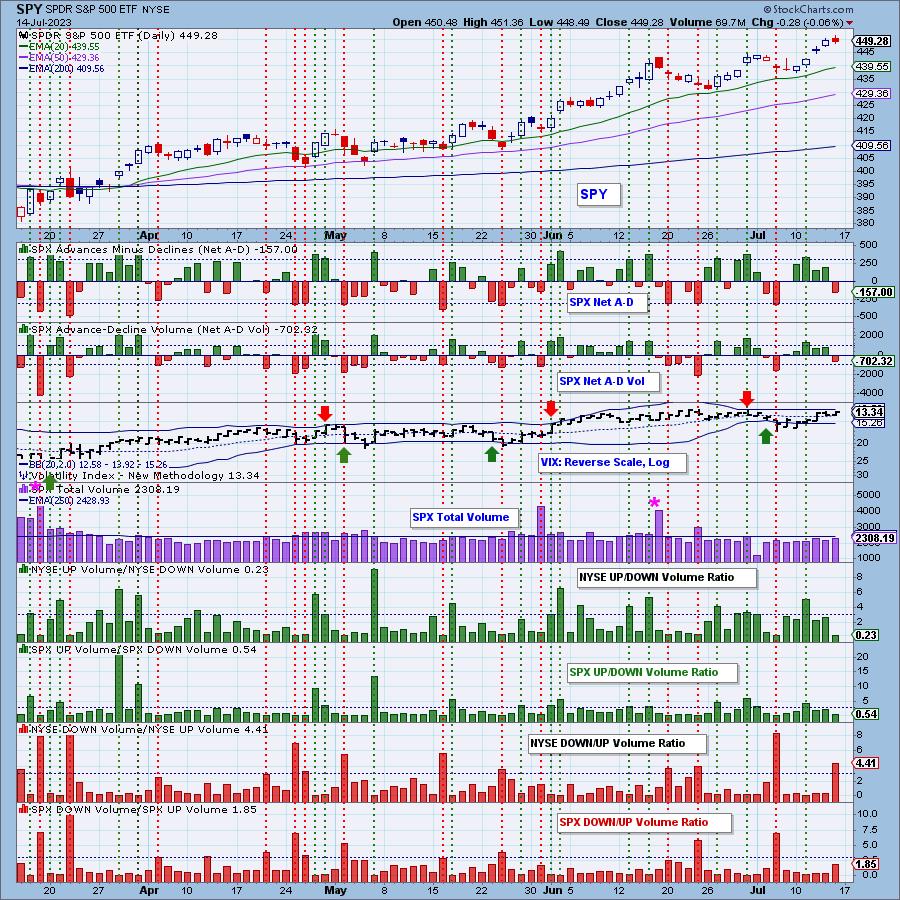
*A climax is a one-day event when market action generates very high readings in, primarily, breadth and volume indicators. We also include the VIX, watching for it to penetrate outside the Bollinger Band envelope. The vertical dotted lines mark climax days -- red for downside climaxes, and green for upside. Climaxes are at their core exhaustion events; however, at price pivots they may be initiating a change of trend.
Short-Term Market Indicators: The short-term market trend is UP and the condition is OVERBOUGHT.
The Percent PMOs Rising and the Percent Stocks Above 20EMA both topped today.
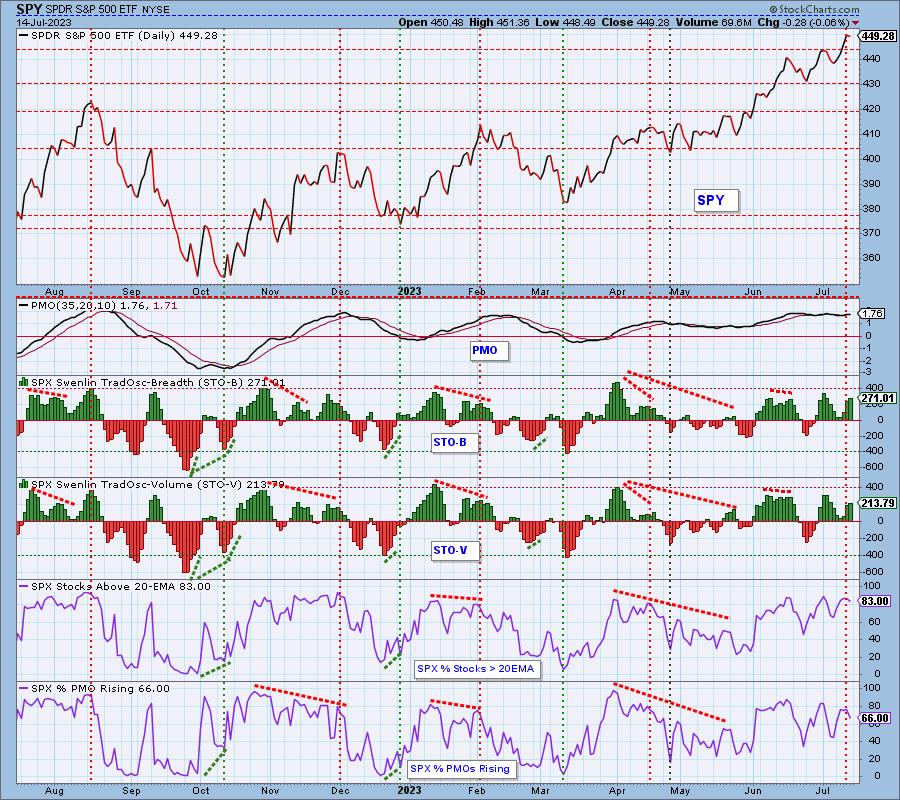
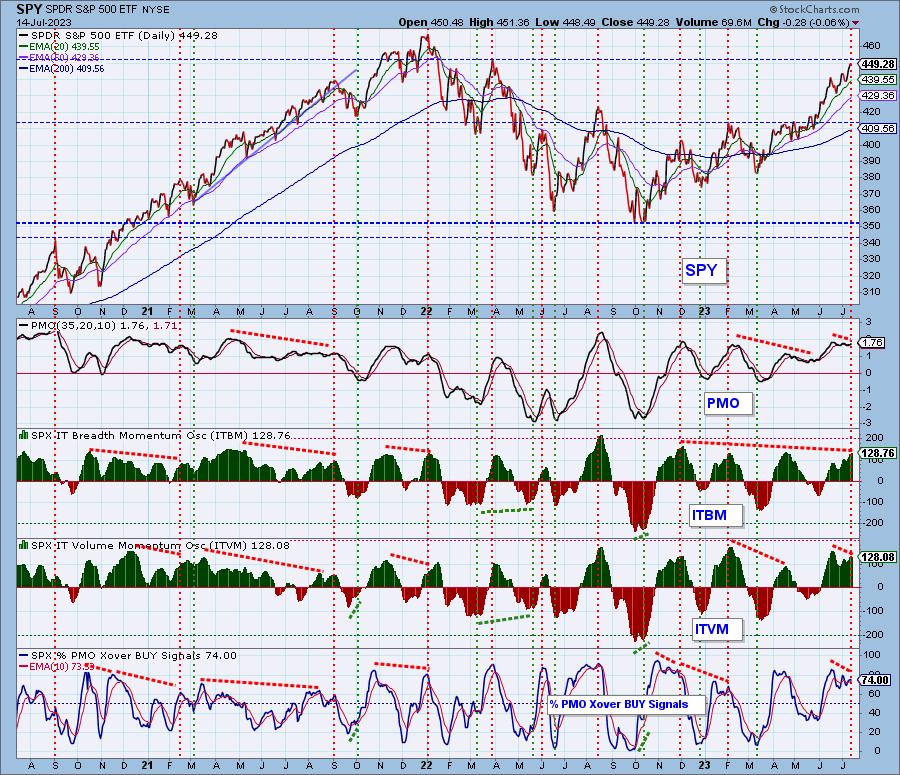
Intermediate-Term Market Indicators: The intermediate-term market trend is UP and the condition is OVERBOUGHT.
There are persistent negative divergences on the ITBM, ITVM, and Percent PMO Crossover BUY Signals charts.
_______
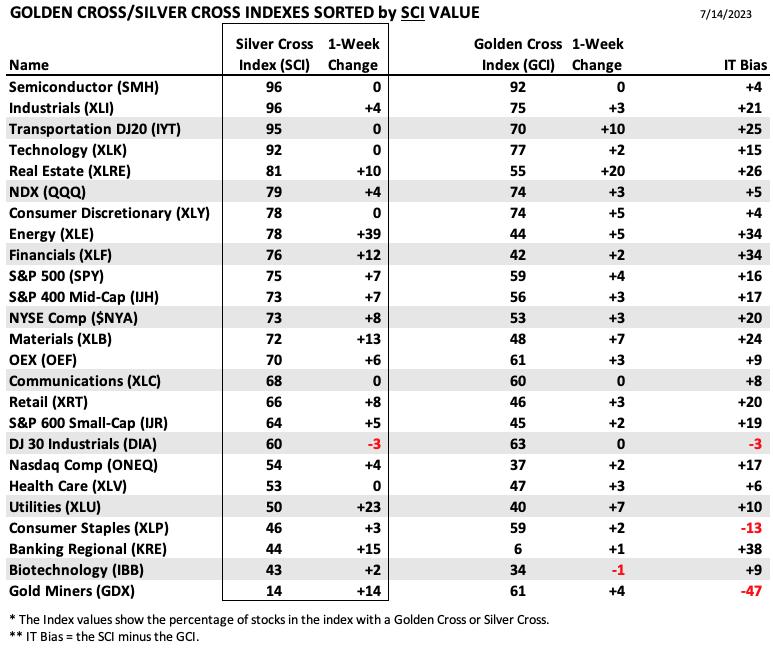
PARTICIPATION and BIAS Assessment: The following table objectively shows the depth and trend of participation in two time frames.
- Intermediate-Term - the Silver Cross Index (SCI) shows the percentage of SPX stocks on IT Trend Model BUY signals (20-EMA > 50-EMA). The opposite of the Silver Cross is a "Dark Cross" -- those stocks are, at the very least, in a correction.
- Long-Term - the Golden Cross Index (GCI) shows the percentage of SPX stocks on LT Trend Model BUY signals (50-EMA > 200-EMA). The opposite of a Golden Cross is the "Death Cross" -- those stocks are in a bear market.
The following table summarizes participation for the major market indexes and sectors. The 1-Week Change columns inject a dynamic aspect to the presentation. There are three groups: Major Market Indexes, Miscellaneous Sectors, and the eleven S&P 500 Sectors.
The majority have shown SCI and GCI improvement this week, and IT Bias numbers are strongly positive.
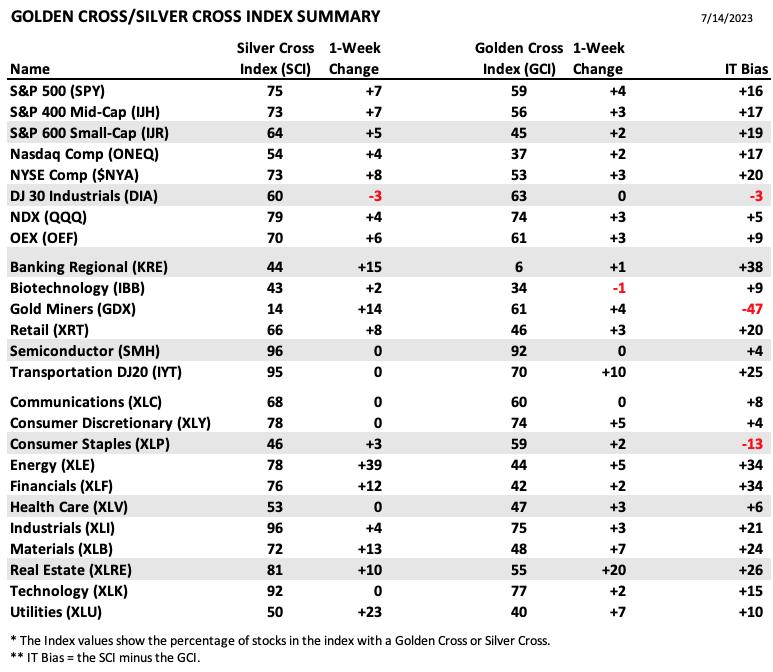
This table is sorted by SCI values. This gives a clear picture of strongest to weakest index/sector in terms of intermediate-term participation.
There are a number of top ranked indexes that showed no SCI improvement this week. XLE and KRE showed the best improvement.
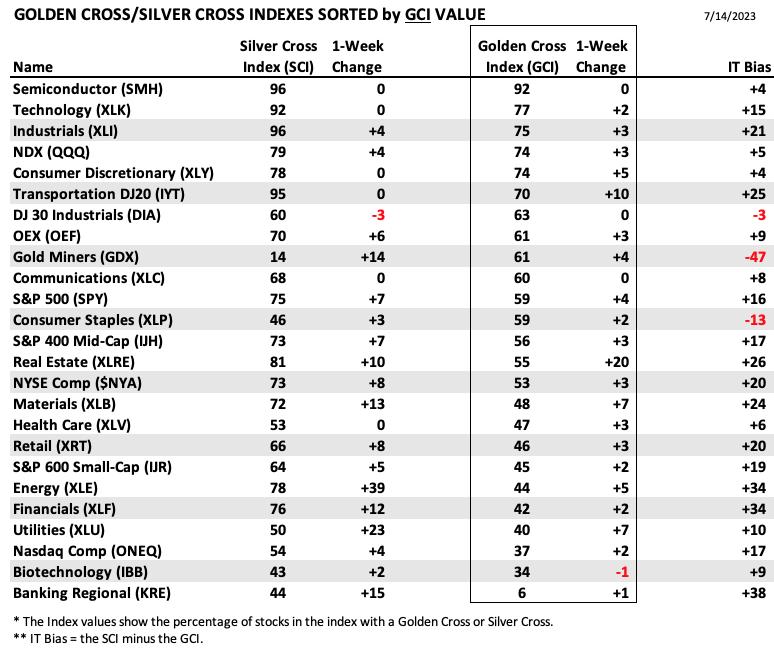
This table is sorted by GCI values. This gives a clear picture of strongest to weakest index/sector in terms of long-term participation.
GCIs move more slowly, and only XLRE and IYT showed remarkable improvement.
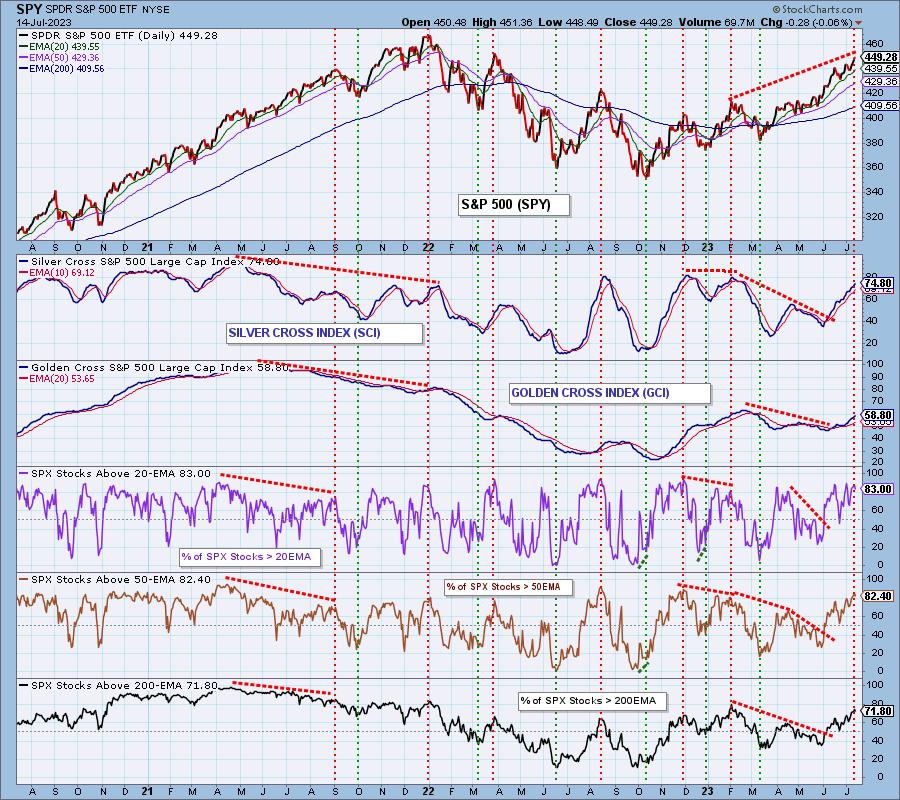
The following chart objectively shows the depth and trend of participation in three time frames.
The overall market bias is BULLISH.
The short-term bias is BULLISH.
The intermediate-term bias is BULLISH.
The long-term bias is BULLISH.
Participation as measured by the Stocks Above Their 20/50/200EMAs is robust, but those readings are also overbought. The Golden Cross and Silver Cross Indexes are slightly lower than they were at the December and February price tops, and conditions are generally overbought.
CONCLUSION: The market is overbought, and there are still three and a half months left in the current period of unfavorable seasonality. The Magnificent Seven tech stocks that led this rally are due to take a breather. We are looking for some kind of corrective action. Nevertheless, we are in a bull market, and internals can correct without seeing corresponding price corrections. It can be better to use stops than to hedge/sell in anticipation of a decline.
Erin is 50% long, 0% short.
Calendar: Next week is options expiration. Since it is not an end-of-quarter event, we'll expect normal volume on Friday and low volatility Thursday and Friday.
Have you subscribed the DecisionPoint Diamonds yet? DP does the work for you by providing handpicked stocks/ETFs from exclusive DP scans! Add it with a discount! Contact support@decisionpoint.com for more information!
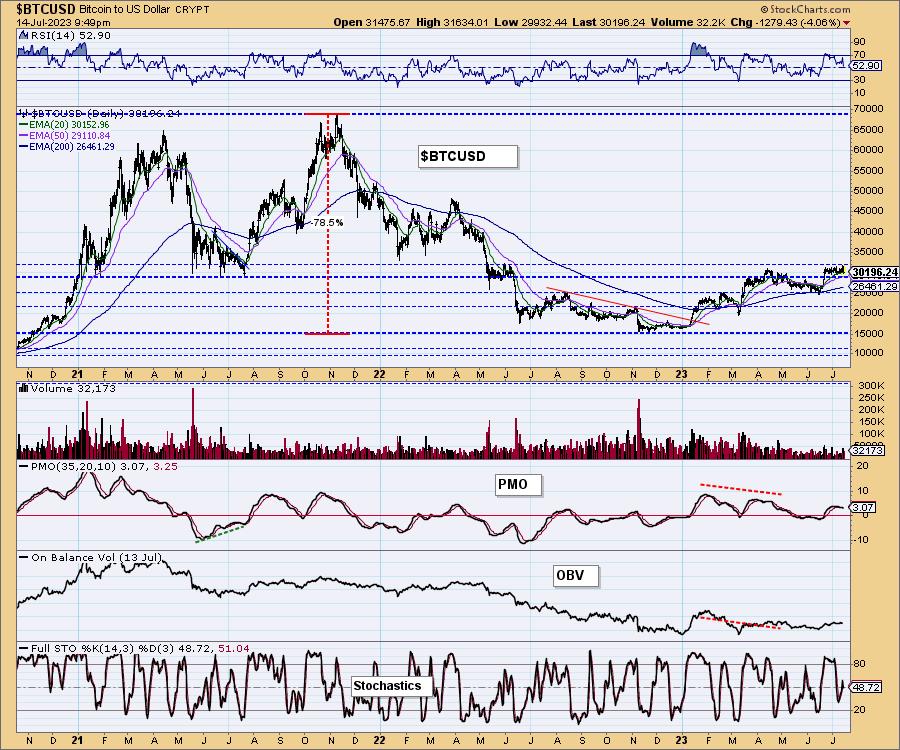
BITCOIN
The rounded top failed to deliver a decline. This is because there were various news items, like Blackrock's Larry Fink trying to start a Bitcoin ETF, that injected new life into Bitcoin trading.
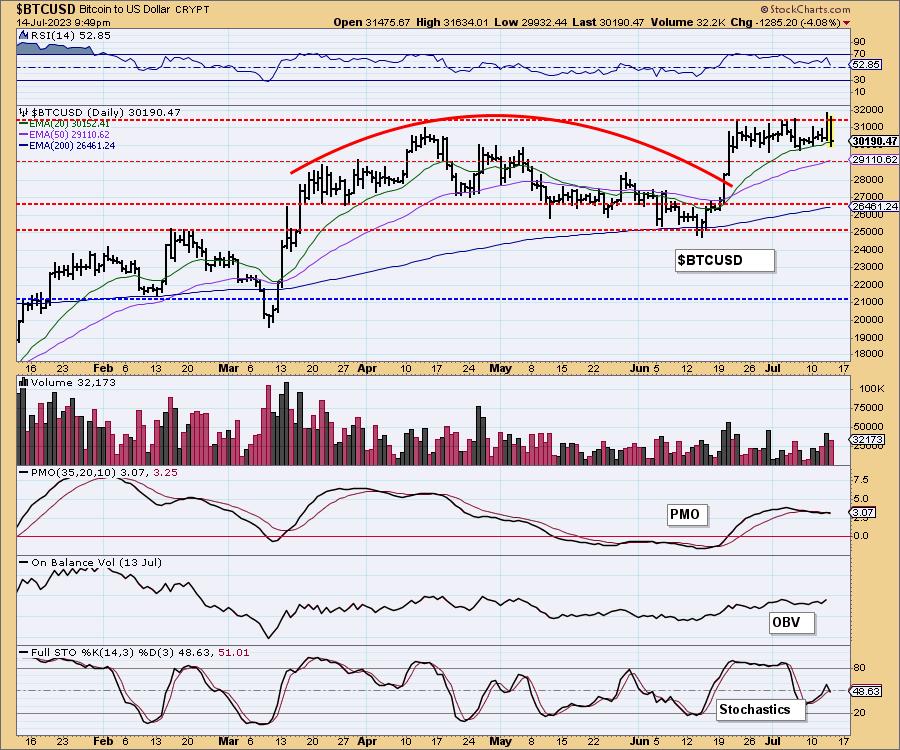
This chart is to show where some of the support/resistance lines come from.
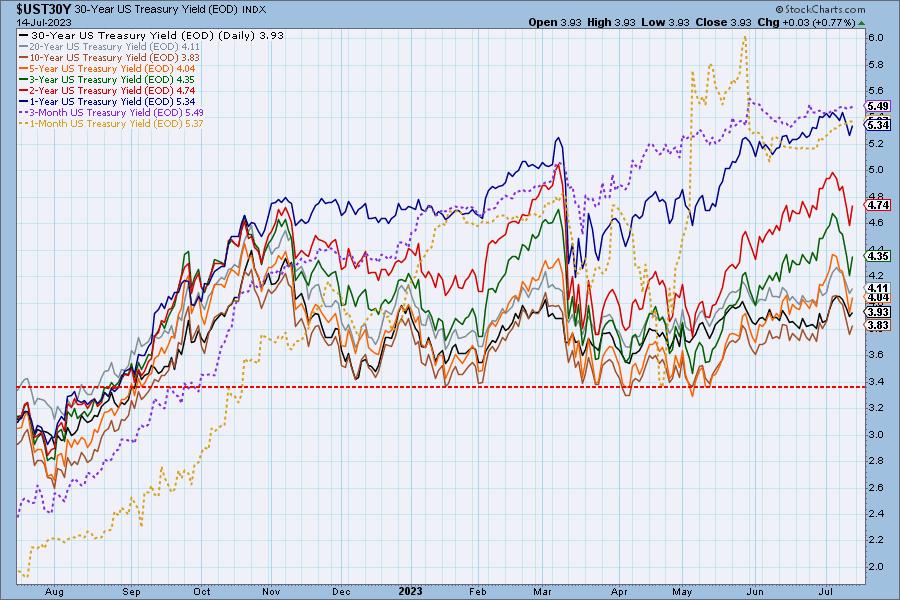
INTEREST RATES
Rates are in an 11-month range with pretty solid support at about 3.4%, and about 5.0% at the top, mostly for longer durations. Rates are inverted, and are trending down in the short term, and sideways in the intermediate-term.
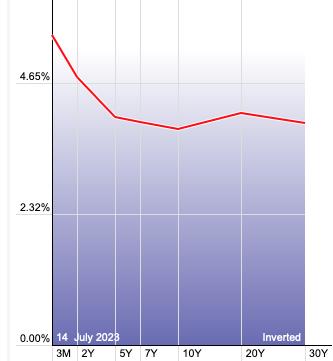
The Yield Curve Chart from StockCharts.com shows us the inversions taking place. The red line should move higher from left to right. Inversions are occurring where it moves downward.
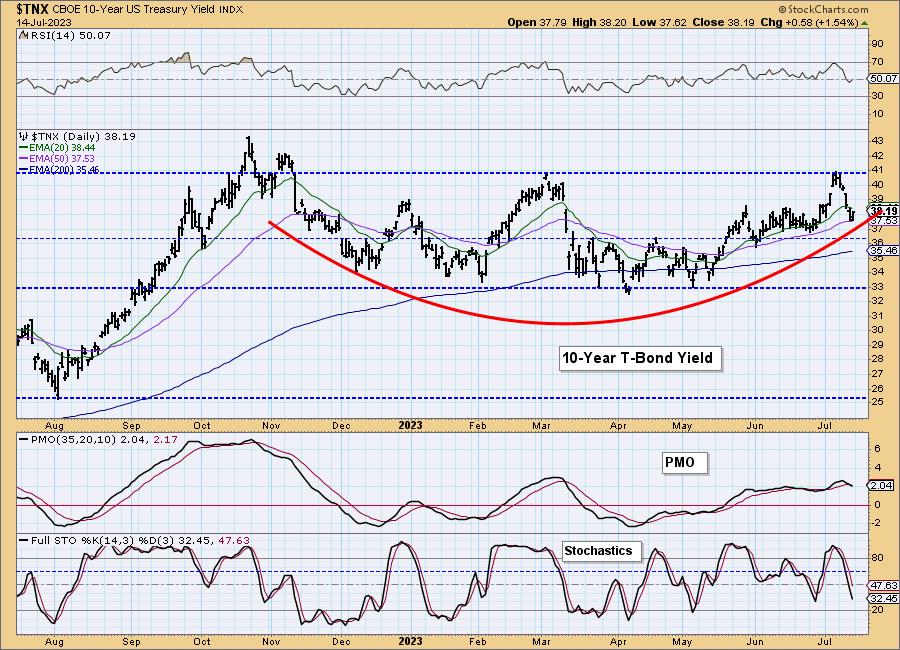
10-YEAR T-BOND YIELD
The 10-year T-Bond yield is in a trading range, but we think we can make a case for a sauced bottom, which implies higher rates in the future. With the yield currently in decline, let's see if the saucer breaks.
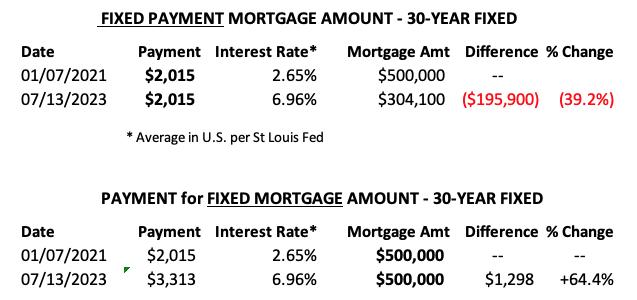
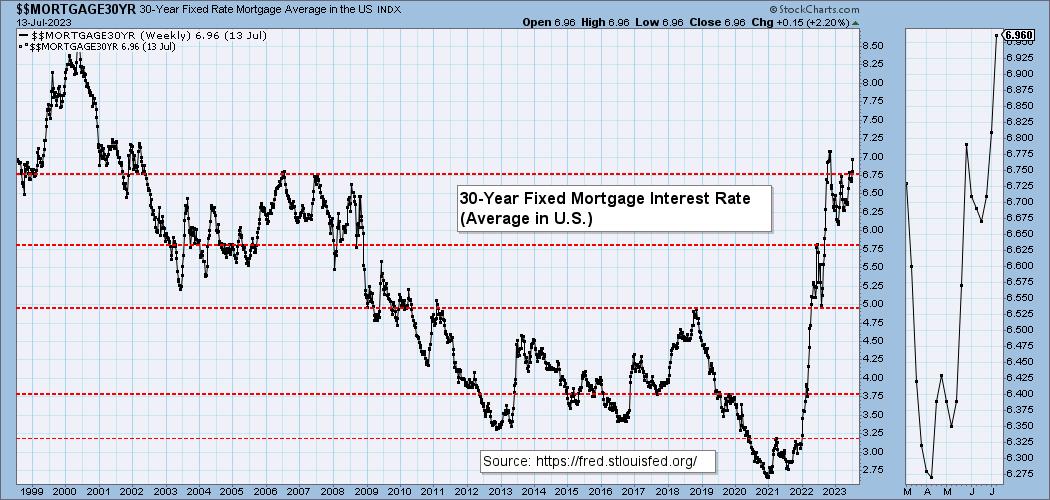
MORTGAGE INTEREST RATES (30-Yr)**
**We watch the 30-Year Fixed Mortgage Interest Rate, because, for the most part, people buy homes based upon the maximum monthly payment they can afford. As rates rise, a fixed monthly payment will carry a smaller mortgage amount. As buying power has been shrinking, home prices have come under pressure.
--
This week the 30-Year Fixed Rate changed from 6.71 to 6.81.
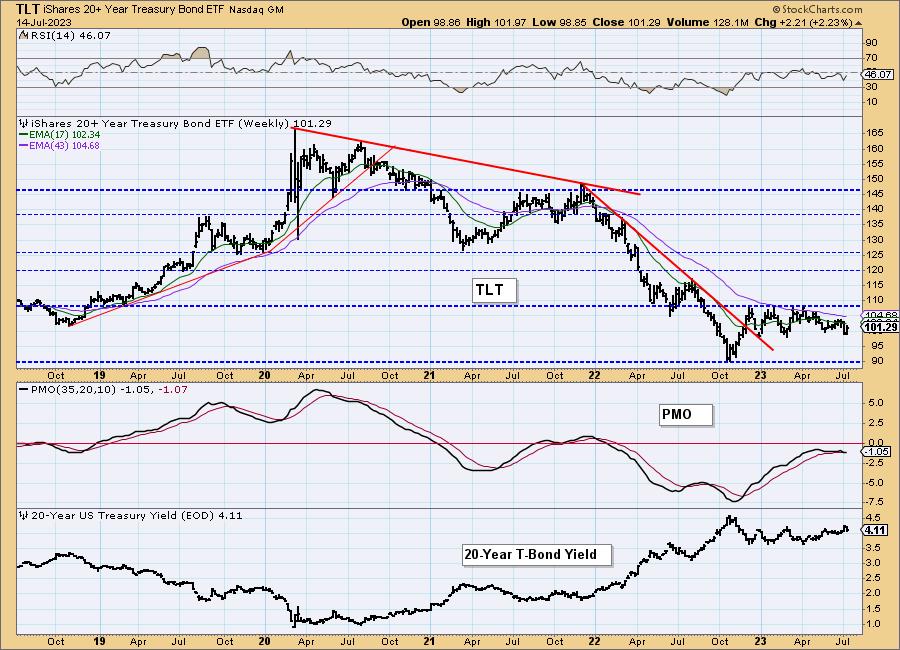
BONDS (TLT)
IT Trend Model: SELL as of 5/16/2023
LT Trend Model: SELL as of 1/19/2022
TLT Daily Chart: On the 6-month chart TLT appears to be in a trading range.
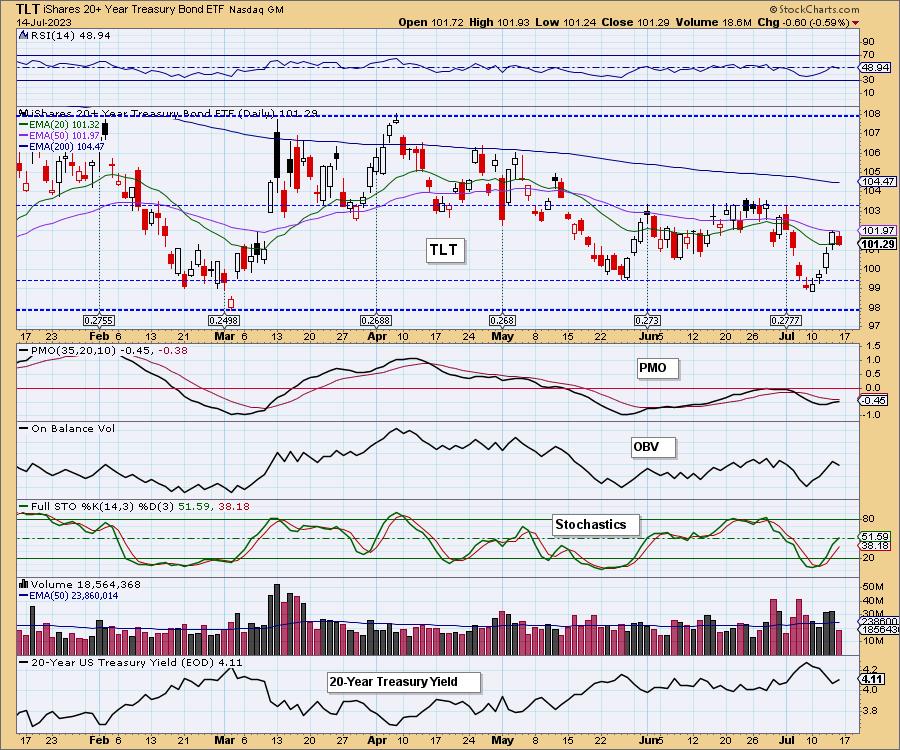
The one-year chart confirms the trading range, but also shows a bounce off a one-year low.
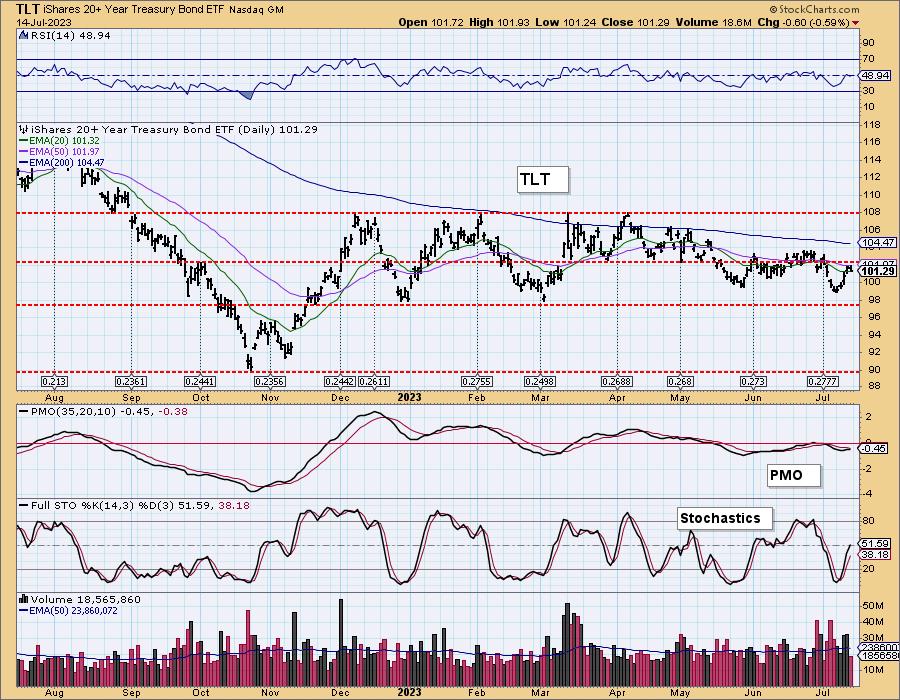
TLT Weekly Chart: Zooming back to a 5-year chart we can see that TLT is in a long-term declining trend.
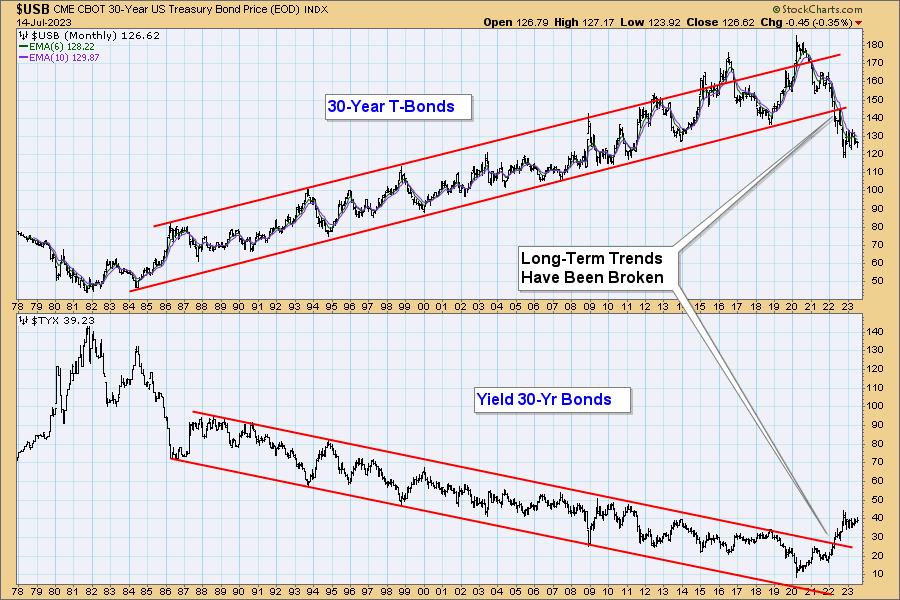
This 45-year chart of the 30-Year T-Bond shows that bonds have broken down through a long-term rising trend line. We can only assume that bonds will trend downward (and yields trend upward) for years to come. There will, of course be rallies, but keep in mind that the trend is down. Note that the high in 2020 was at the beginning of COVID, and the crash in bond prices, we think, reflects the deluge of irresponsible government spending that took place since that high.
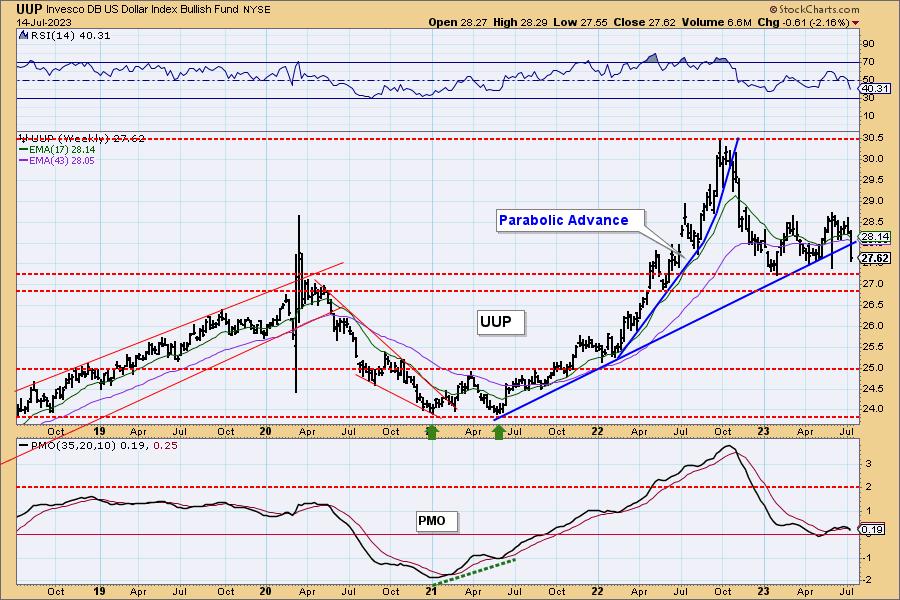
DOLLAR (UUP)
IT Trend Model: NEUTRAL as of 7/13/2023
LT Trend Model: BUY as of 5/25/2023
UUP Daily Chart: The trading range is obvious, but we wonder if support will be found at current levels or at the February low.
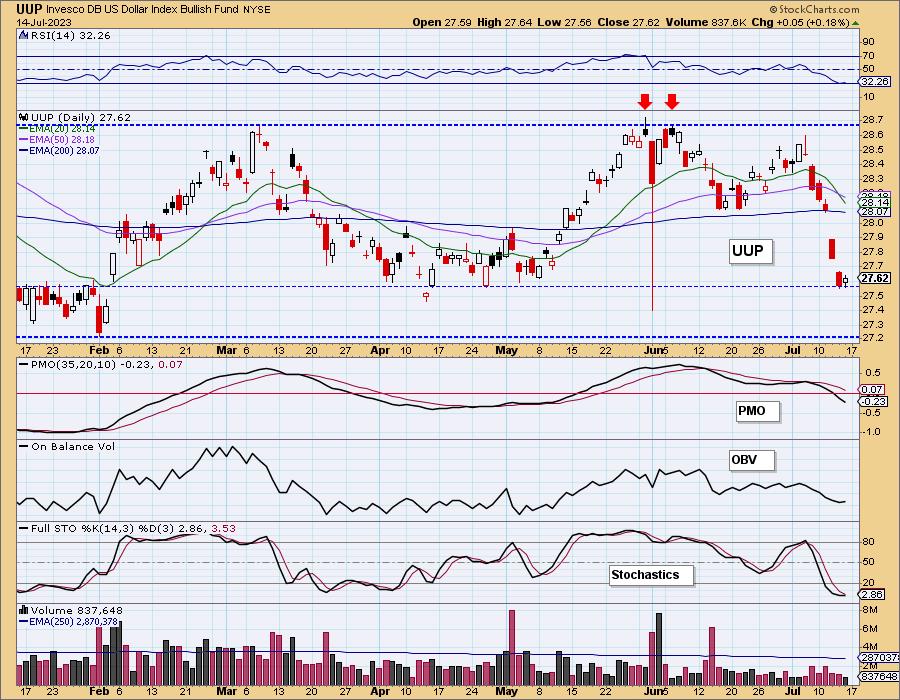
Zooming out, we can see a rising wedge formation, but we wonder if the horizontal support isn't the more relevant issue.
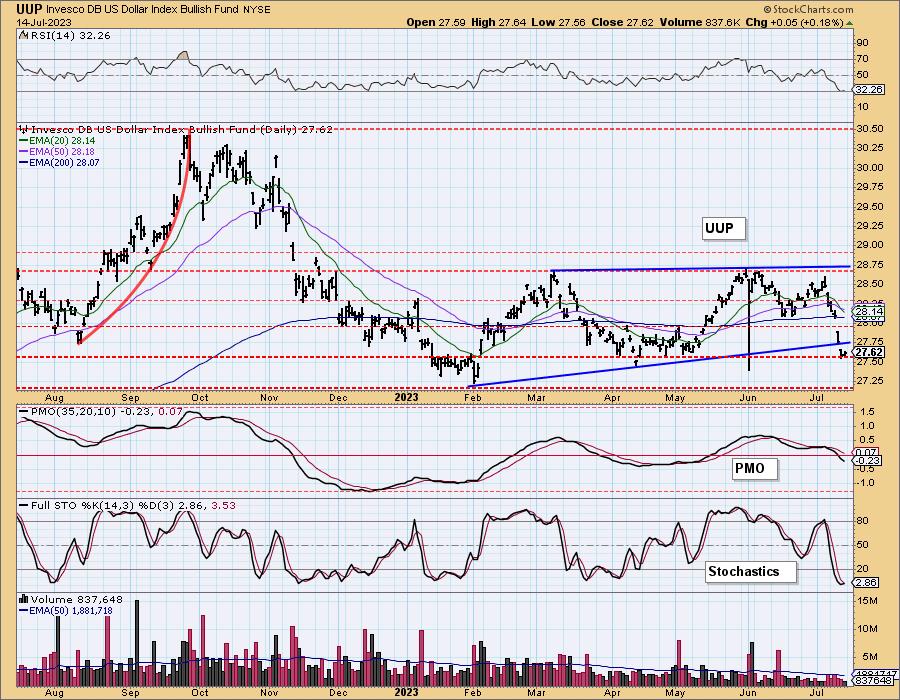
UUP Weekly Chart: As often happens, the weekly chart give a more useful perspective. The rising trend line has been violated, and the February support seems to be the most relevant. The weekly PMO is on a SELL Signal.
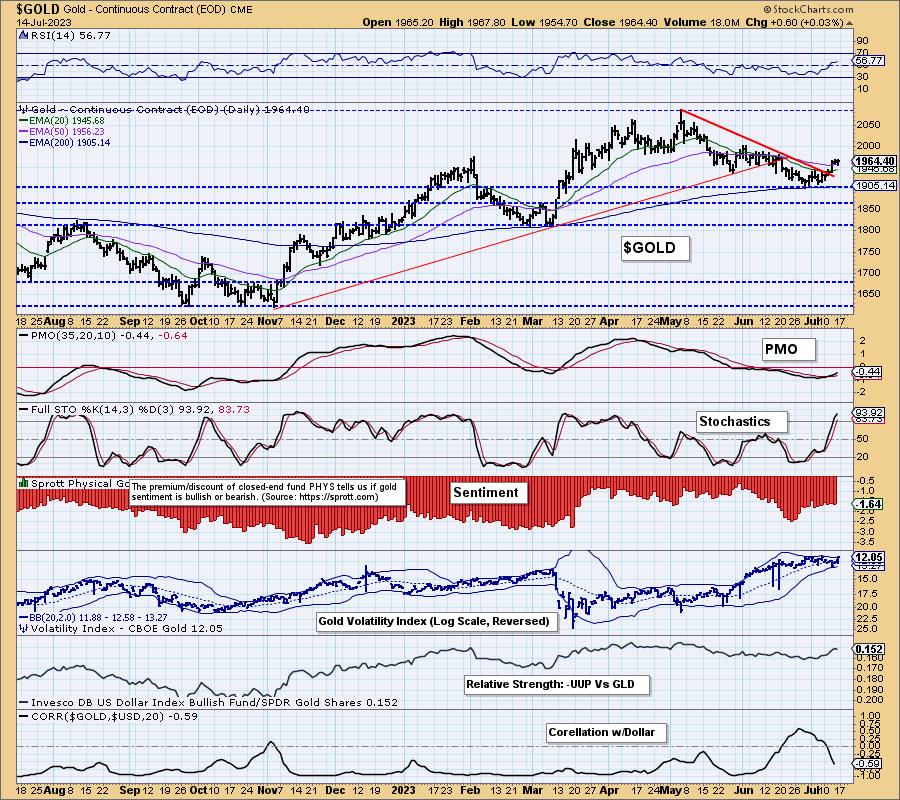
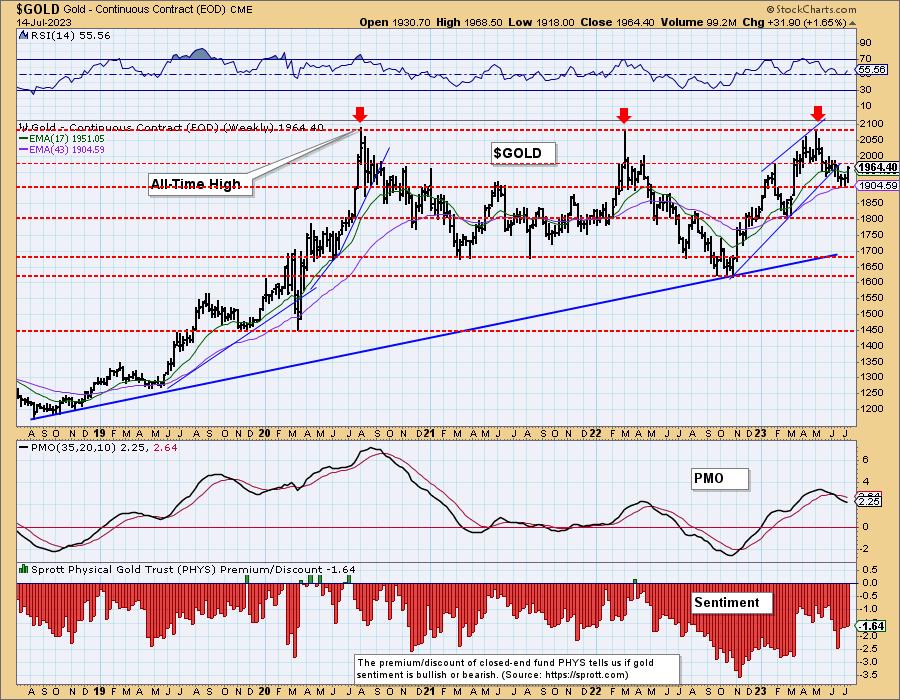
GOLD
IT Trend Model: NEUTRAL as of 6/8/2023
LT Trend Model: BUY as of 1/5/2023
GOLD Daily Chart: The bearish rounded top seems to have been obviated by a short-term saucer formation. It appears that a handle is being formed, after which prices should continue to advance.
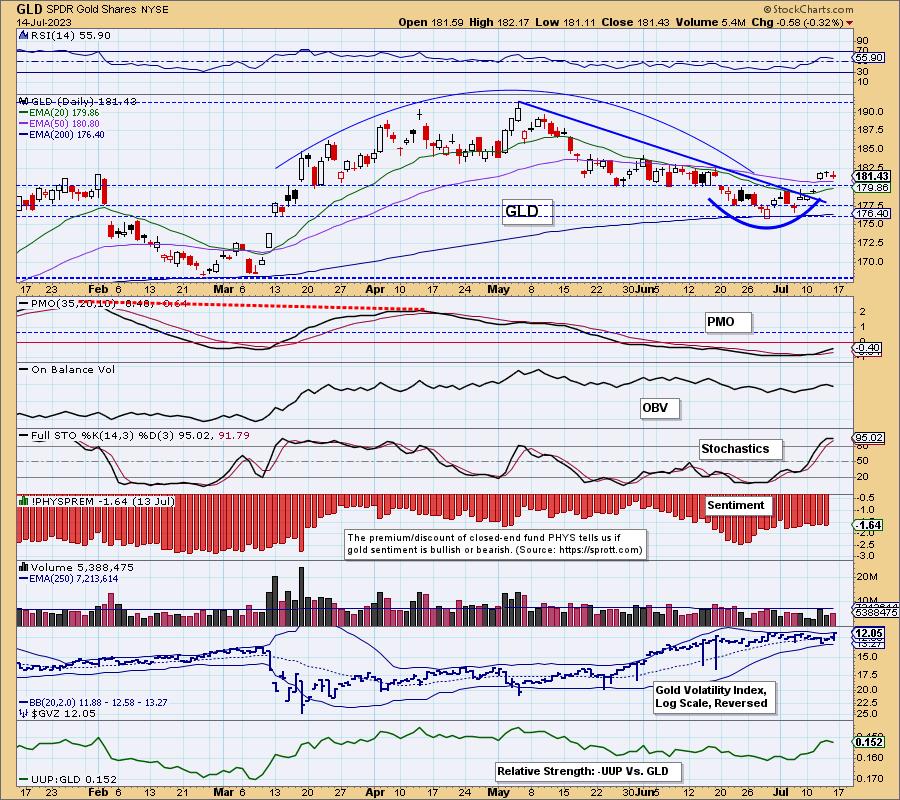
June-July double bottom support provided the base for the declining trend line breakout, and it is likely that price will move higher.
GOLD Weekly Chart: We have emphasized that this current attempt to take out the highs is likely to be successful because it has been more deliberate and not characterized by vertical moves similar to the prior two attempts. We think that scenario is still valid.
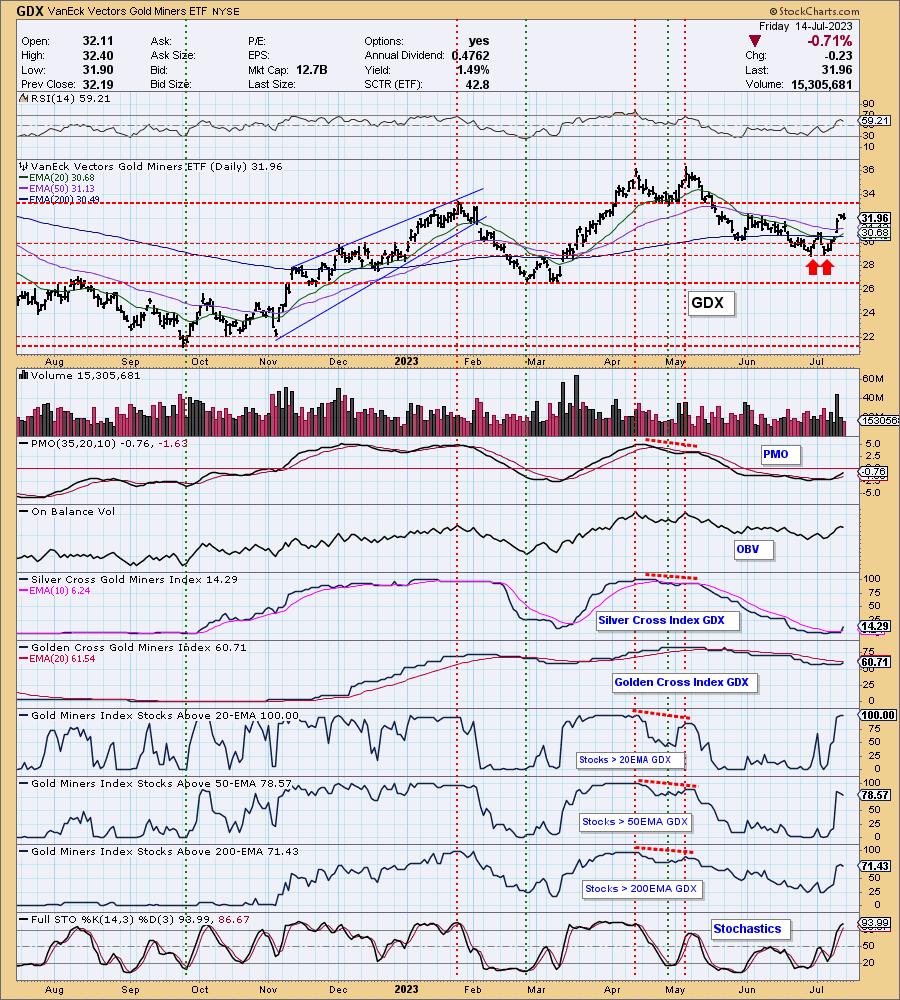
GOLD MINERS Golden and Silver Cross Indexes: As with the metal, Gold Miners have a breakout following a double bottom. Looking bullish.
CRUDE OIL (USO)
IT Trend Model: BUY as of 7/12/2023
LT Trend Model: SELL as of 12/6/2022
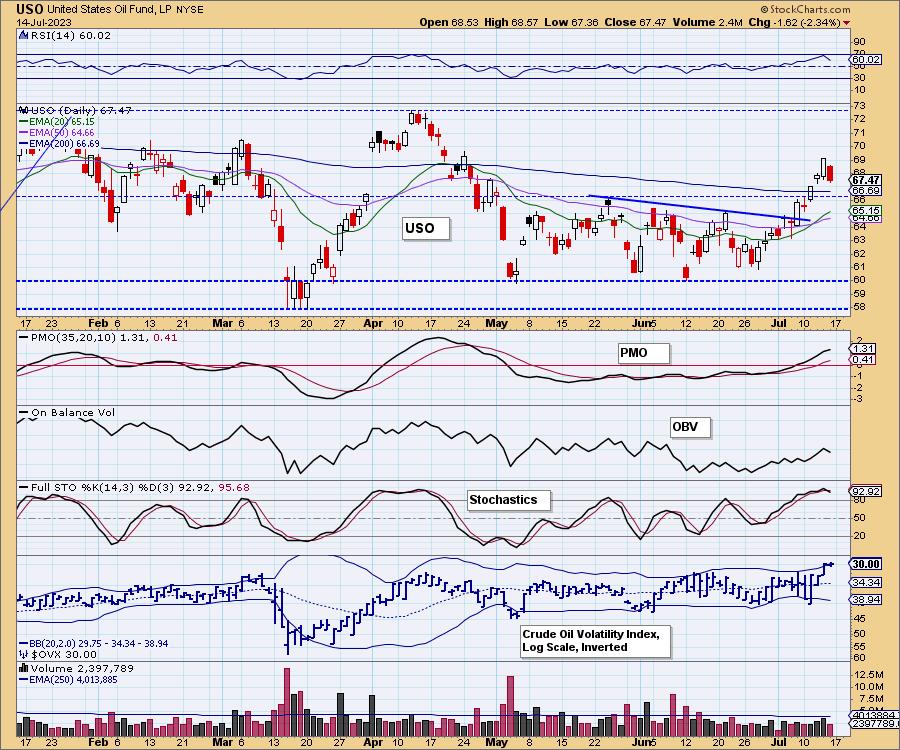
USO Daily Chart: Crude is rising within a short-term trading range.
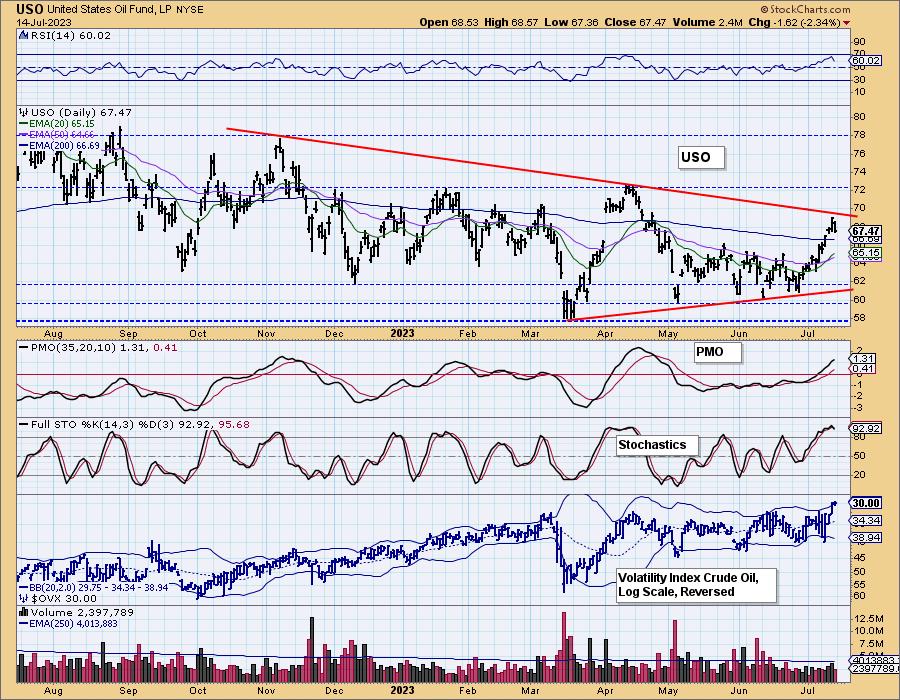
On the one-year chart the trading range seems to be influenced by a triangle formation.
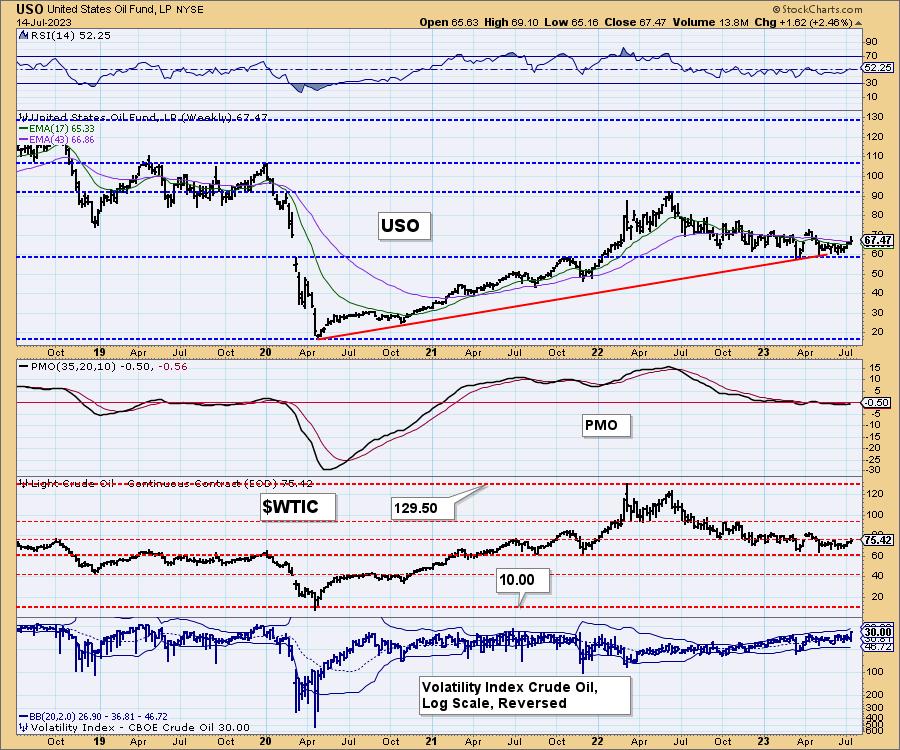
USO/$WTIC Weekly Chart: Longer-term a rising trend line is being tested. Overall, we think crude is waiting for some fundamental event to change the market.
Good Luck & Good Trading!
Erin Swenlin and Carl Swenlin
Technical Analysis is a windsock, not a crystal ball. --Carl Swenlin
(c) Copyright 2023 DecisionPoint.com
Disclaimer: This blog is for educational purposes only and should not be construed as financial advice. The ideas and strategies should never be used without first assessing your own personal and financial situation, or without consulting a financial professional. Any opinions expressed herein are solely those of the author, and do not in any way represent the views or opinions of any other person or entity.
NOTE: The signal status reported herein is based upon mechanical trading model signals, specifically, the DecisionPoint Trend Model. They define the implied bias of the price index based upon moving average relationships, but they do not necessarily call for a specific action. They are information flags that should prompt chart review. Further, they do not call for continuous buying or selling during the life of the signal. For example, a BUY signal will probably (but not necessarily) return the best results if action is taken soon after the signal is generated. Additional opportunities for buying may be found as price zigzags higher, but the trader must look for optimum entry points. Conversely, exit points to preserve gains (or minimize losses) may be evident before the model mechanically closes the signal.
Helpful DecisionPoint Links:
DecisionPoint Alert Chart List
DecisionPoint Golden Cross/Silver Cross Index Chart List
DecisionPoint Sector Chart List
Price Momentum Oscillator (PMO)
Swenlin Trading Oscillators (STO-B and STO-V)
DecisionPoint is not a registered investment advisor. Investment and trading decisions are solely your responsibility. DecisionPoint newsletters, blogs or website materials should NOT be interpreted as a recommendation or solicitation to buy or sell any security or to take any specific action. WEEKLY WRAP: