
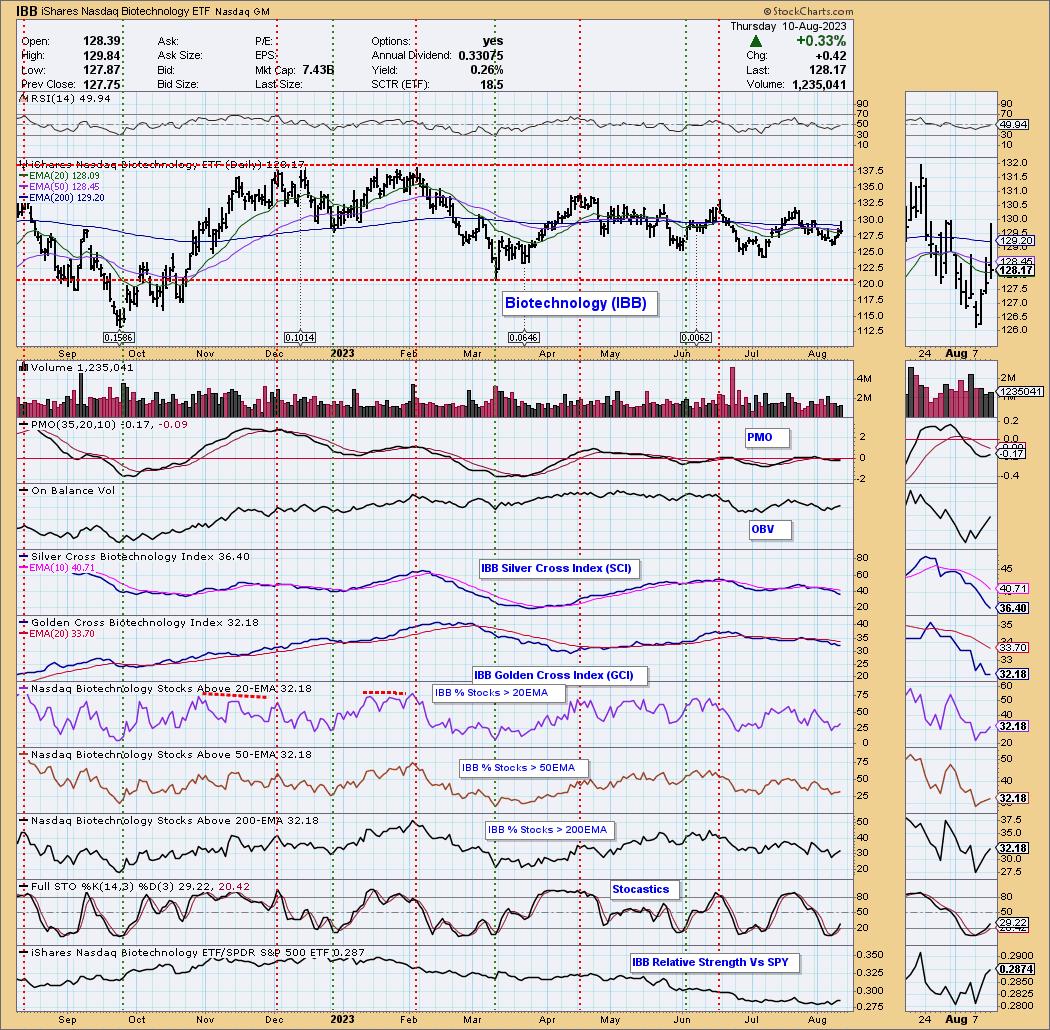
Erin has noticed new momentum on Biotechnology (IBB) and has found many of these stocks in her recent Diamond Scans results. We thought we should look "under the hood" and see if it is healthy enough to consider. There are certainly bullish aspects to the chart, but in our estimation it is really early to count on IBB to rally out of its current trading range.
The EMAs are no help as they have been 'braiding' during this sideways movement. We do note that the RSI is nearly in positive territory and the Price Momentum Oscillator (PMO) has turned up. We also see some participation coming in on %Stocks > 20/50EMAs. It isn't enough to reverse the negative and falling Silver Cross Index. Until those percentages get above the Silver Cross Index, it will not be able to reverse. IBB has broken a declining trend, but we don't see enough positive participation to count on a breakout from this trading range. It is definitely worth a watch, but tread carefully.
The DecisionPoint Alert Weekly Wrap presents an end-of-week assessment of the trend and condition of the Stock Market, the U.S. Dollar, Gold, Crude Oil, and Bonds. The DecisionPoint Alert daily report (Monday through Thursday) is abbreviated and gives updates on the Weekly Wrap assessments.
Watch the latest episode of DecisionPoint on StockCharts TV's YouTube channel here!
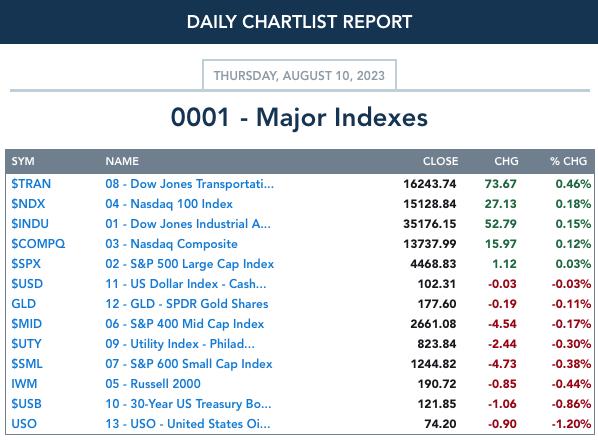
MAJOR MARKET INDEXES
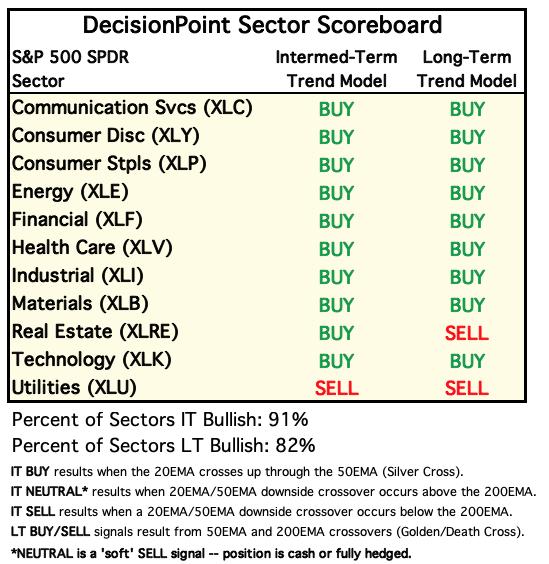
SECTORS
Each S&P 500 Index component stock is assigned to one of 11 major sectors. This is a snapshot of the Intermediate-Term (Silver Cross) and Long-Term (Golden Cross) Trend Model signal status for those sectors.
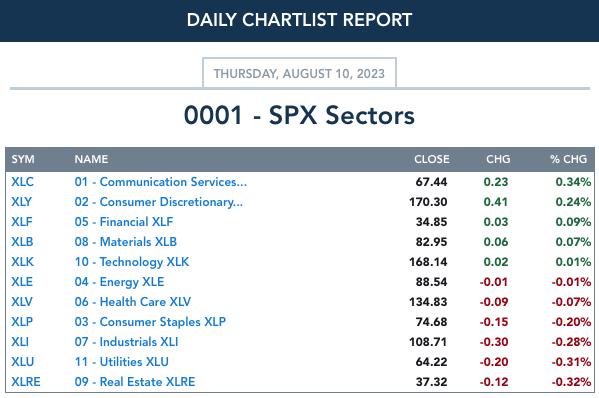
CLICK HERE for Carl's annotated Market Index, Sector, and Industry Group charts.
THE MARKET (S&P 500)
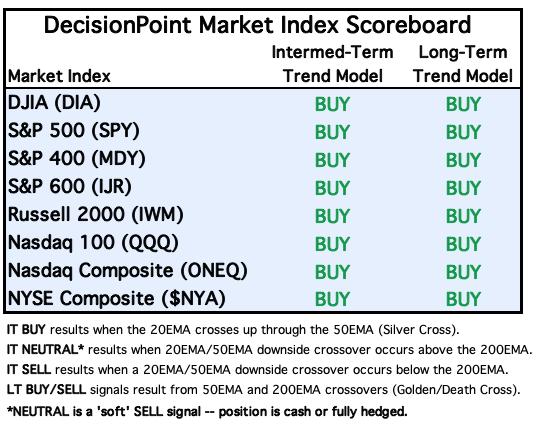
IT Trend Model: BUY as of 3/30/2023
LT Trend Model: BUY as of 3/29/2023
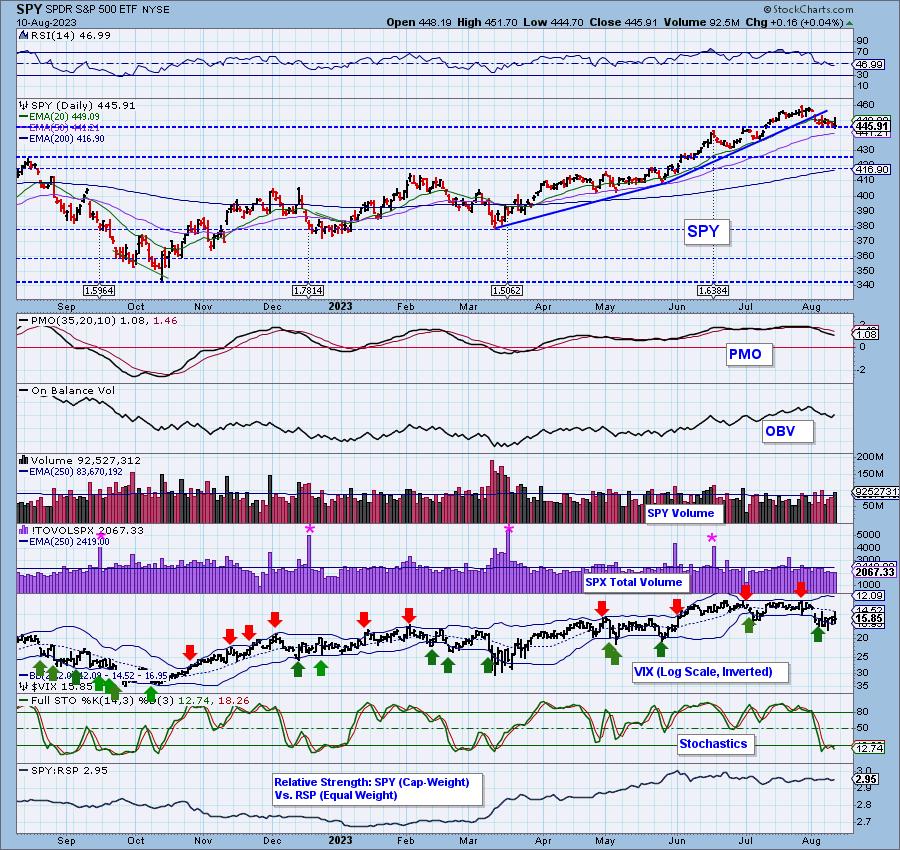
SPY Daily Chart: We saw a positive close today but a bearish filled black candlestick formed and that implies lower prices tomorrow. If that happens, support will likely be lost. The PMO and RSI are configured negatively.
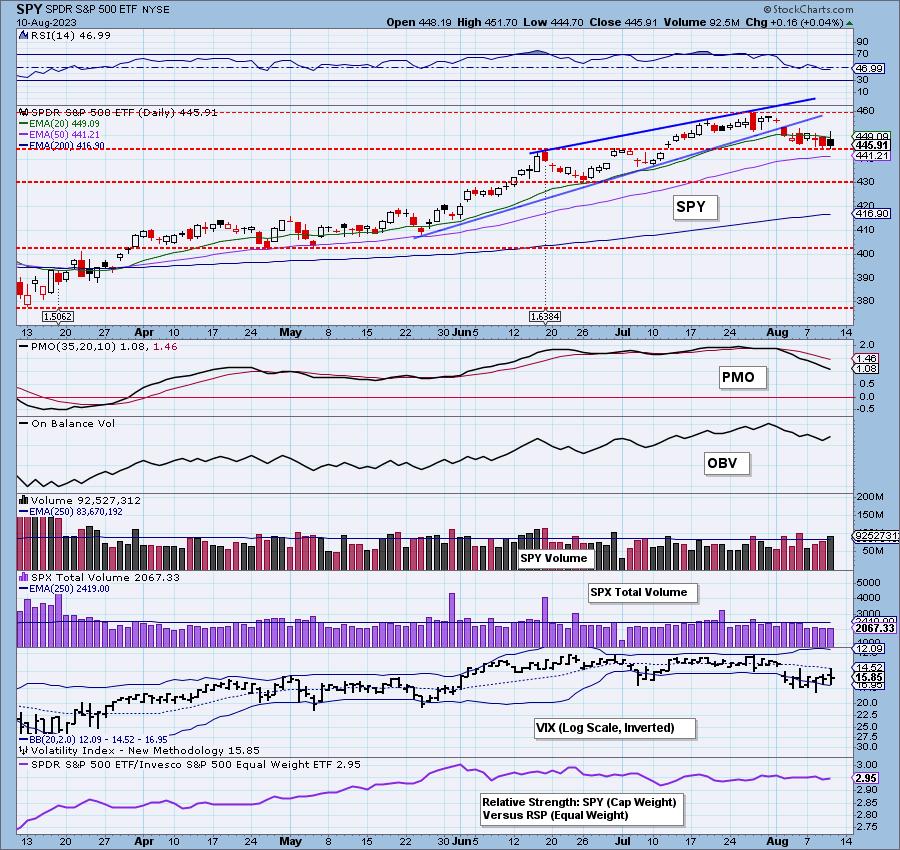
The VIX is oscillating below its moving average on the inverted scale and Stochastics topped beneath 20 suggesting serious internal weakness.

Here is the latest recording:
S&P 500 New 52-Week Highs/Lows: New Highs expanded again today and New Lows contracted. The 10-DMA of the High-Low Differential continues lower, confirming the short-term declining trend.
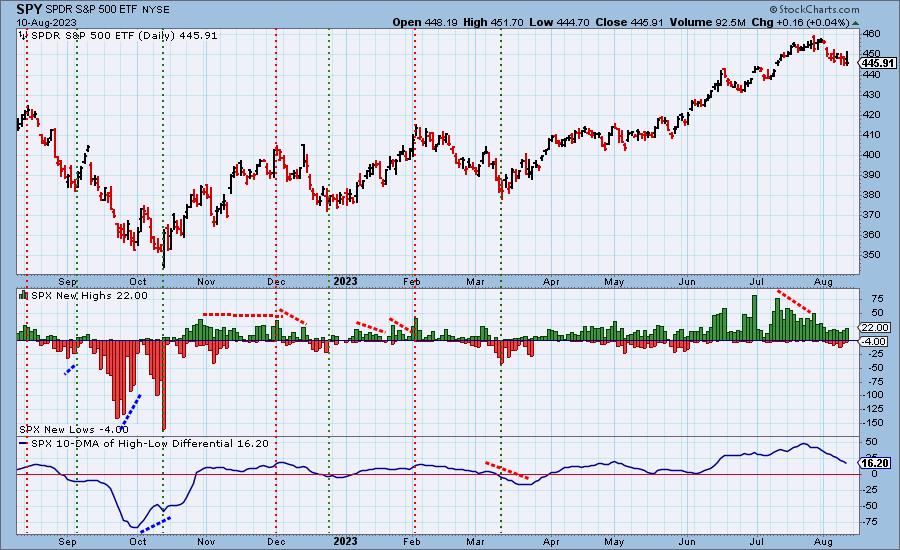
Climax* Analysis: There were no climax readings today.
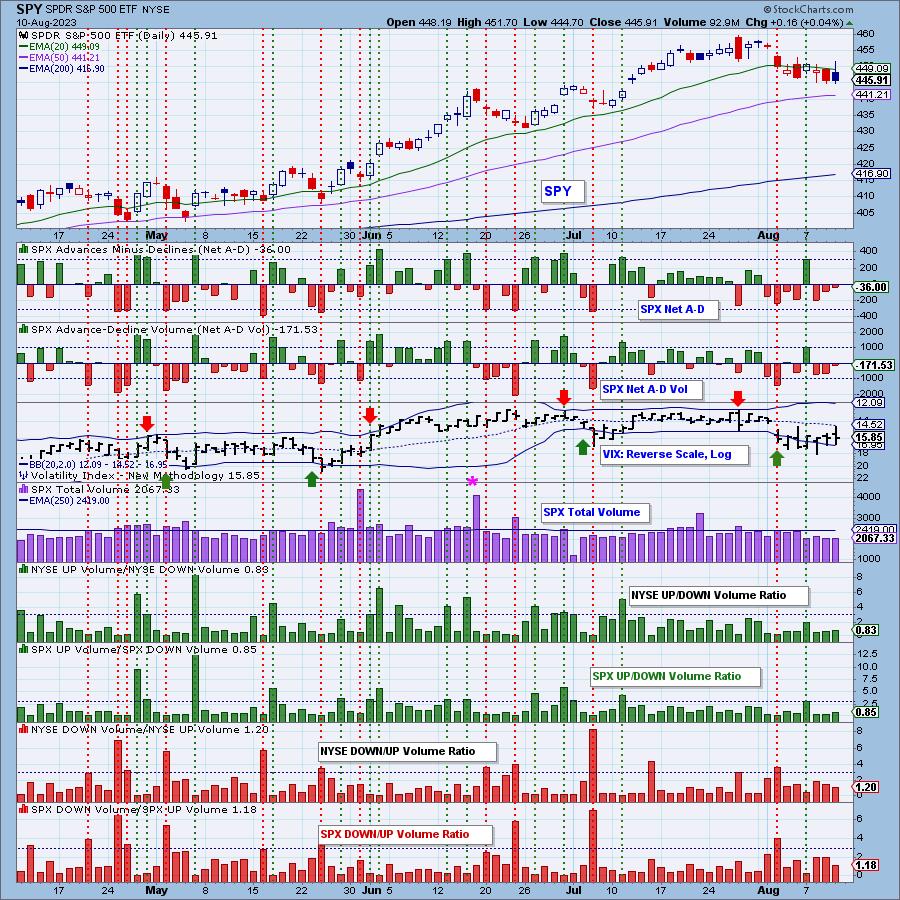
*A climax is a one-day event when market action generates very high readings in, primarily, breadth and volume indicators. We also include the VIX, watching for it to penetrate outside the Bollinger Band envelope. The vertical dotted lines mark climax days -- red for downside climaxes, and green for upside. Climaxes are at their core exhaustion events; however, at price pivots they may be initiating a change of trend.
Short-Term Market Indicators: The short-term market trend is DOWN and the condition is NEUTRAL.
Swenlin Trading Oscillators (STOs) moved higher again today, but participation continues to shrink as we saw fewer stocks with rising momentum. While a stock's price can move higher with a declining PMO, you aren't likely to see sustained upward price movement if the PMO is falling.
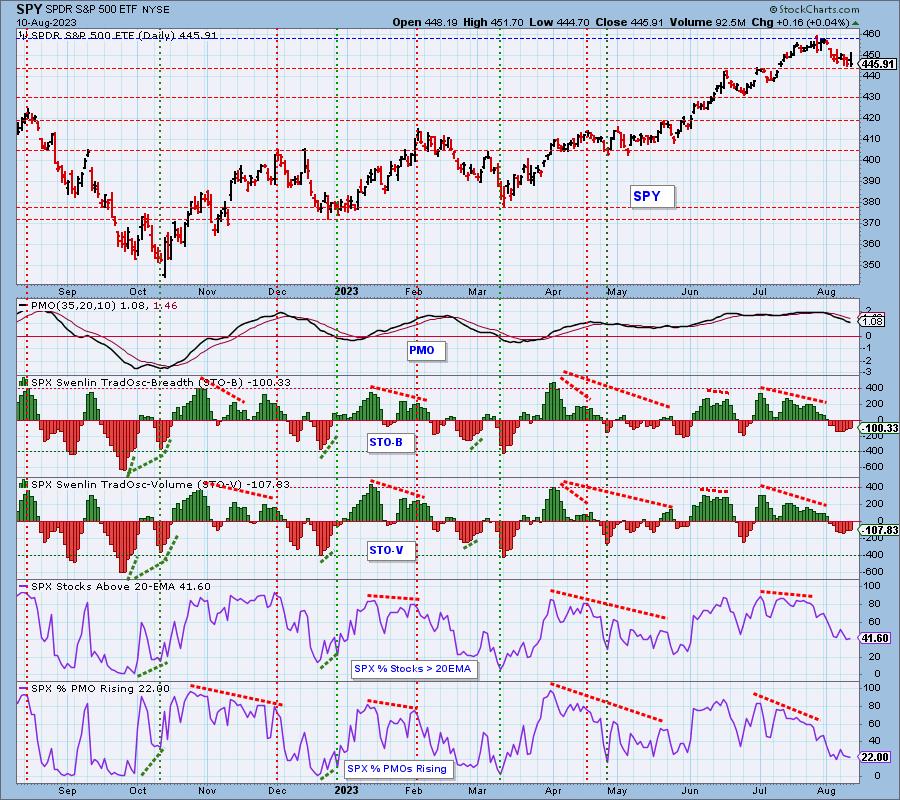
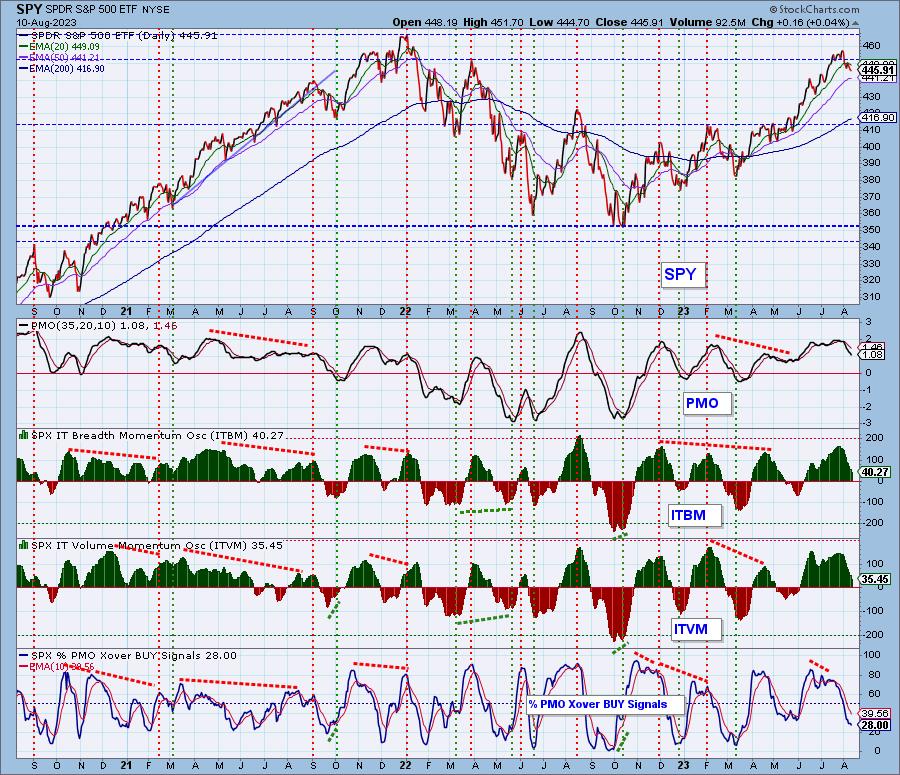
Intermediate-Term Market Indicators: The intermediate-term market trend is UP and the condition is OVERBOUGHT.
IT indicators are now in Neutral territory and are still declining. They aren't confirming the rising STOs yet which is why we aren't reading too much into their ascent. %PMO Cover BUY Signals continue to move lower as we have fewer stocks with rising momentum. Look for this indicator to continue lower.
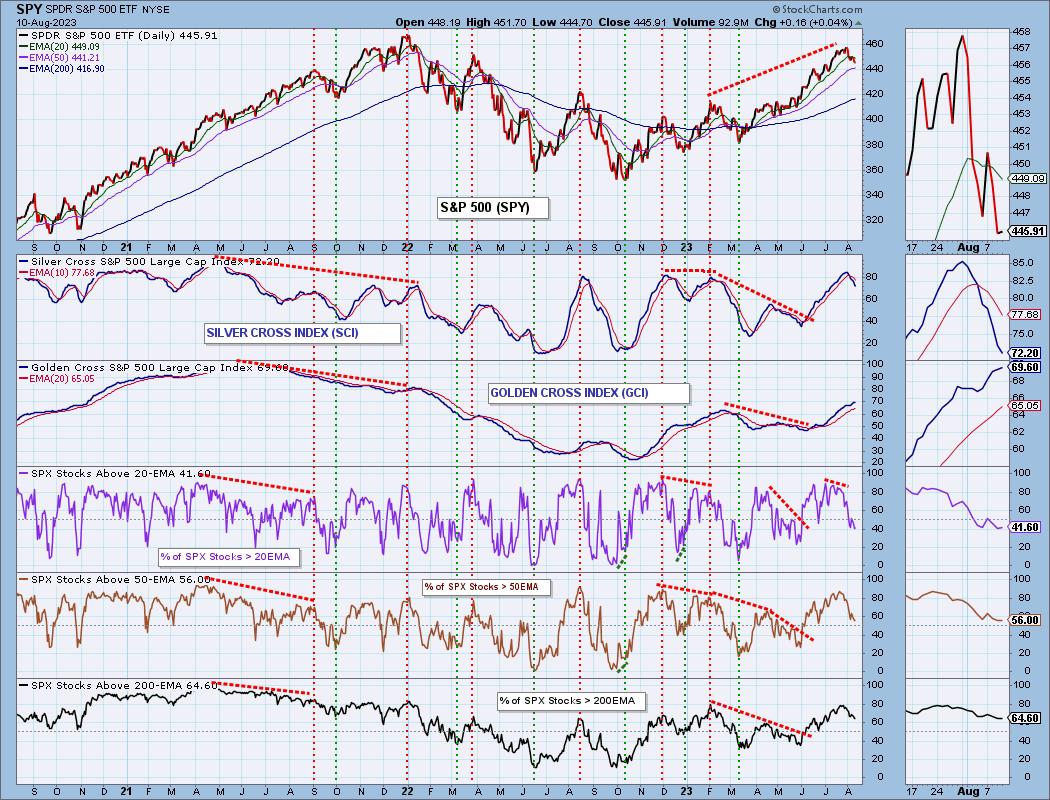
PARTICIPATION and BIAS Assessment: The following chart objectively shows the depth and trend of participation in two time frames.
- Intermediate-Term - the Silver Cross Index (SCI) shows the percentage of SPX stocks on IT Trend Model BUY signals (20-EMA > 50-EMA). The opposite of the Silver Cross is a "Dark Cross" -- those stocks are, at the very least, in a correction.
- Long-Term - the Golden Cross Index (GCI) shows the percentage of SPX stocks on LT Trend Model BUY signals (50-EMA > 200-EMA). The opposite of a Golden Cross is the "Death Cross" -- those stocks are in a bear market.
The market bias is BEARISH in the short and intermediate terms.
The market bias is NEUTRAL in the long term.
%SPX Stocks > 20/50/200EMAs Readings are not oversold yet and continue to decline. The Silver Cross Index continues lower after a "BEAR SHIFT" on the cross below its signal line. We are leaving the long-term bias NEUTRAL given the Golden Cross Index is rising. We do expect the GCI will begin to decline now that there are fewer stocks with price above their 200-day EMA versus the GCI.
CONCLUSION: The market managed a positive close, but the close was below the open which isn't a vote of confidence that the rally will see follow-through. STOs are rising which is positive for the short term, but without confirmation from IT indicators, we aren't reading too much into them. Participation is very weak and given the Silver Cross Index is quickly declining, we are bearish in the short and intermediate terms. As Carl wrote in his article yesterday, the mega-caps look extraordinarily weak. They have held the market together and if they fail, they will likely spur the market to fall apart. Continue to play defense.
Erin is 20% long, 4% short.
Have you subscribed the DecisionPoint Diamonds yet? DP does the work for you by providing handpicked stocks/ETFs from exclusive DP scans! Add it with a discount! Contact support@decisionpoint.com for more information!
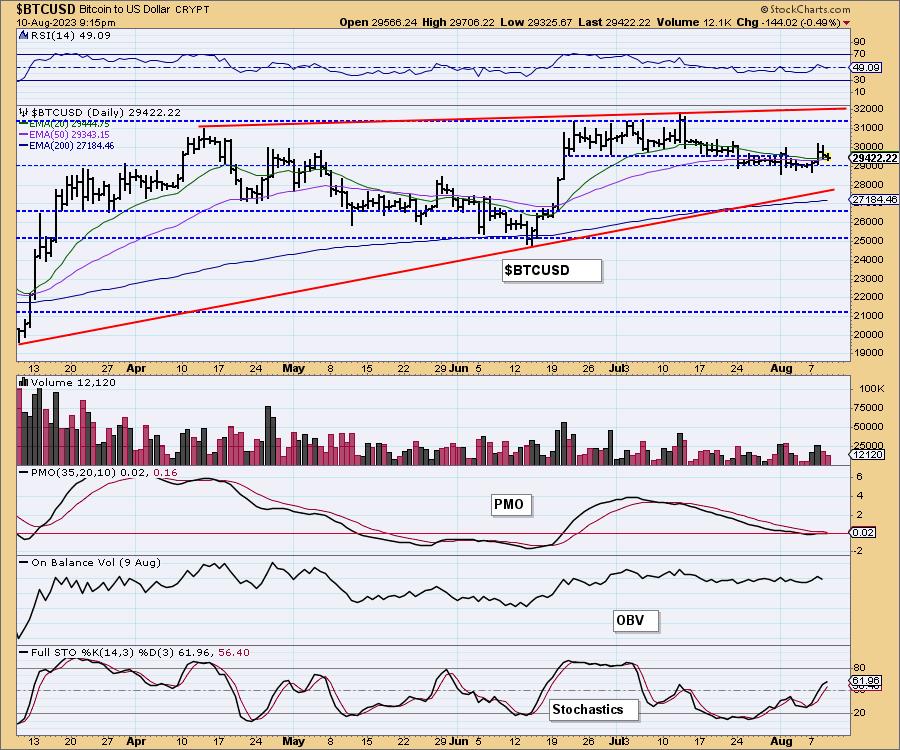
BITCOIN
The decline continued today for Bitcoin and it is starting to deteriorate the RSI and PMO. Stochastics are still rising. We expect to see support hold for now, but aren't looking for a big rally.
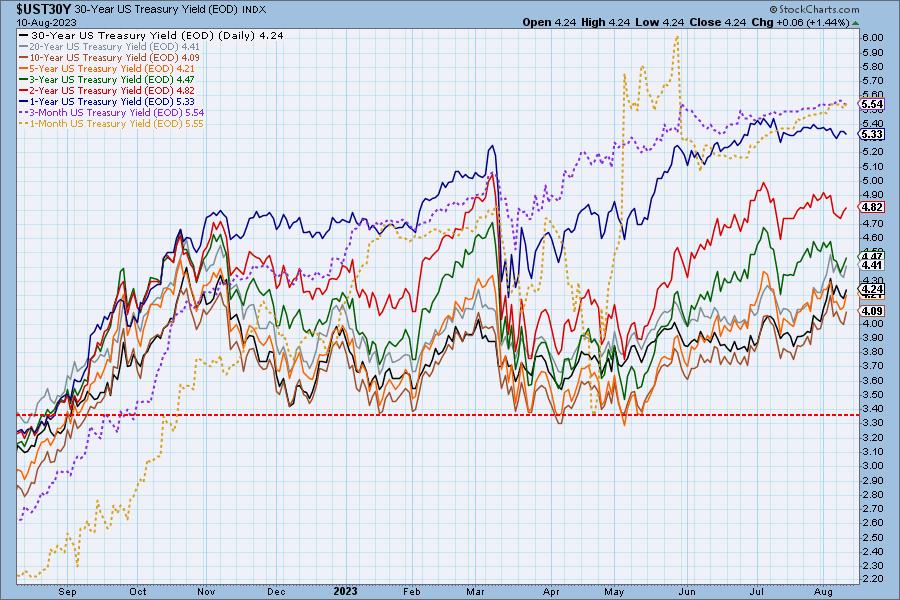
INTEREST RATES
Yields began to rise again today. Declining trends haven't been broken yet in the very short term, but we expect they will soon.
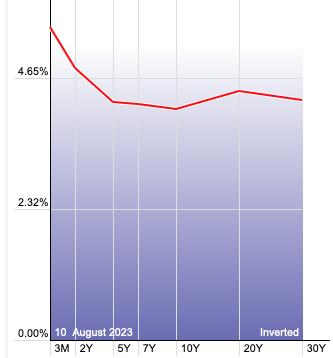
The Yield Curve Chart from StockCharts.com shows us the inversions taking place. The red line should move higher from left to right. Inversions are occurring where it moves downward.
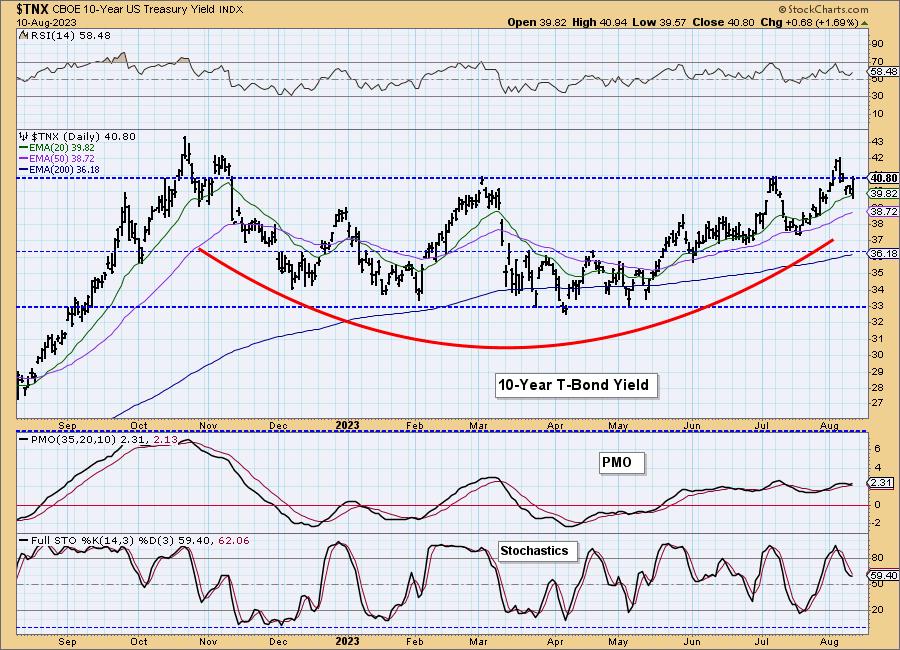
10-YEAR T-BOND YIELD
$TNX surged higher today but remains below overhead resistance. We expect a breakout given the PMO "Surge" above the signal line (bottom above the signal line). Stochastics aren't on board yet, but another rally and that should change quickly.
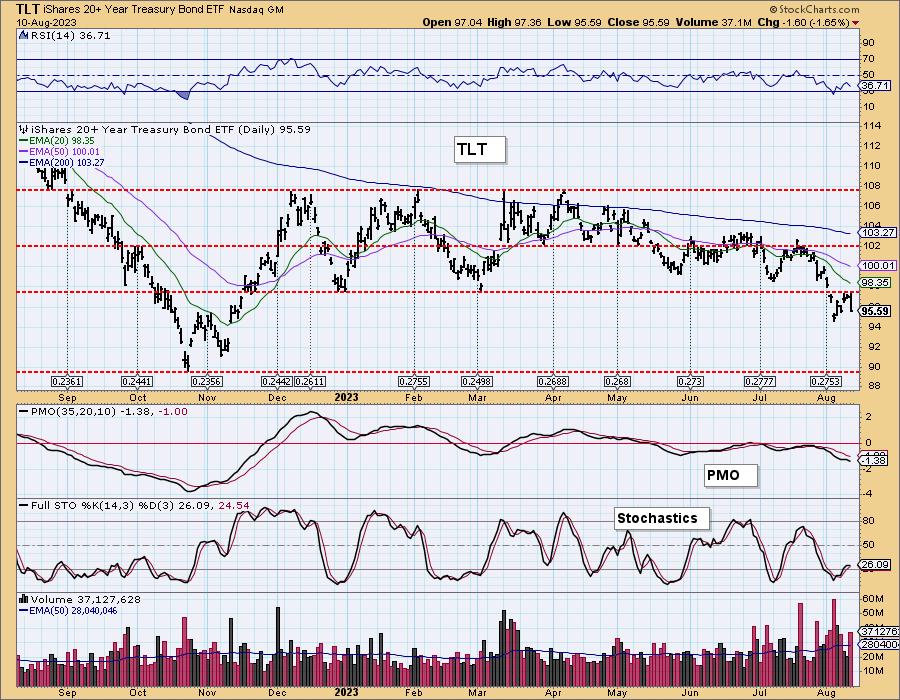
BONDS (TLT)
IT Trend Model: SELL as of 5/16/2023
LT Trend Model: SELL as of 1/19/2022
TLT Daily Chart: Price didn't even reach resistance before being turned away. This suggests more downside. Indicators are in agreement as the PMO is accelerating lower, the RSI is negative and falling, and Stochastics have topped in negative territory.
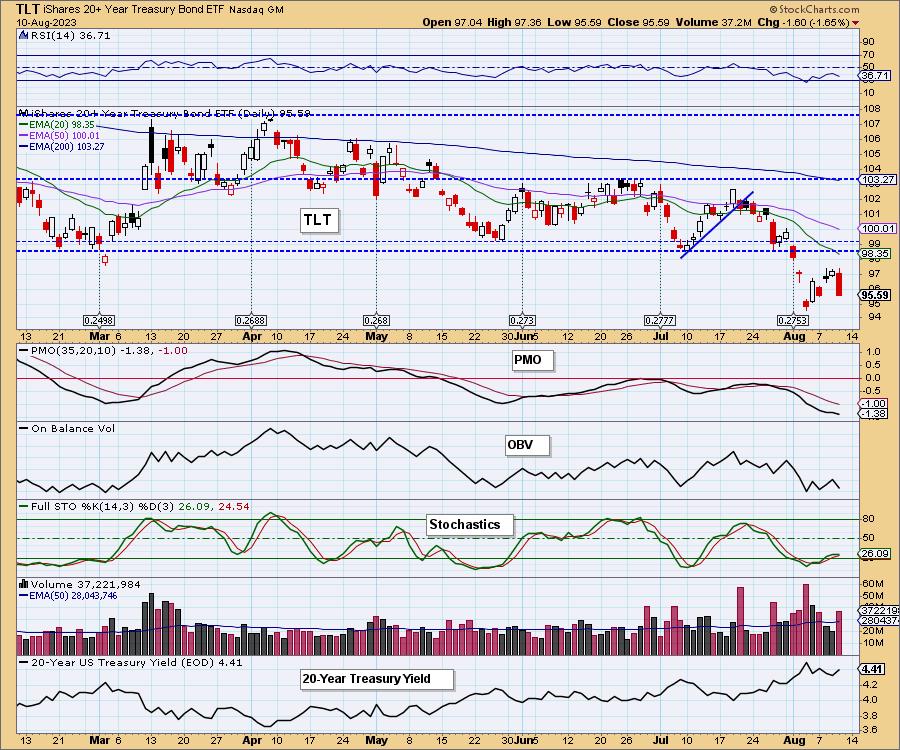
The next level of strong support lies at 90.00.
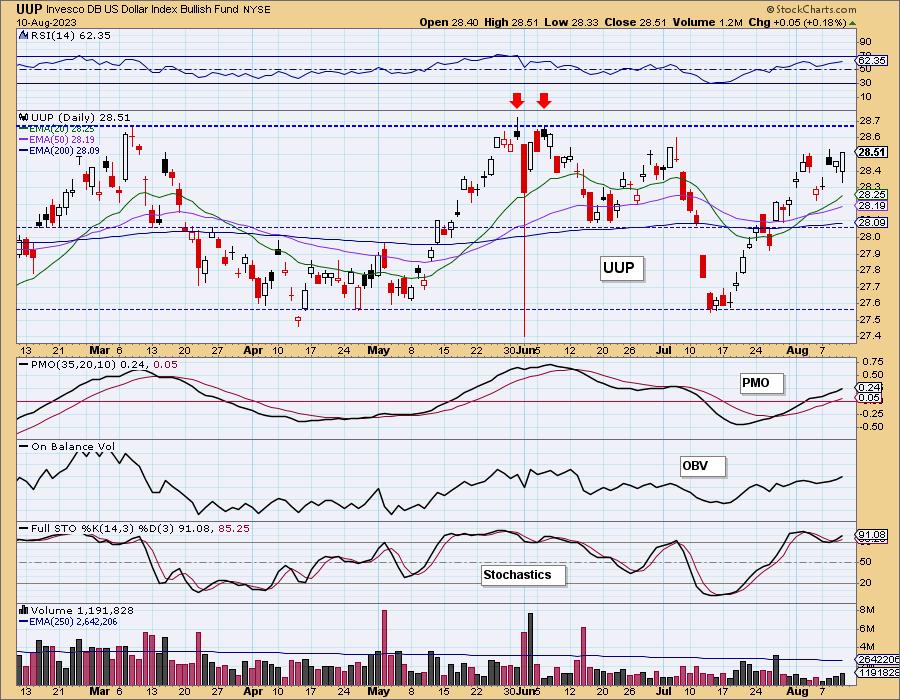
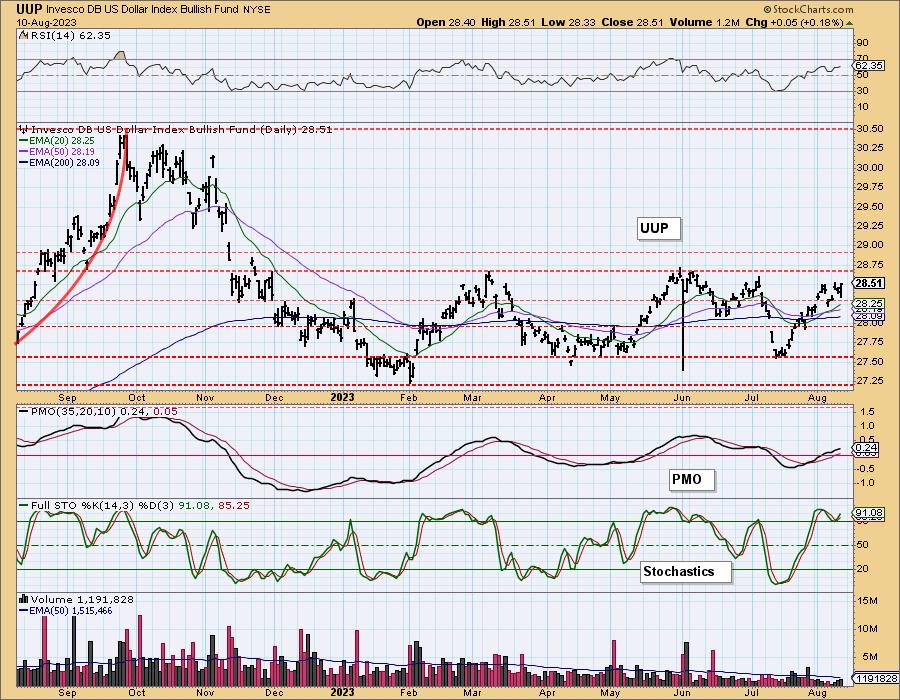
DOLLAR (UUP)
IT Trend Model: BUY as of 8/3/2023
LT Trend Model: BUY as of 5/25/2023
UUP Daily Chart: UUP rallied on the day, but didn't make up much ground. The rising trend is mostly intact. We do not want to see another down day as that could form a short-term double-top. For now, given positive indicators, we expect a test of overhead resistance at the May/June tops.
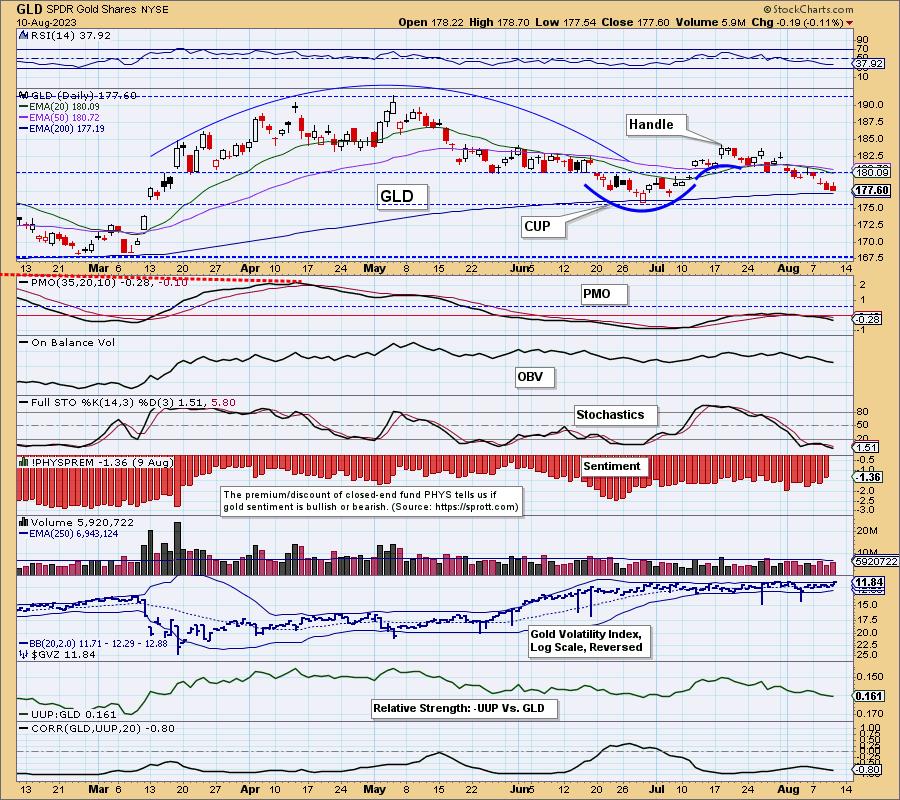
GOLD
IT Trend Model: NEUTRAL as of 8/2/2023
LT Trend Model: BUY as of 1/5/2023
GLD Daily Chart: Yesterday's comments still apply:
"As we expected, GLD is testing support at the 200-day EMA. Indicators are very bearish so we would look for a test of the June low. It's time for Gold to reawaken, but we don't see enough evidence to look for the reversal yet."
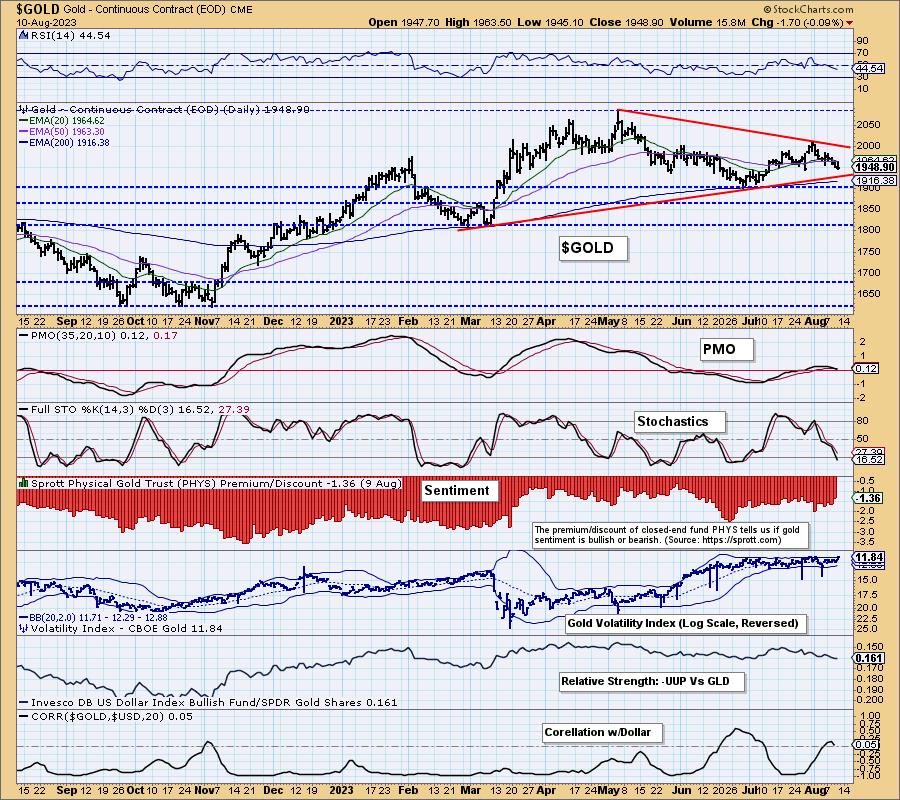
GOLD Daily Chart: $GOLD is no longer correlated with the Dollar. It is showing weakness relatively against the Dollar. We see a high likelihood that even if the Dollar declines, we would still see lower Gold prices. We are watching support at the 200-day EMA closely. That has been a reversal point since February.
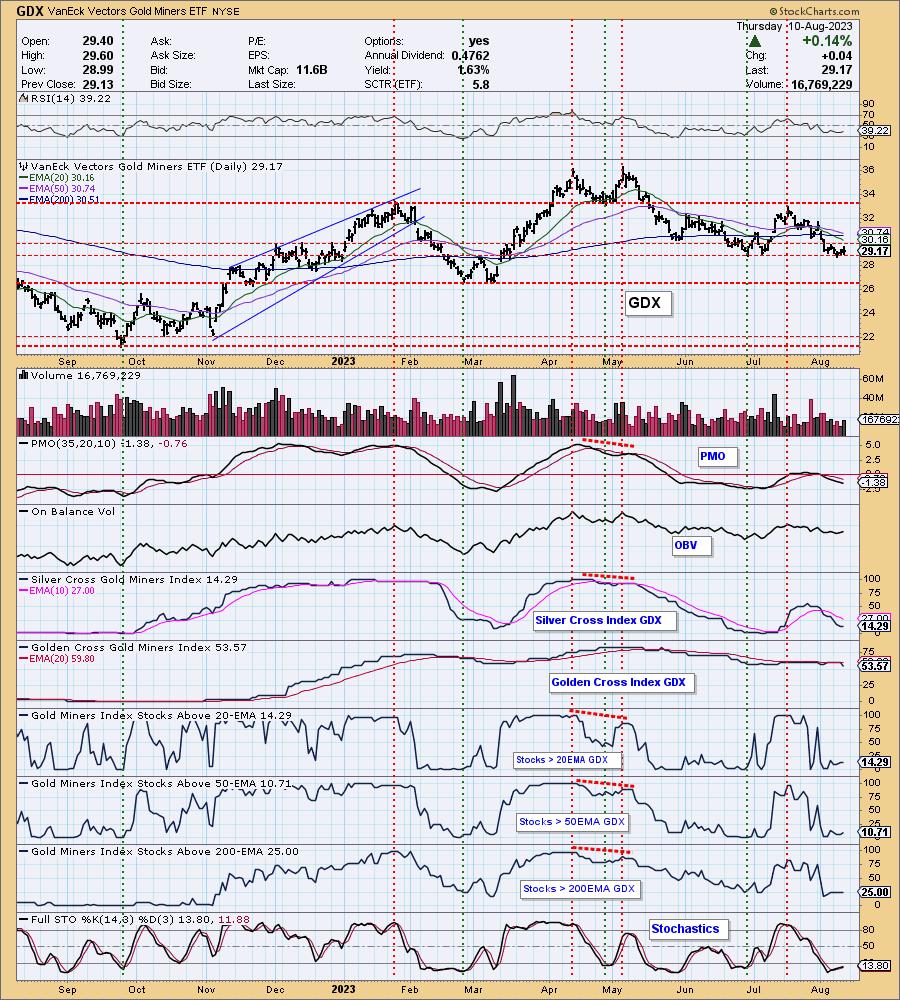
GOLD MINERS Golden and Silver Cross Indexes: Yesterday's comments still apply:
"Gold Miners are holding support in spite of negative indicators. We aren't seeing any expansion in participation under the surface so more than likely a breakdown is ahead for GDX. Support looks strong at 26.00, but we wouldn't look to reenter this group until participation gets back to where it was before."
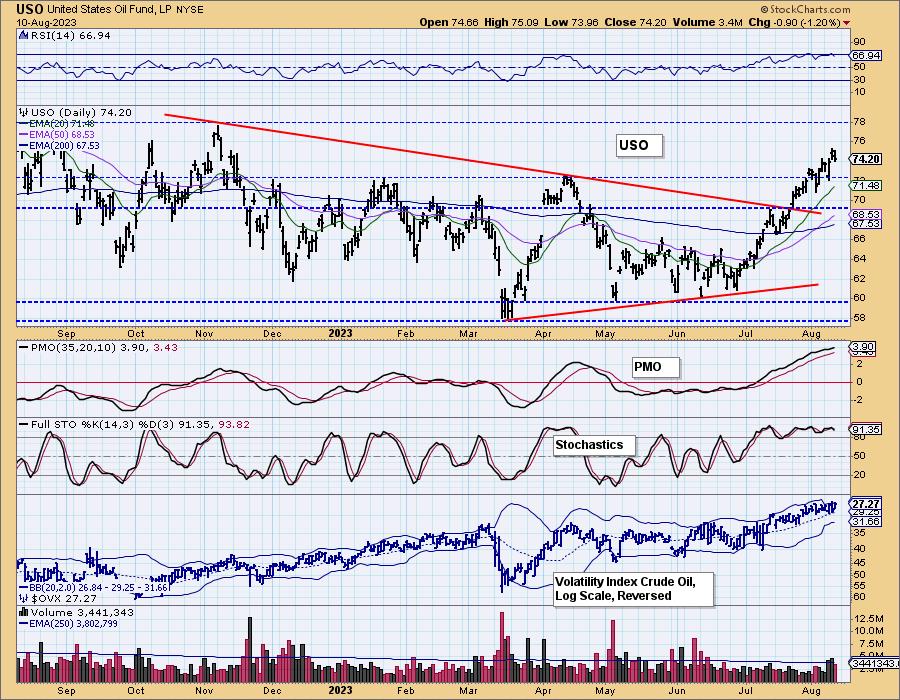
CRUDE OIL (USO)
IT Trend Model: BUY as of 7/12/2023
LT Trend Model: BUY as of 8/3/2023
USO Daily Chart: Crude Oil fell back into the bearish rising wedge. We don't see it as significant. The RSI has moved out of overbought territory due to the decline, but the PMO and Stochastics remain very bullish. Support appears strong to us at the April top.
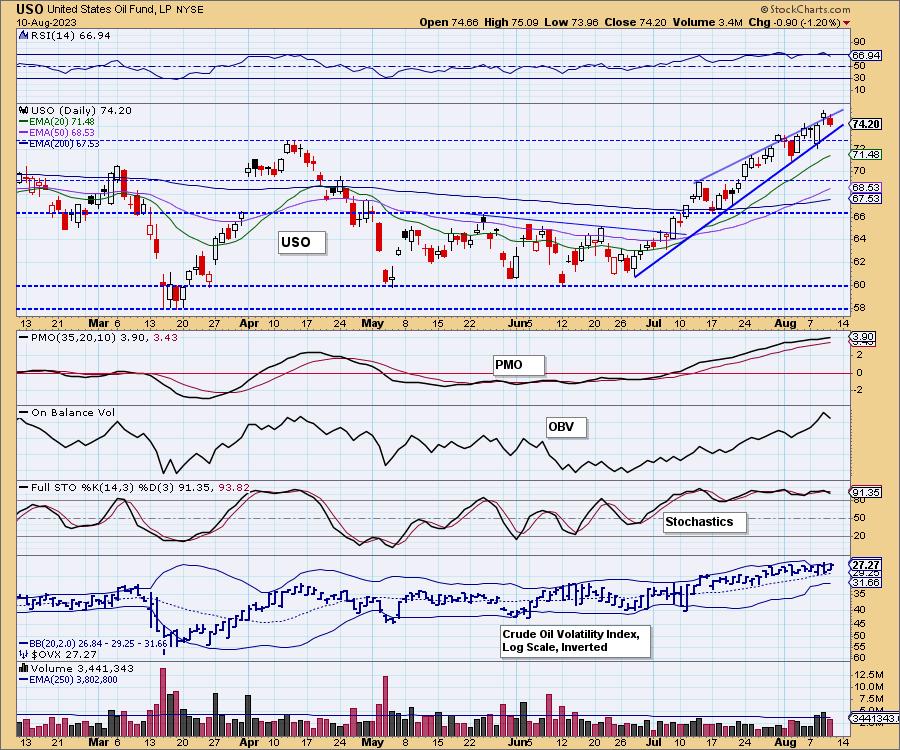
Based on the one-year chart we see 78.00 as the next stop for USO.
Good Luck & Good Trading!
Erin Swenlin and Carl Swenlin
Technical Analysis is a windsock, not a crystal ball. --Carl Swenlin
(c) Copyright 2023 DecisionPoint.com
Disclaimer: This blog is for educational purposes only and should not be construed as financial advice. The ideas and strategies should never be used without first assessing your own personal and financial situation, or without consulting a financial professional. Any opinions expressed herein are solely those of the author, and do not in any way represent the views or opinions of any other person or entity.
NOTE: The signal status reported herein is based upon mechanical trading model signals, specifically, the DecisionPoint Trend Model. They define the implied bias of the price index based upon moving average relationships, but they do not necessarily call for a specific action. They are information flags that should prompt chart review. Further, they do not call for continuous buying or selling during the life of the signal. For example, a BUY signal will probably (but not necessarily) return the best results if action is taken soon after the signal is generated. Additional opportunities for buying may be found as price zigzags higher, but the trader must look for optimum entry points. Conversely, exit points to preserve gains (or minimize losses) may be evident before the model mechanically closes the signal.
Helpful DecisionPoint Links:
DecisionPoint Alert Chart List
DecisionPoint Golden Cross/Silver Cross Index Chart List
DecisionPoint Sector Chart List
Price Momentum Oscillator (PMO)
Swenlin Trading Oscillators (STO-B and STO-V)
DecisionPoint is not a registered investment advisor. Investment and trading decisions are solely your responsibility. DecisionPoint newsletters, blogs or website materials should NOT be interpreted as a recommendation or solicitation to buy or sell any security or to take any specific action.