
In our DecisionPoint Trading Room this morning Carl presented a chart of the Japan Stock Market Index (AKA the Nikkei 225). Last week it finally regained all of its losses from the 1989 crash. It was a 44-year journey, the first 19 years of which was spent in a secular bear market and an -82% decline.
Imagine, if you will, being a 65-year-old person retiring at the end of 1989, or being a 30-year-old person starting to invest for retirement at the same time. Conversely, imagine the same two people with a starting point of 2009. Timing is kind of important.
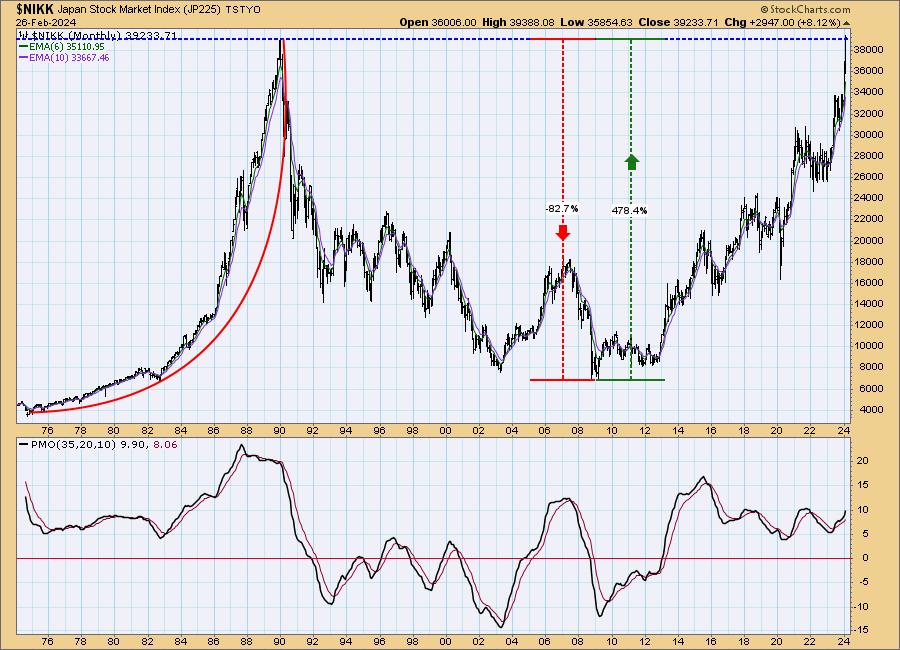
The most important feature on this chart is the parabolic advance in the 1980s. These near vertical moves usually end in tears because they are driven by "irrational exuberance." They don't always end in -80% losses, but we should see them as a flashing red light.
_________
Another tidbit, today Carl saw a guest on Fox Business who proposed that a person could start saving $100/month now, and in 40 years they would have $300,000. We didn't check the math, but the point that was missed was that 40 years with inflation, $300,000 would only have the buying power of about $30,000 today.
The DecisionPoint Alert Weekly Wrap presents an end-of-week assessment of the trend and condition of the Stock Market, the U.S. Dollar, Gold, Crude Oil, and Bonds. The DecisionPoint Alert daily report (Monday through Thursday) is abbreviated and gives updates on the Weekly Wrap assessments.
Watch the latest episode of DecisionPoint on our YouTube channel here!
MARKET/INDUSTRY GROUP/SECTOR INDEXES
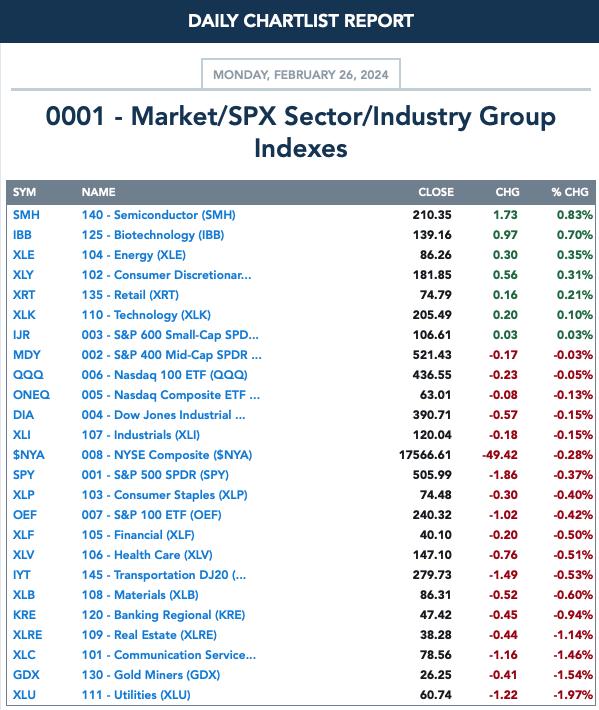
CLICK HERE for Carl's annotated Market Index, Sector, and Industry Group charts.
THE MARKET (S&P 500)
IT Trend Model: BUY as of 11/14/2023
LT Trend Model: BUY as of 3/29/2023
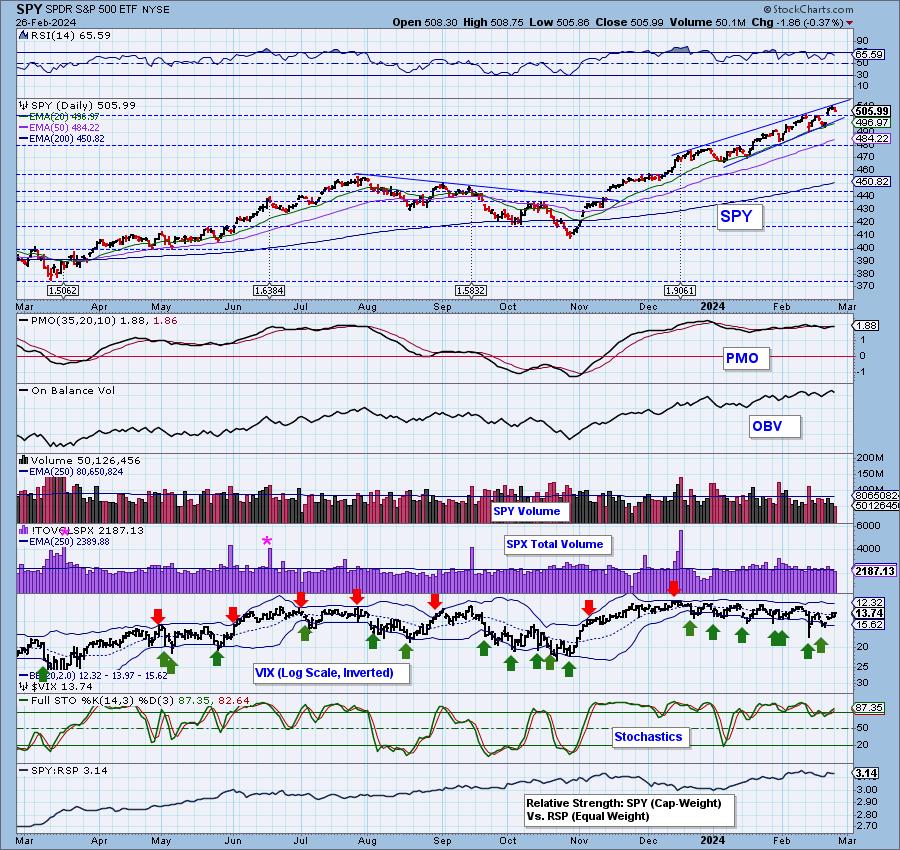
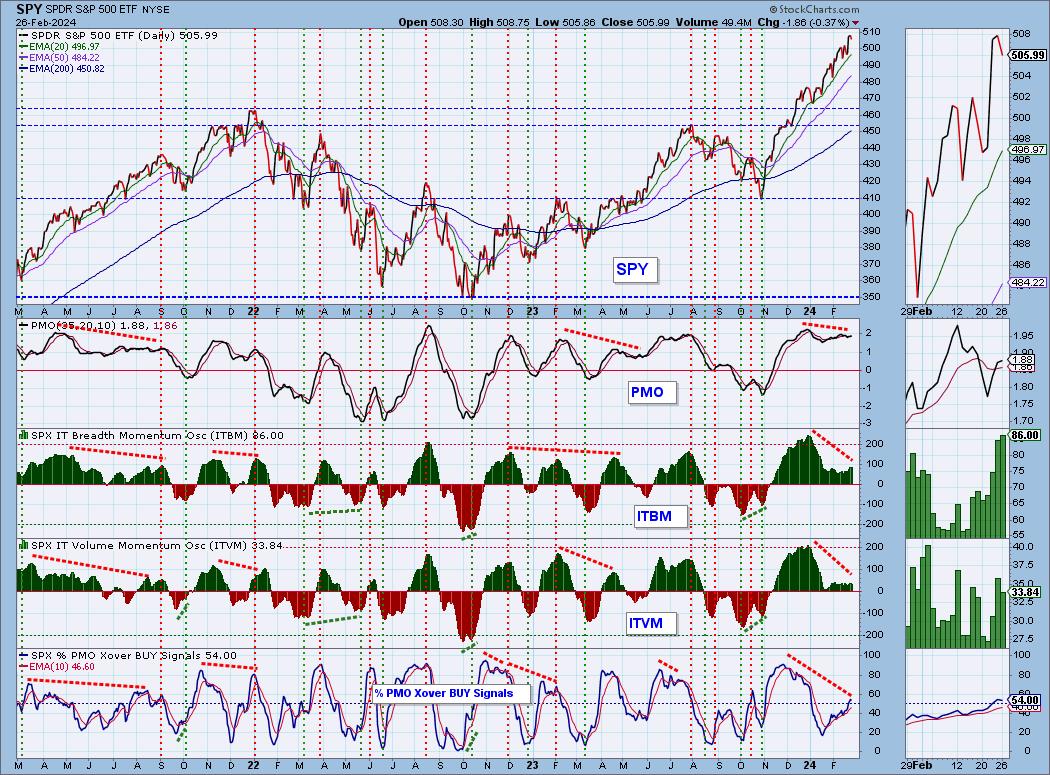
SPY Daily Chart: It appears we are about ready to see another stumble by the SPY on its way higher. It could turn into something more, but so far none of these declines has deterred this relentless rally. It's hard to tell, but the PMO is still rising. It did decelerate on today's decline but remains above its signal line, holding onto the Crossover BUY Signal.
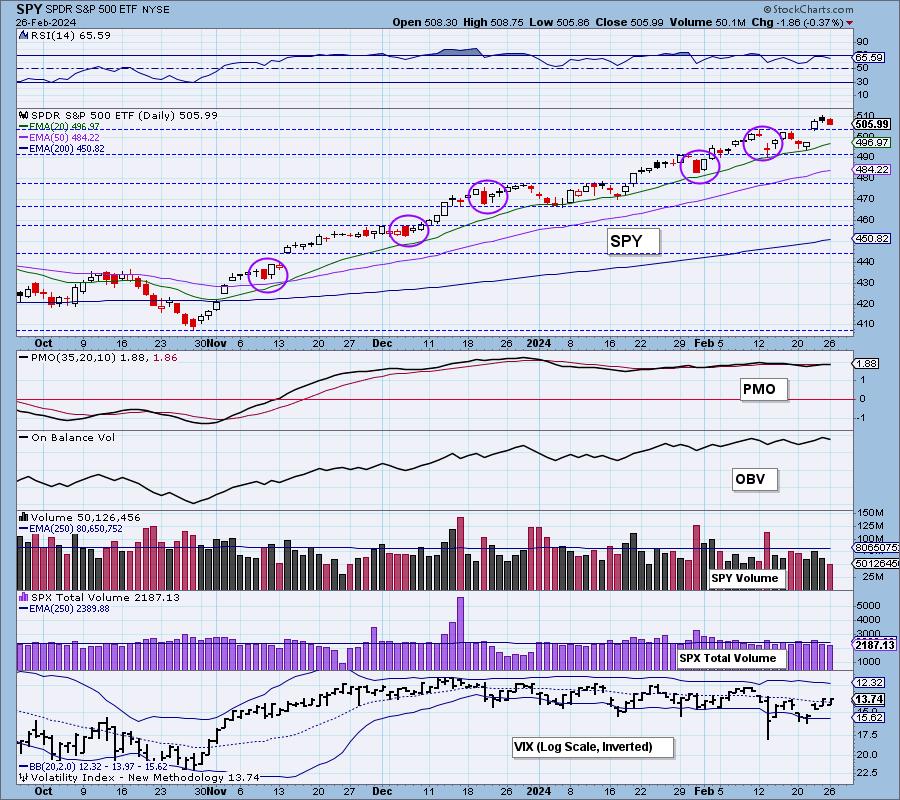
This decline has afforded the RSI the opportunity to leave overbought territory. We still think the market as a whole is overbought, but very short-term it isn't as overbought based on the RSI. The VIX is back above its moving average on the inverted scale and Stochastics are rising above 80 which implies internal strength.

Here is the latest recording from 2/26:
Subscribe to our YouTube channel to get notified when recordings have been posted!
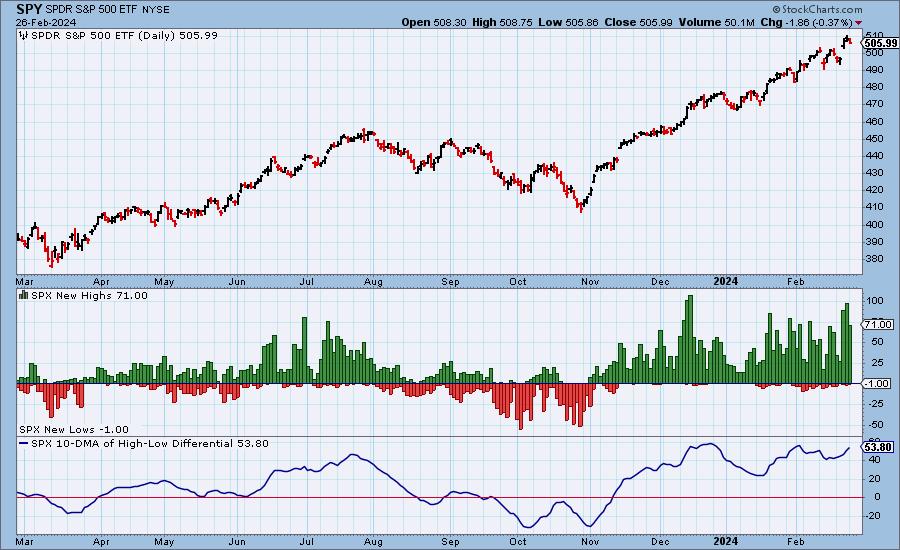
S&P 500 New 52-Week Highs/Lows: New Highs contracted as we would expect but are still at a high level. The 10-DMA of the High-Low Differential is on the rise, but is in overbought territory.
Climax* Analysis: There were no climax readings today.
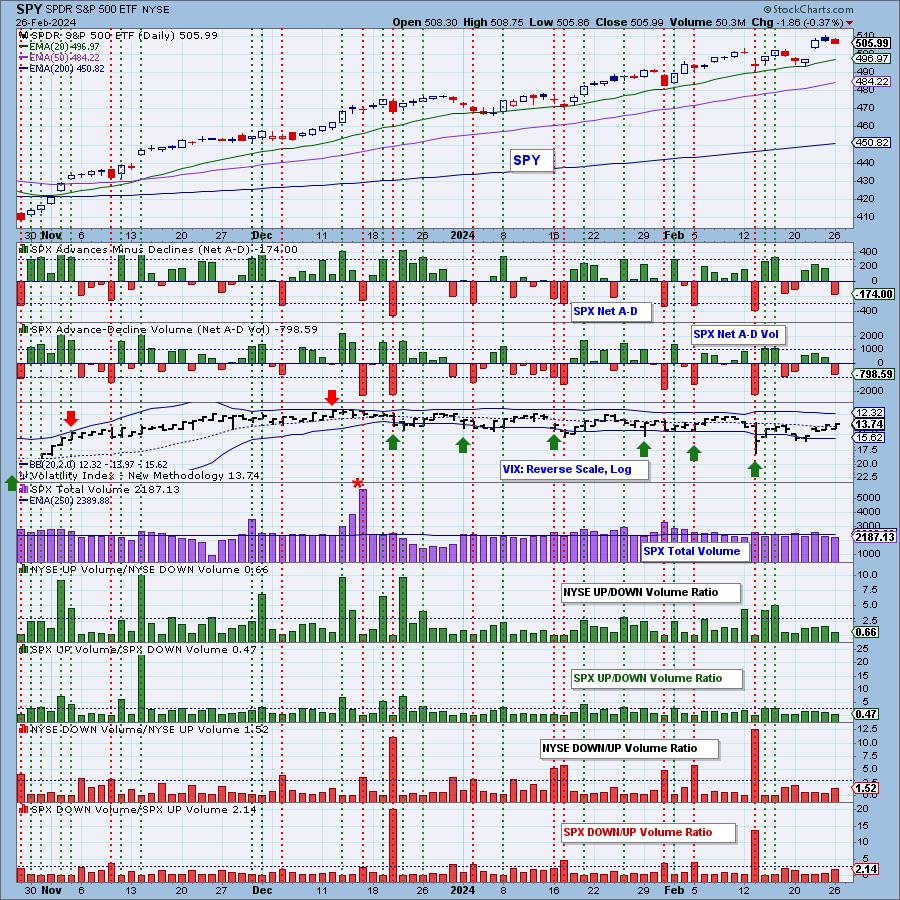
*A climax is a one-day event when market action generates very high readings in, primarily, breadth and volume indicators. We also include the VIX, watching for it to penetrate outside the Bollinger Band envelope. The vertical dotted lines mark climax days -- red for downside climaxes, and green for upside. Climaxes are at their core exhaustion events; however, at price pivots they may be initiating a change of trend.
Short-Term Market Indicators: The short-term market trend is UP and the condition is NEUTRAL.
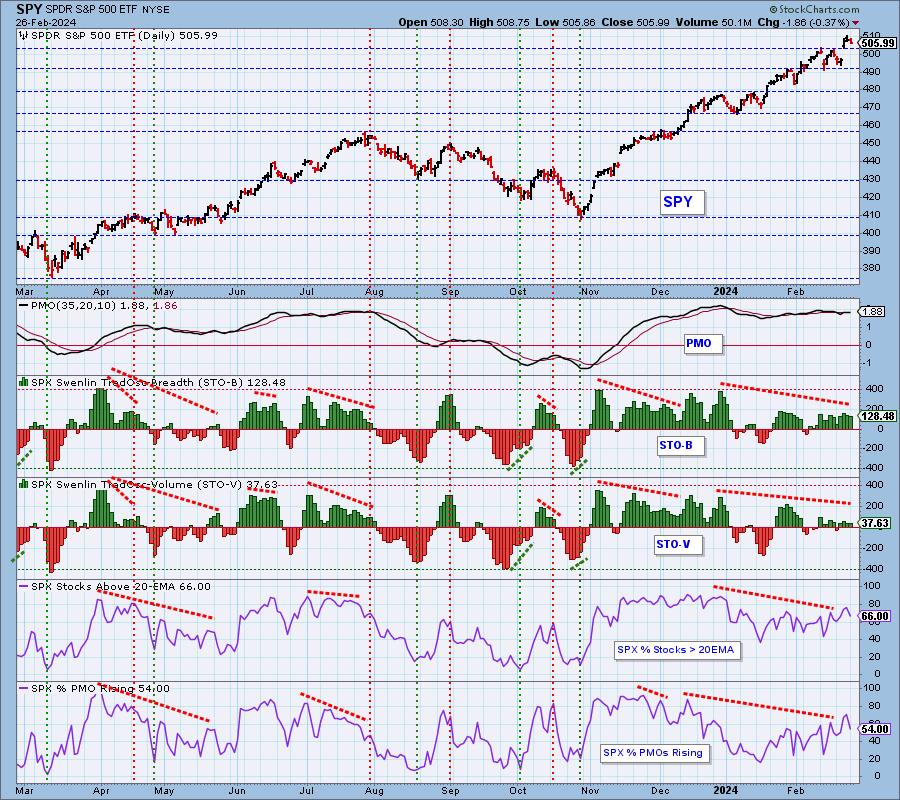
Swenlin Trading Oscillators (STOs) turned down on Friday and continued lower today which is not good for the short-term picture. We do have over 50% of stocks with rising momentum, but today it pared back significantly as many stocks saw PMO tops. Two-thirds of the index are still holding above their 20-day EMA which is bullish though deteriorating. Negative divergences continue to warn against getting too bullish.
Intermediate-Term Market Indicators: The intermediate-term market trend is UP and the condition is NEUTRAL.
The ITBM is continuing to rise, but today the ITVM turned lower. We now have the same amount of PMO BUY Signals as we do rising PMOs (54%). This tells us that unless we get some PMOs to turn back up, %PMO Xover BUY Signals will begin declining. That will confirm the deep negative divergence on the indicator.
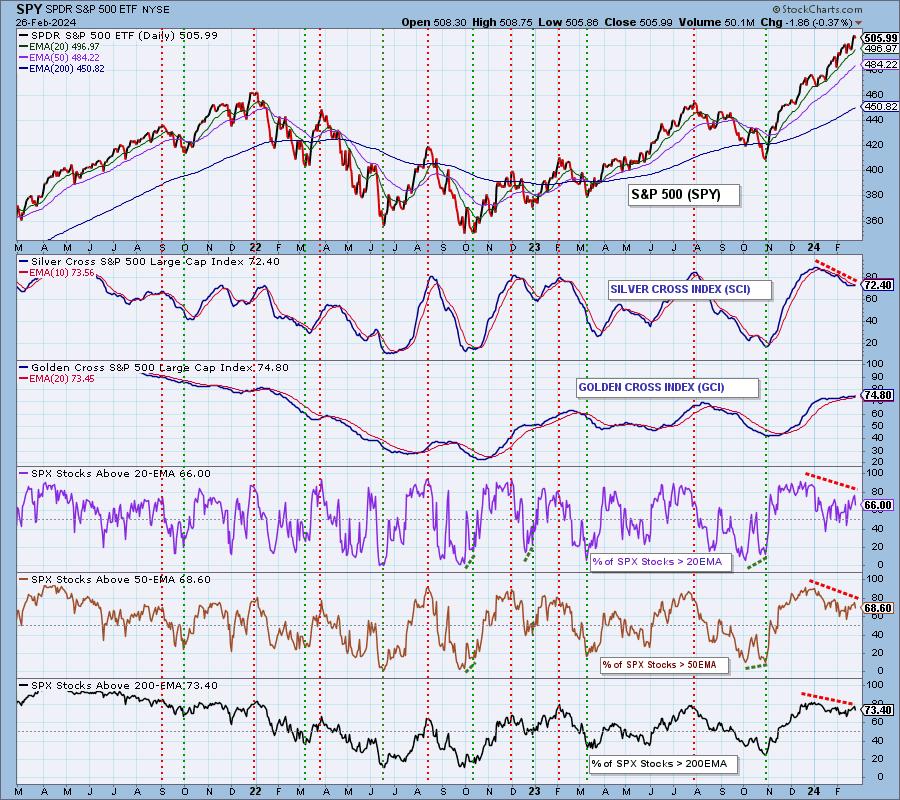
PARTICIPATION: The following chart objectively shows the depth and trend of participation in two time frames.
- Intermediate-Term - the Silver Cross Index (SCI) shows the percentage of SPX stocks on IT Trend Model BUY signals (20-EMA > 50-EMA). The opposite of the Silver Cross is a "Dark Cross" -- those stocks are, at the very least, in a correction.
- Long-Term - the Golden Cross Index (GCI) shows the percentage of SPX stocks on LT Trend Model BUY signals (50-EMA > 200-EMA). The opposite of a Golden Cross is the "Death Cross" -- those stocks are in a bear market.
The market bias is BULLISH in the short term.
The market bias is BEARISH in the intermediate term.
The market bias is BULLISH in the long term.
All of the relevant indicators are reading above 50%. We do note some deterioration on participation, but all are above our 50% bullish threshold so the ST Bias must be listed a BULLISH. The SCI has flattened, but remains beneath its signal line so our IT Bias is listed as BEARISH. The GCI has also flattened, but remains above its signal line so the LT Bias is BULLISH.
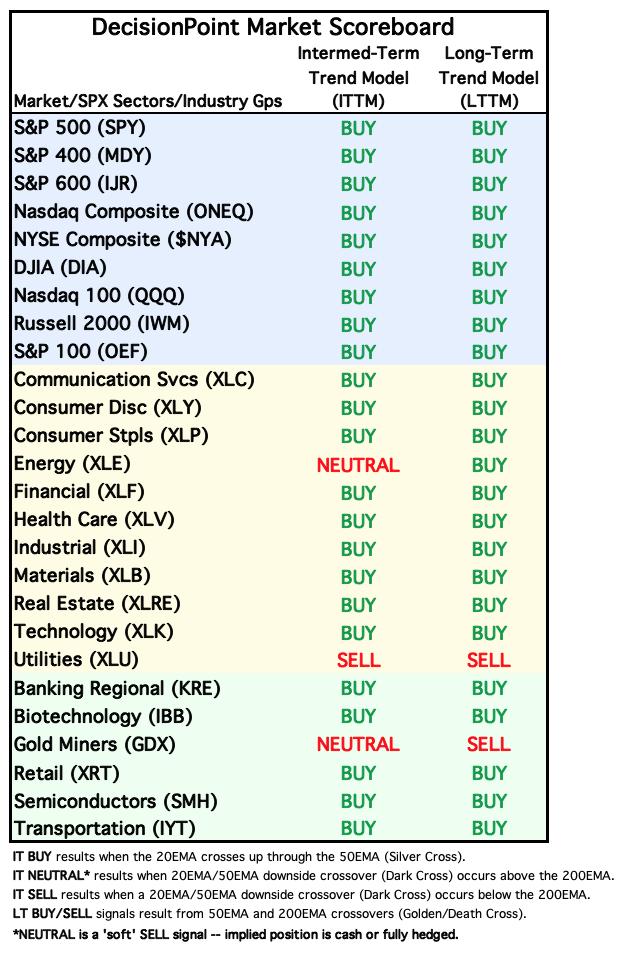
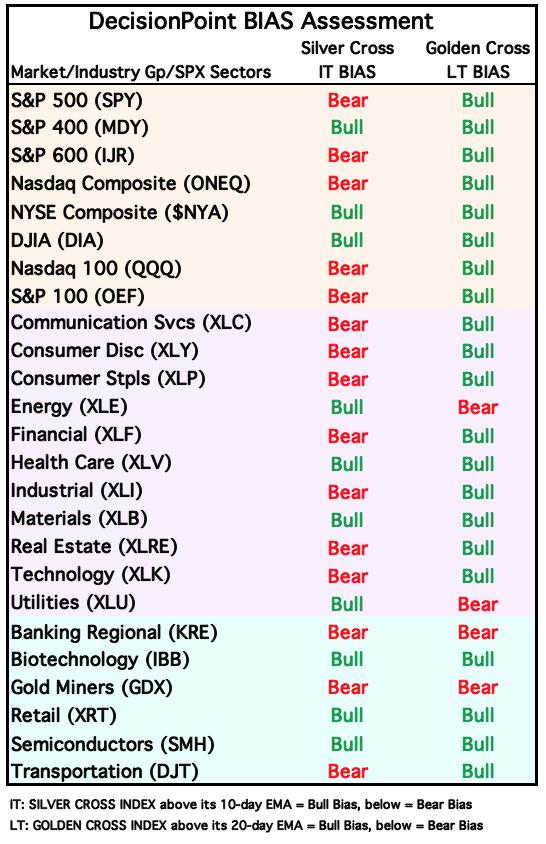
BIAS Assessment: The following table expresses the current BIAS of various price indexes based upon the relationship of the Silver Cross Index to its 10-day EMA (intermediate-term), and of the Golden Cross Index to its 20-day EMA (long-term). When the Index is above the EMA it is bullish, and it is bearish when the Index is below the EMA. The BIAS does not imply that any particular action should be taken. It is information to be used in the decision process.
The items with highlighted borders indicate that the BIAS changed today.
**************************************************************************************
CONCLUSION: We saw a bearish filled black candlestick on Friday and that was followed by a bearish decline today. The market seems to be ready to exhale. The past five times the market has exhaled, it didn't result in a meaningful decline. The STOs and now falling ITVM do hint that this time could see a more deliberate decline. However, participation numbers are high enough to support further upside which is why we have a bullish ST Bias. We expect to see more decline, but we have some economic reports on the horizon this week that could goose the market if it is determined that inflation is easing. If not, the decline will likely begin in earnest. We would continue to apply stops for protection. You may want to tighten them.
Erin is 70% long, 0% short.
**************************************************************************************
Have you subscribed the DecisionPoint Diamonds yet? DP does the work for you by providing handpicked stocks/ETFs from exclusive DP scans! Add it with a discount! Contact support@decisionpoint.com for more information!
BITCOIN
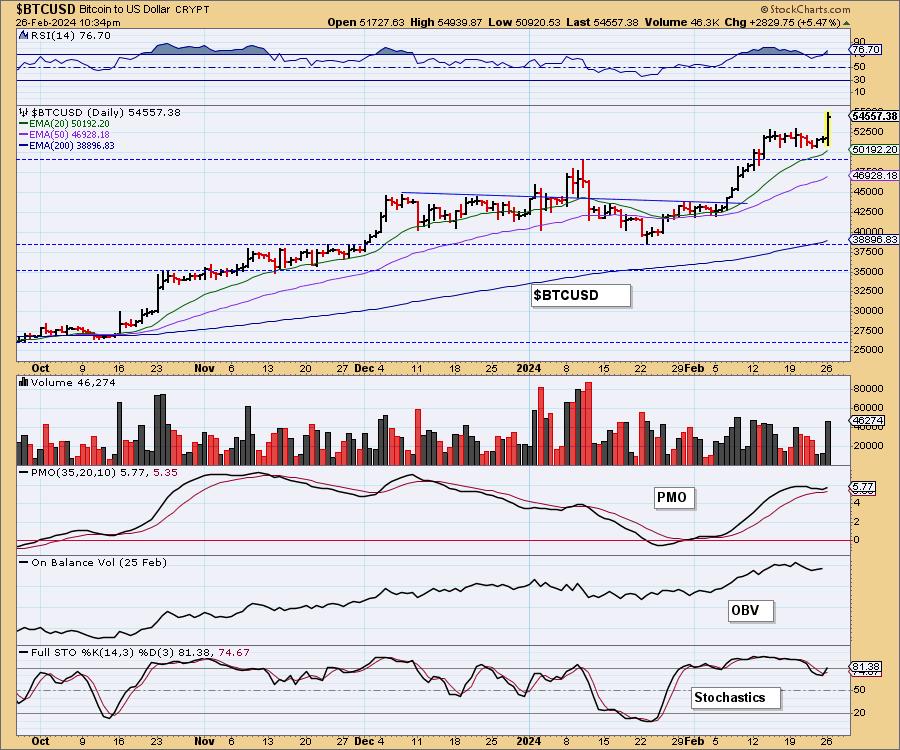
Bitcoin appears to finally be executing the bull flag chart pattern with this breakout. The PMO has now surged above the signal line (bottomed above the signal line), well above the zero line. Stochastics have pushed back above 80. The RSI is back to overbought territory, but as we know, overbought conditions generally aren't a problem for Bitcoin. The bull flag suggests we could see a move above 60,000.
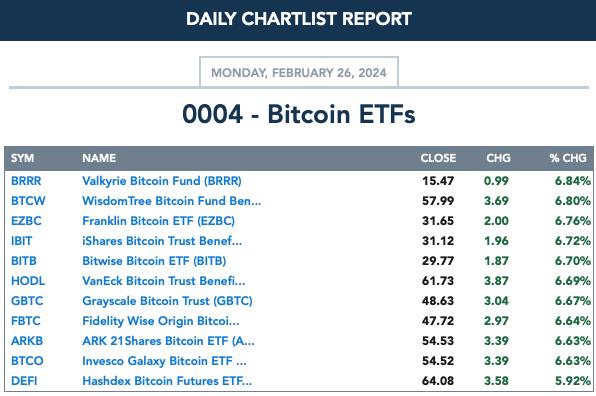
BITCOIN ETFs
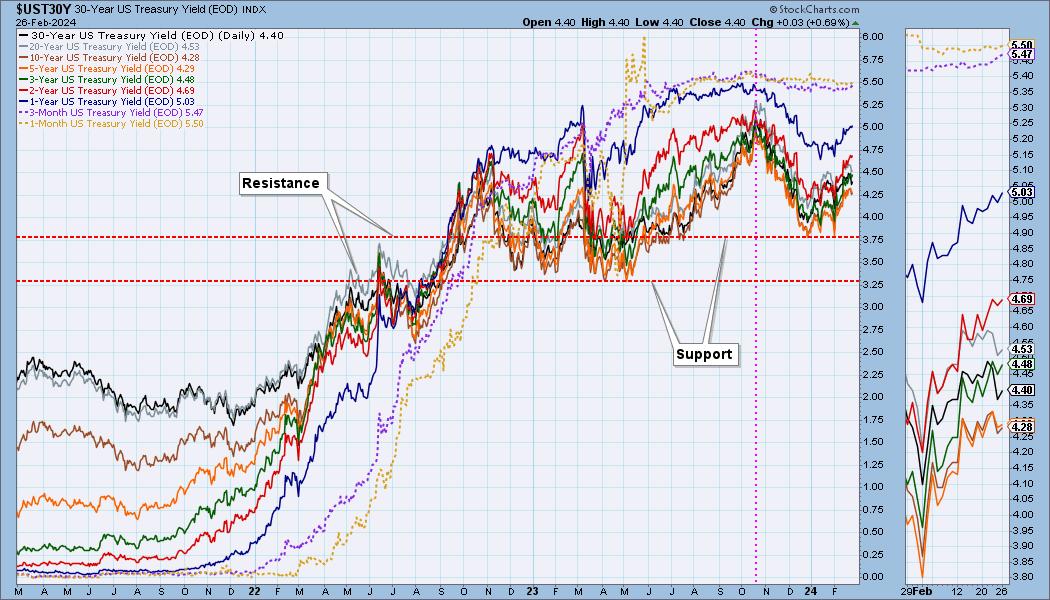
INTEREST RATES
Rates are in rising trends that aren't in jeopardy. We expect to see them continue higher, possibly back toward 2023 highs.
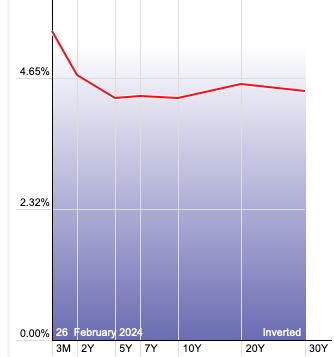
The Yield Curve Chart from StockCharts.com shows us the inversions taking place. The red line should move higher from left to right. Inversions are occurring where it moves downward.
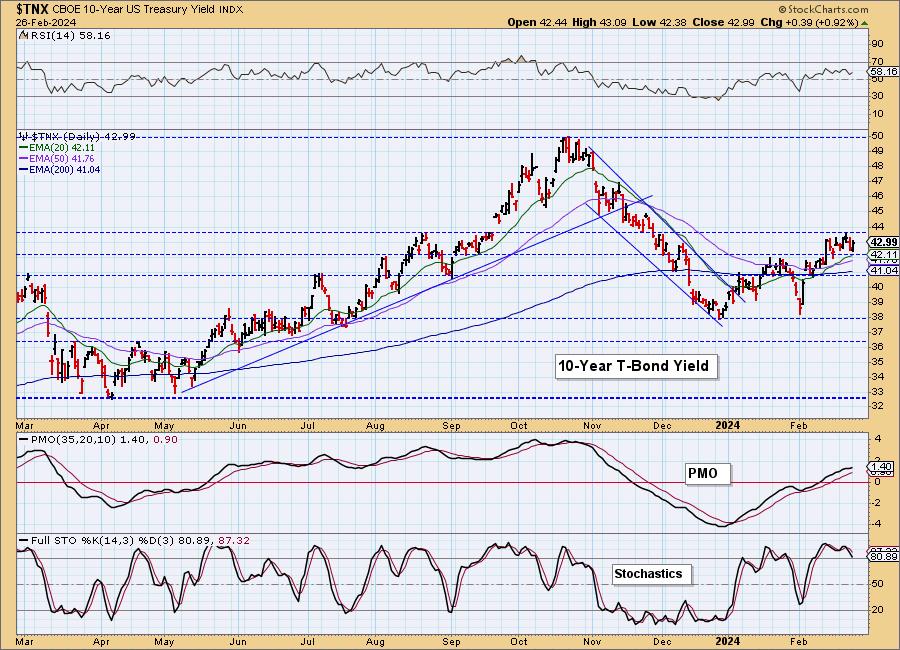
10-YEAR T-BOND YIELD
So far the 10-year yield has been stuck below overhead resistance. At the same time, it is holding short-term support. Stochastics are a bit concerning, but remain above 80. The PMO is still on the rise and $TNX is not overbought based on the RSI. We are looking for it to breakout.
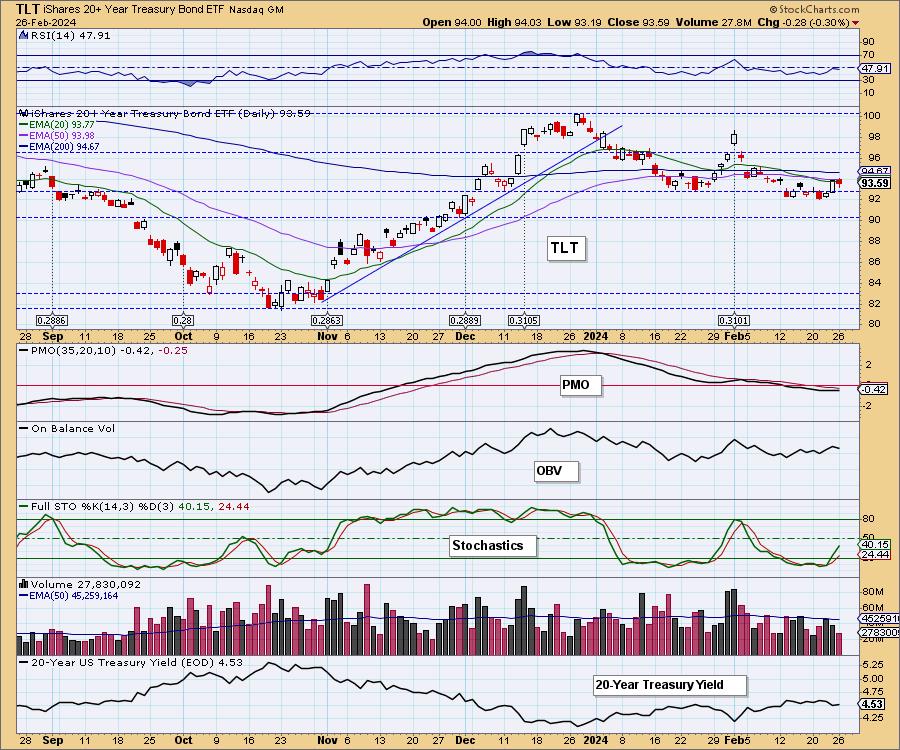
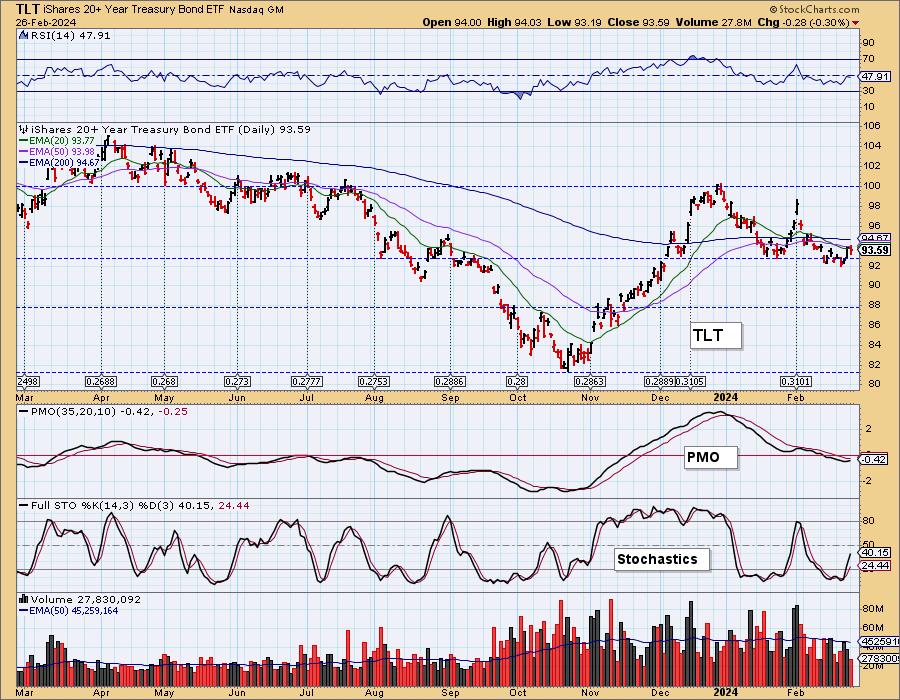
BONDS (TLT)
IT Trend Model: SELL as of 2/20/2024
LT Trend Model: SELL as of 1/19/2022
TLT Daily Chart: This looks very much like a bullish double bottom pattern forming. The pattern wouldn't be confirmed until it overcame this year's high and that seems a lot to ask from Bonds right now. Interest rates are still in rising trends. The RSI topped beneath net neutral (50) and the PMO is flat and unresponsive. Stochastics are encouraging, but overall we are not looking for much more rally. The 200-day EMA will likely be sturdy resistance.
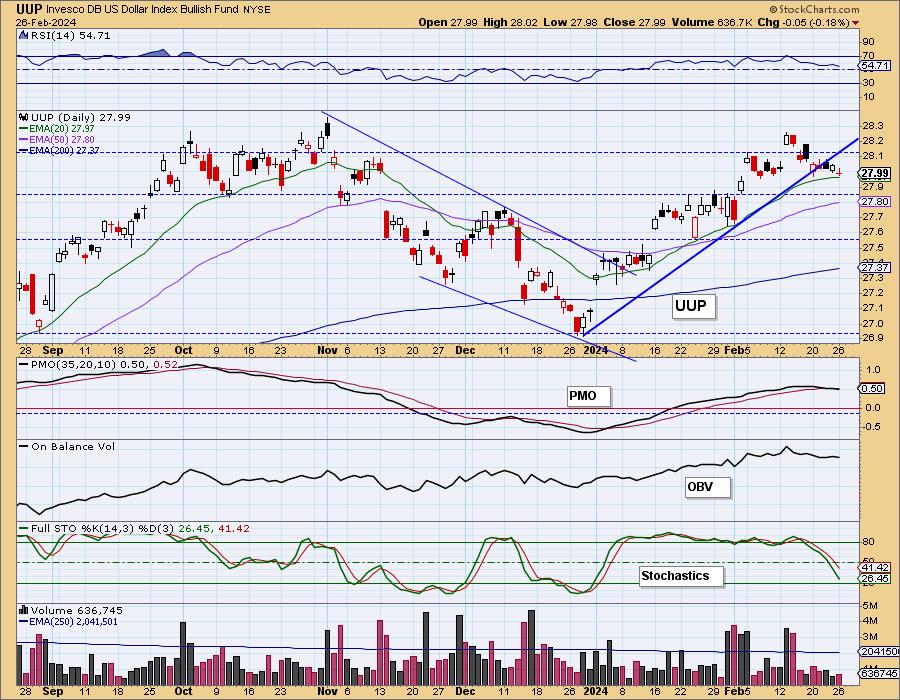
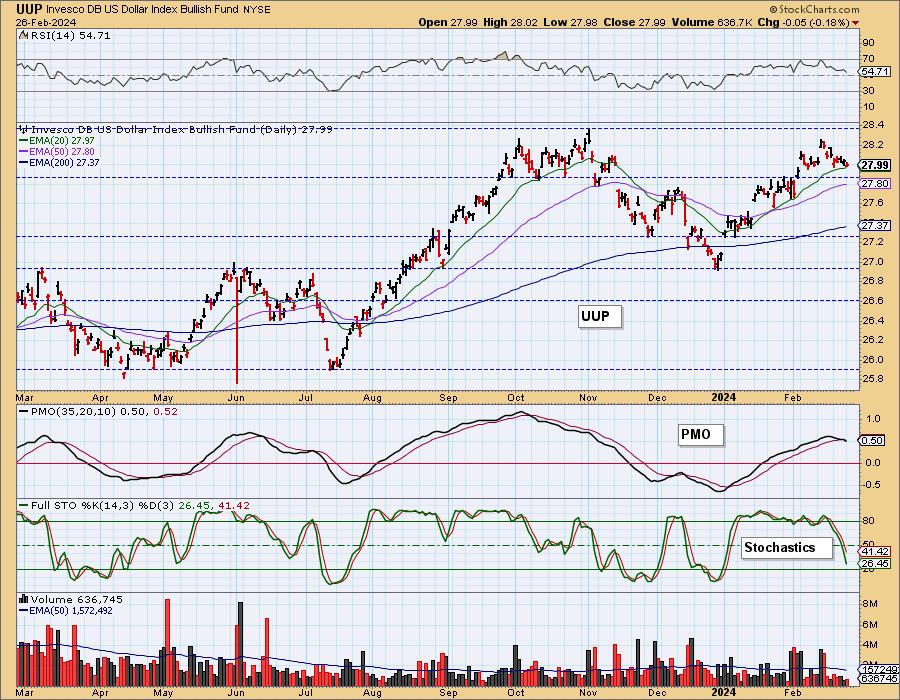
DOLLAR (UUP)
IT Trend Model: BUY as of 1/23/2024
LT Trend Model: BUY as of 5/25/2023
UUP Daily Chart: The rising trend has now been broken. At the same time, we have a new PMO Crossover SELL Signal. Stochastics look particularly bearish right now. We expect to see more decline in the Dollar.
GOLD
IT Trend Model: BUY as of 10/23/2023
LT Trend Model: BUY as of 10/20/2023
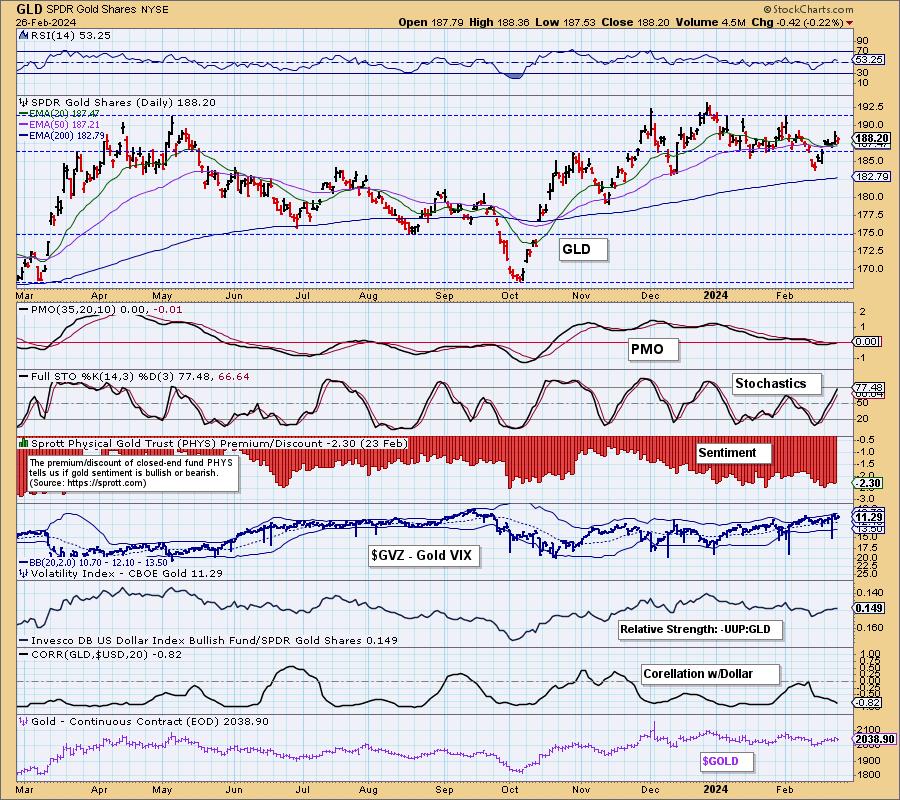
GLD Daily Chart: A weak Dollar should help Gold along. Today GLD saw a new PMO Crossover BUY Signal right on the zero line. Stochastics are rising nicely and the RSI is above net neutral (50). Gold has a real opportunity to rally here. Even discounts are elevated to levels that many times arrive at price lows for Gold.
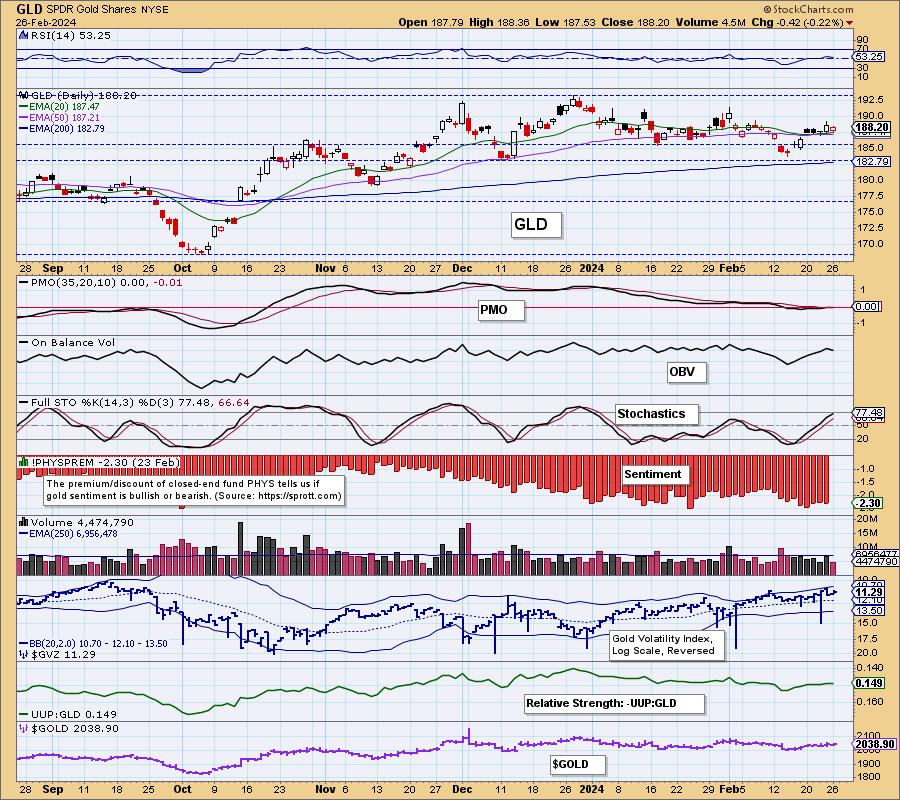
There is a rising relative strength line against the Dollar that will also work in Gold's favor. Additionally, the inverse correlation is strong right now with the Dollar.
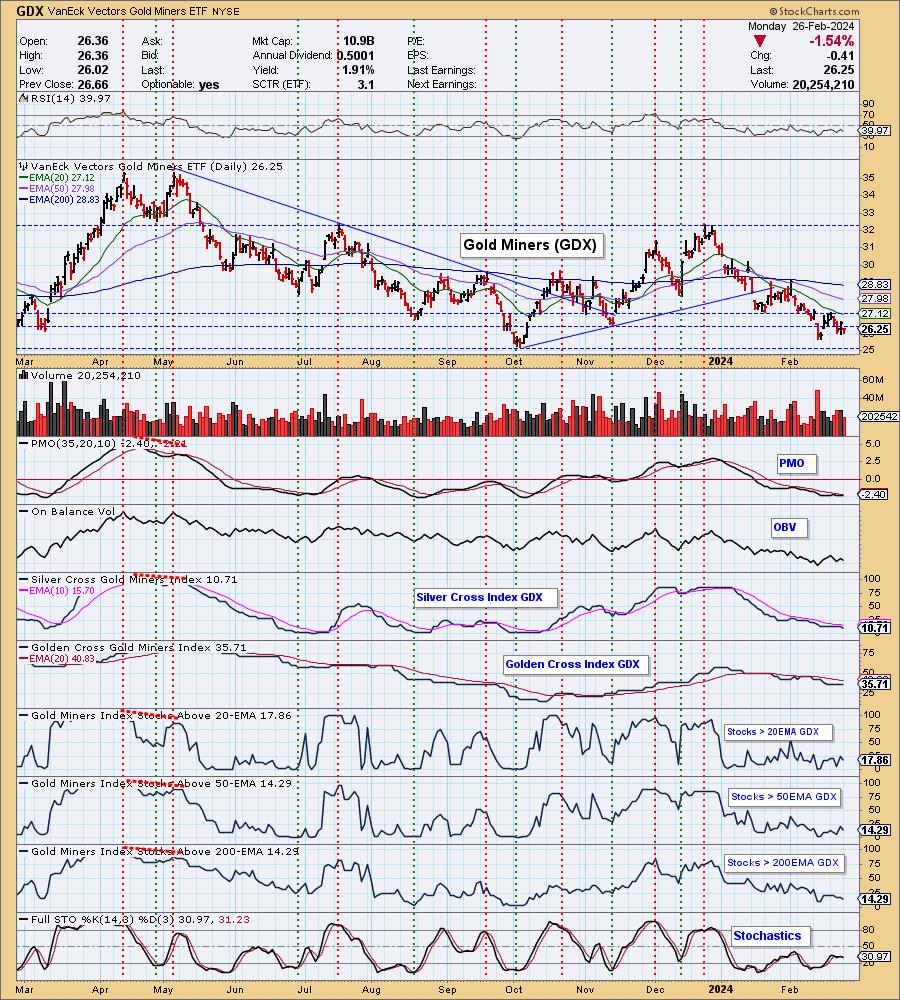
GOLD MINERS Golden and Silver Cross Indexes: We think that Gold is on its way to a rally and that makes the GDX chart more interesting. This could be a double bottom setting up. We wouldn't get too bullish however as the Silver Cross Index is tumbling lower and participation readings are still quite weak. Stochastics have topped in negative territory. This is high risk right now as we don't have a rally in Gold yet and the market as whole may be weakening.
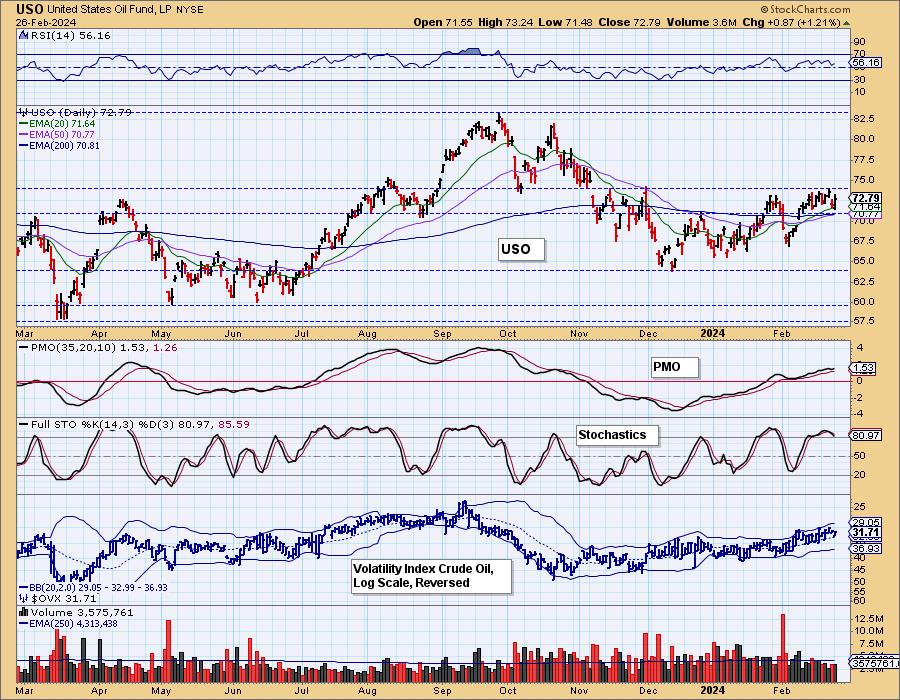
CRUDE OIL (USO)
IT Trend Model: BUY as of 2/12/2024
LT Trend Model: SELL as of 12/18/2023
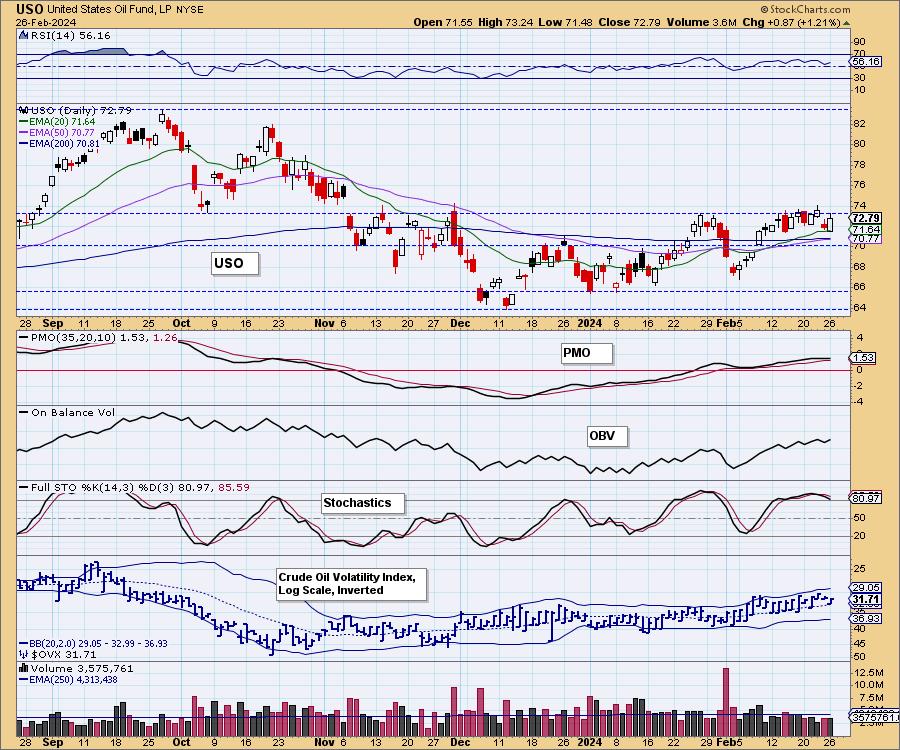
USO Daily Chart: Crude Oil rebounded today and formed a bullish engulfing candlestick that suggests we will see higher prices again tomorrow. Stochastics are a problem right now, but the PMO and RSI are still healthy. We thought we'd see a breakout here, but it admittedly is looking rather toppy. On the bright side, we are about to get a golden cross of the 50/200-day EMAs. We expect Crude will consolidate sideways with a possible breakout.
Good Luck & Good Trading!
Erin Swenlin and Carl Swenlin
Technical Analysis is a windsock, not a crystal ball. --Carl Swenlin
(c) Copyright 2024 DecisionPoint.com
Disclaimer: This blog is for educational purposes only and should not be construed as financial advice. The ideas and strategies should never be used without first assessing your own personal and financial situation, or without consulting a financial professional. Any opinions expressed herein are solely those of the author, and do not in any way represent the views or opinions of any other person or entity.
DecisionPoint is not a registered investment advisor. Investment and trading decisions are solely your responsibility. DecisionPoint newsletters, blogs or website materials should NOT be interpreted as a recommendation or solicitation to buy or sell any security or to take any specific action.
NOTE: The signal status reported herein is based upon mechanical trading model signals, specifically, the DecisionPoint Trend Model. They define the implied bias of the price index based upon moving average relationships, but they do not necessarily call for a specific action. They are information flags that should prompt chart review. Further, they do not call for continuous buying or selling during the life of the signal. For example, a BUY signal will probably (but not necessarily) return the best results if action is taken soon after the signal is generated. Additional opportunities for buying may be found as price zigzags higher, but the trader must look for optimum entry points. Conversely, exit points to preserve gains (or minimize losses) may be evident before the model mechanically closes the signal.
Helpful DecisionPoint Links:
DecisionPoint Alert Chart List
DecisionPoint Golden Cross/Silver Cross Index Chart List
DecisionPoint Sector Chart List
Price Momentum Oscillator (PMO)