
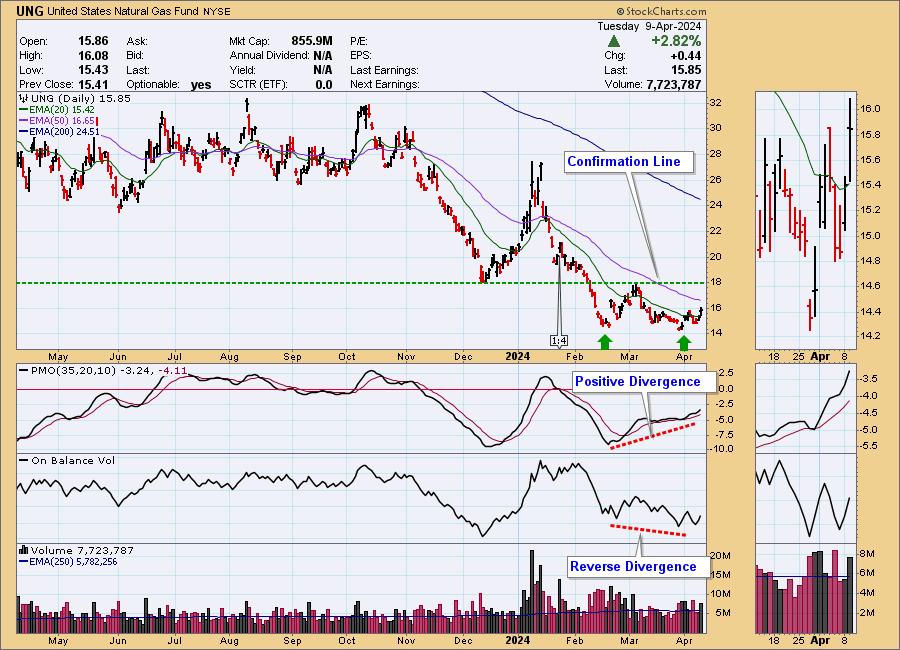
In the last two months U.S. Natural Gas Fund (UNG) has formed a double bottom, which shows promise. But before that, "the powers that be" decided that a one for four reverse split was needed. In this case shareholders would receive one share of UNG for each four shares they owned. Reverse splits happen when a stock gets too close to zero because the close proximity of zero to the price prevents the stock from going lower. The reverse split puts more space between price and zero, so that price can go lower. If a reverse split is announced on a stock you own, it is probably a good idea to sell it, contemplating at buying it again at a lower price.
Anyway, we are past the reverse split and the inevitable decline, and UNG is looking promising again. A double bottom has formed, and a new advance has begun. Accompanying the double bottom is an OBV reverse divergence. In this case OBV made a lower low while price merely matched the previous price low. This is positive because it tells us that strong downside volume was unable to drag price down. Very bullish.
There is also a PMO positive divergence. Also bullish.
Almost immediately after gapping up and rallying off the second bottom there was a viscious pullback to fill the gap, and a short-term rising trend has begun. The confirmation line is four points above the lows, which gives us a minimum upside objective of about 22. No promises. This article is for information purposes, and is not a recommendation to buy.
The DecisionPoint Alert Weekly Wrap presents an end-of-week assessment of the trend and condition of the Stock Market, the U.S. Dollar, Gold, Crude Oil, and Bonds. The DecisionPoint Alert daily report (Monday through Thursday) is abbreviated and gives updates on the Weekly Wrap assessments.
Watch the latest episode of DecisionPoint on our YouTube channel here!
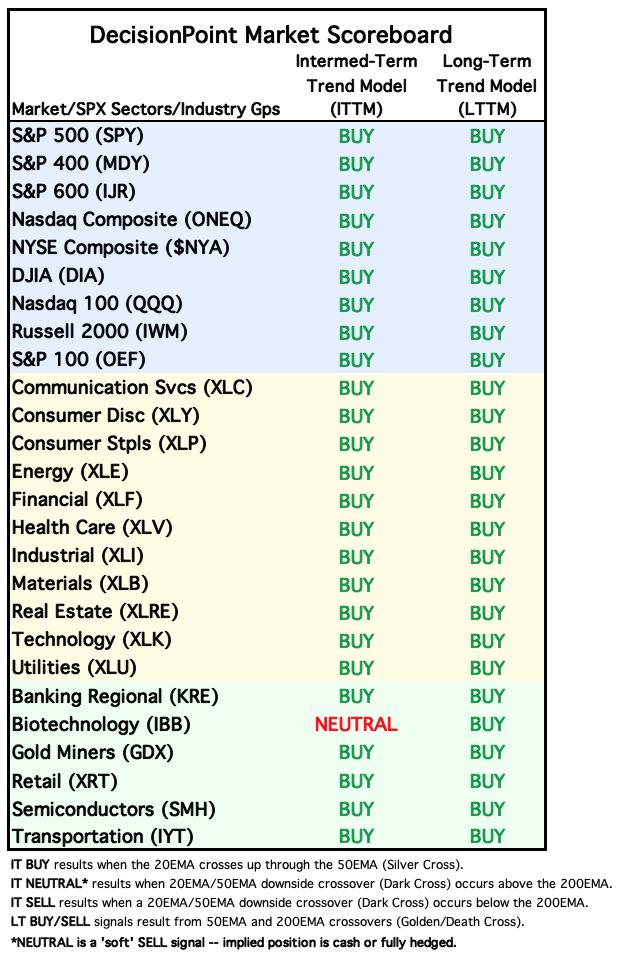
MARKET/INDUSTRY GROUP/SECTOR INDEXES
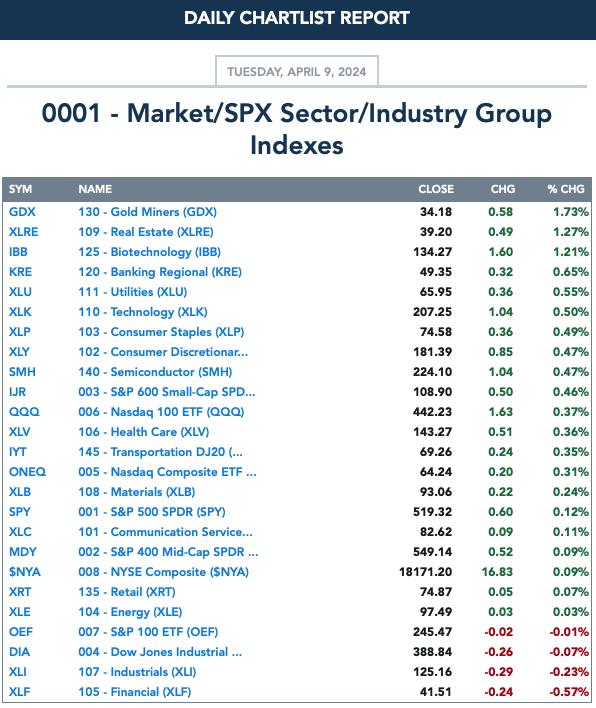
CLICK HERE for Carl's annotated Market Index, Sector, and Industry Group charts.
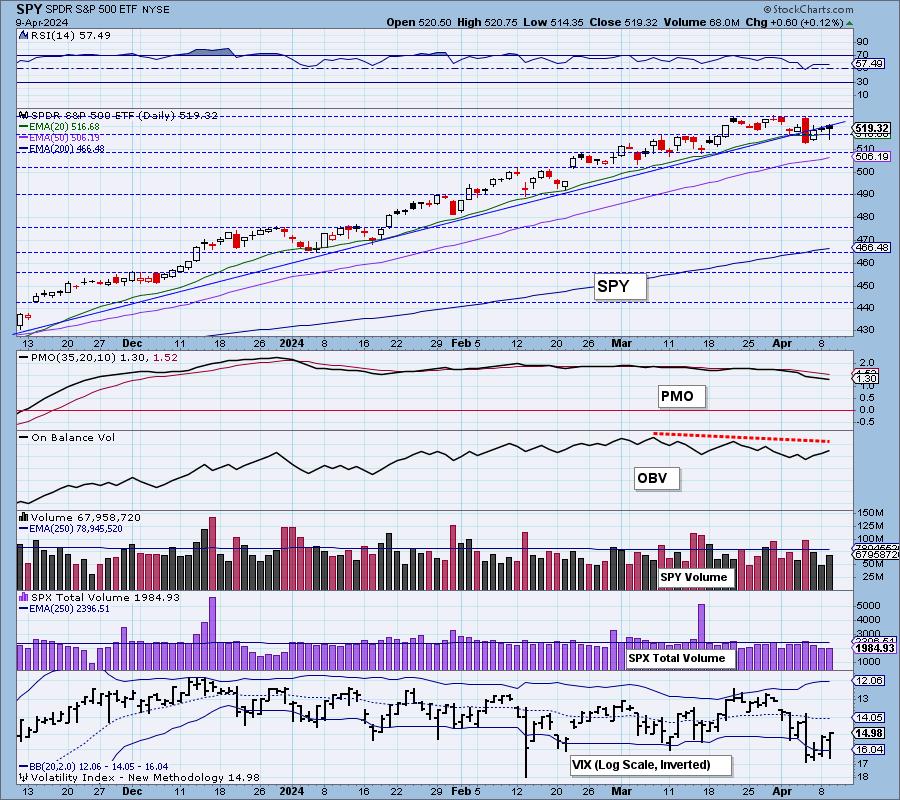
THE MARKET (S&P 500)
IT Trend Model: BUY as of 11/14/2023
LT Trend Model: BUY as of 3/29/2023
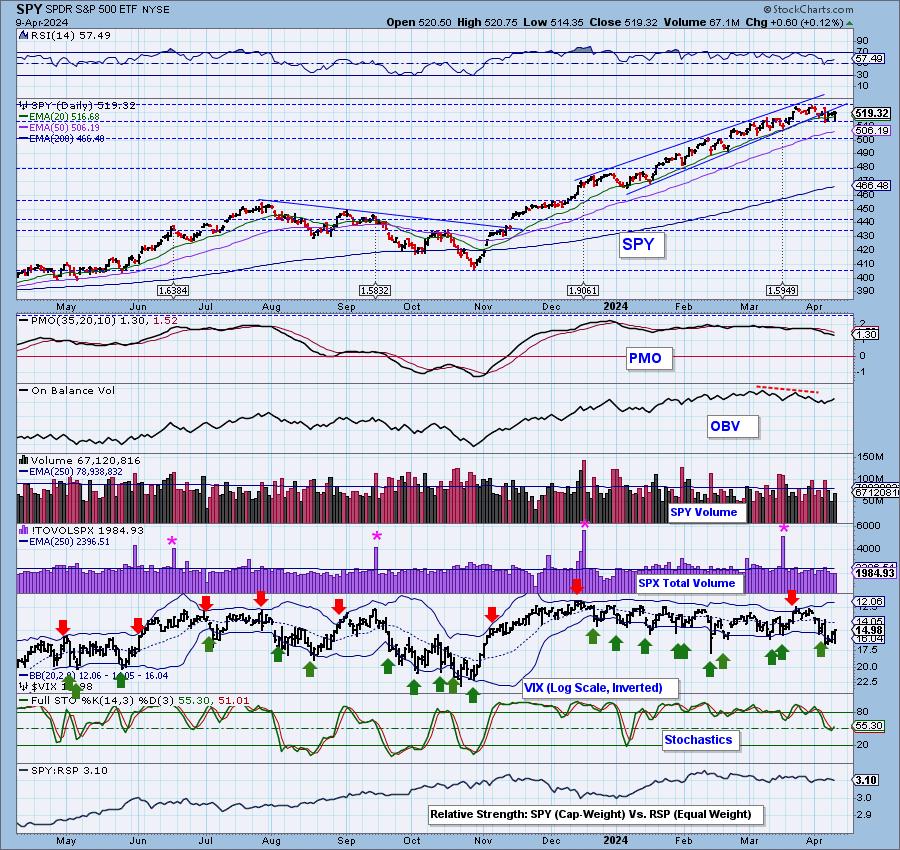
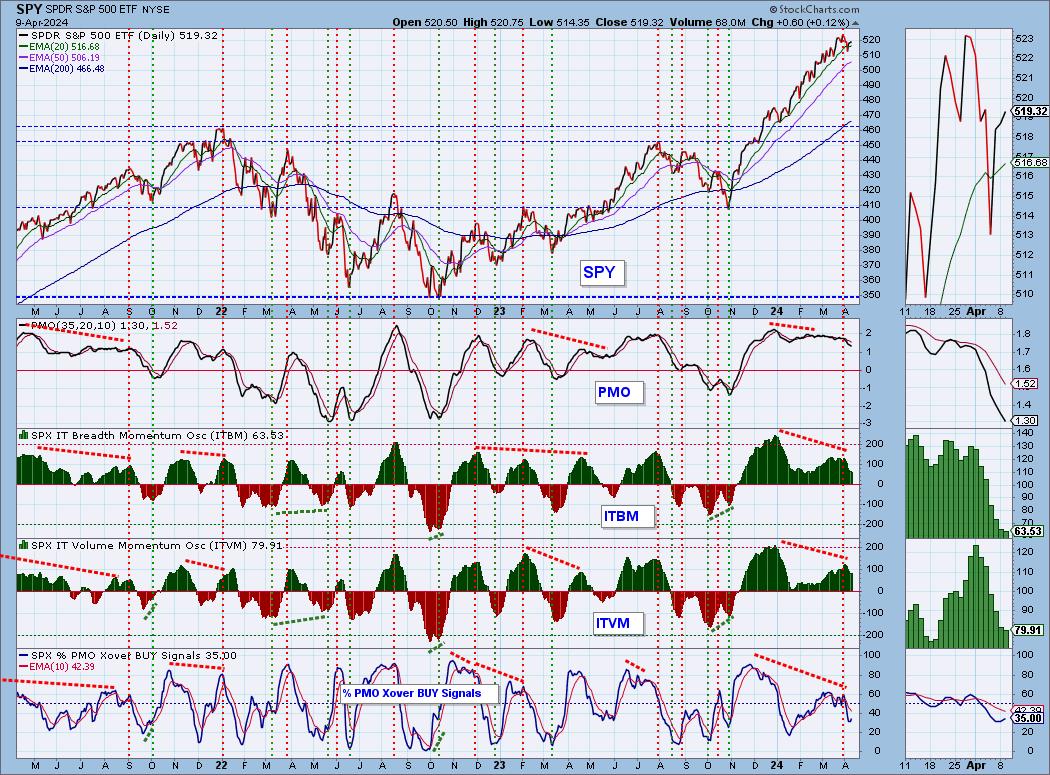
SPY Daily Chart: For three days SPY has been hugging the bottom of the rising trend line, but most relevant, it remains in a narrow trading range and is about one percent below all-time highs.

Here is the latest recording:
S&P 500 New 52-Week Highs/Lows: New Highs contracted slightly, and the trend of New Highs is down.
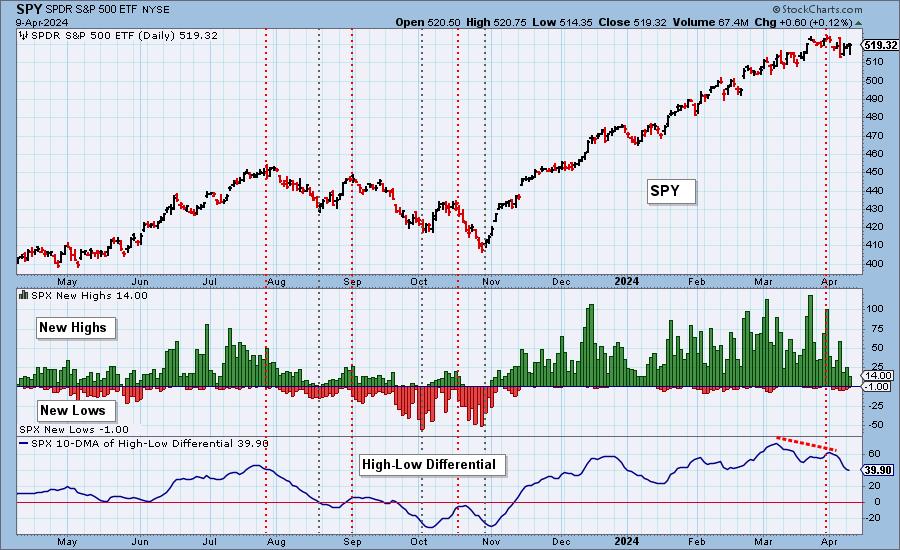
Climax* Analysis: There were no climax readings today.
*A climax is a one-day event when market action generates very high readings in, primarily, breadth and volume indicators. We also include the VIX, watching for it to penetrate outside the Bollinger Band envelope. The vertical dotted lines mark climax days -- red for downside climaxes, and green for upside. Climaxes are at their core exhaustion events; however, at price pivots they may be initiating a change of trend.
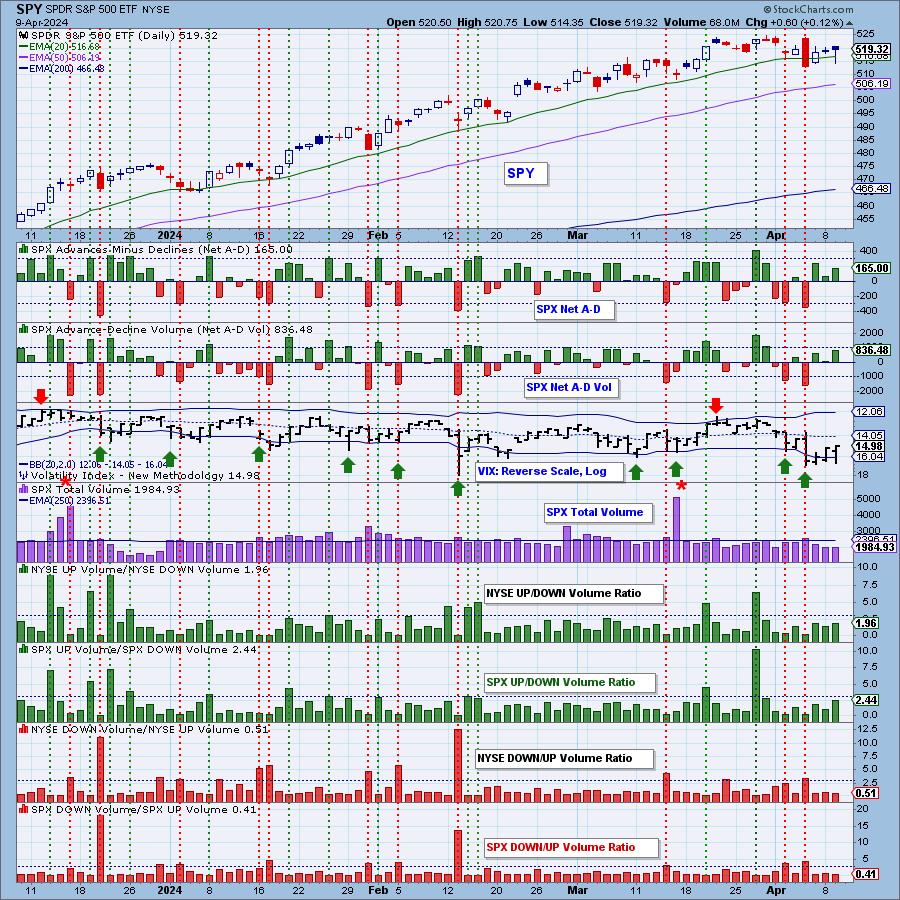
Short-Term Market Indicators: The short-term market trend is NEUTRAL and the condition is slightly NEUTRAL.
All these indicators moved higher today. There is potential for a short-term rally.
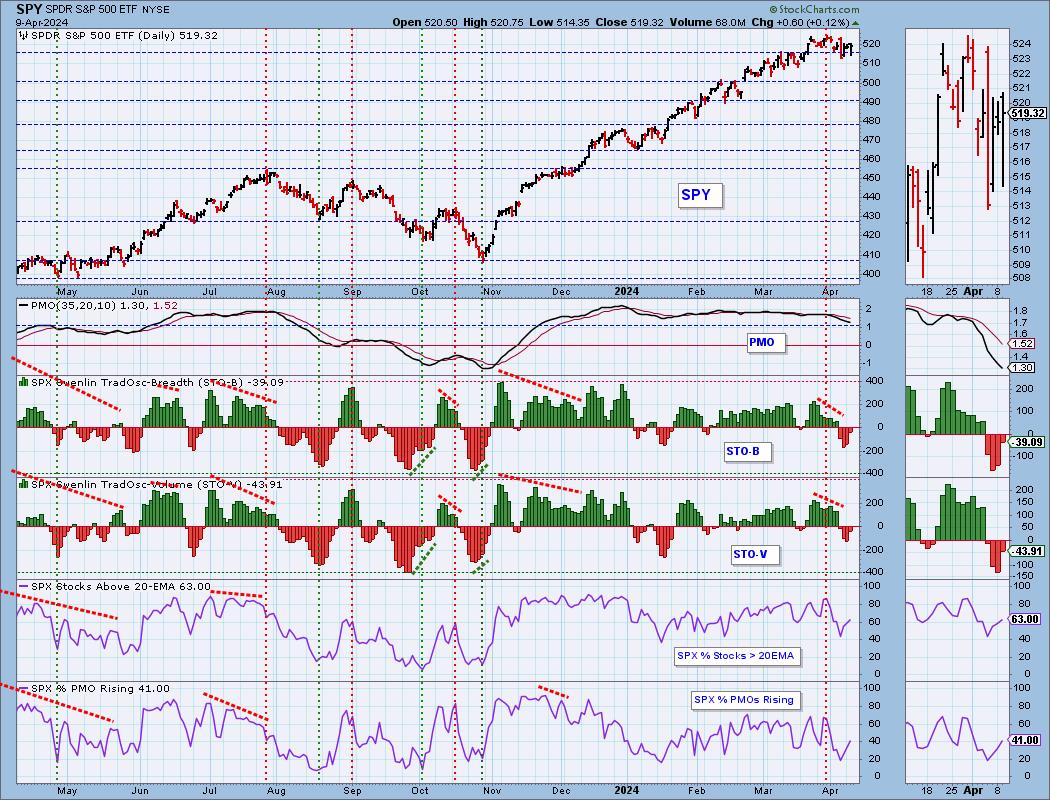
Intermediate-Term Market Indicators: The intermediate-term market trend is UP and the condition is NEUTRAL.
The ITBM and ITVM are falling but decelerating, and there is a potential for these indicators to align with the short-term indicators, making a new rally likely.
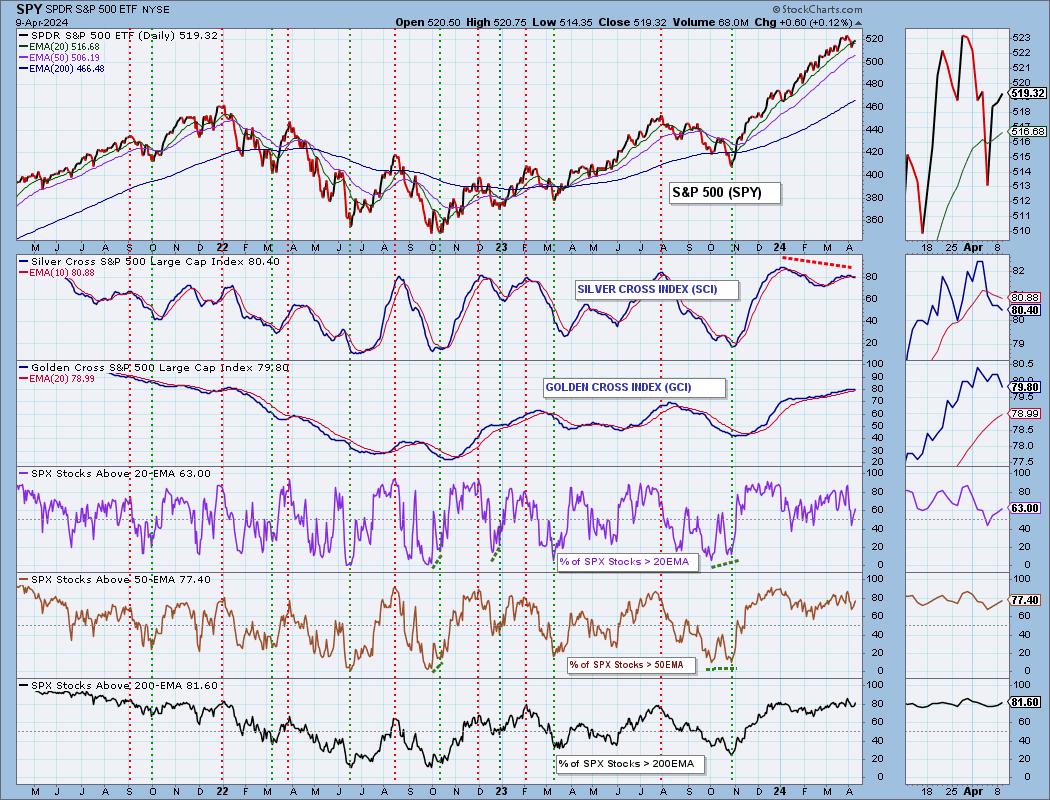
PARTICIPATION: The following chart objectively shows the depth and trend of participation in two time frames.
- Intermediate-Term - the Silver Cross Index (SCI) shows the percentage of SPX stocks on IT Trend Model BUY signals (20-EMA > 50-EMA). The opposite of the Silver Cross is a "Dark Cross" -- those stocks are, at the very least, in a correction.
- Long-Term - the Golden Cross Index (GCI) shows the percentage of SPX stocks on LT Trend Model BUY signals (50-EMA > 200-EMA). The opposite of a Golden Cross is the "Death Cross" -- those stocks are in a bear market.
The Silver Cross Index (SCI) is below its 10-day EMA, so even though the SCI is at a bullish 80%, its bias has shifted to bearish. Participation implies that the SCI will likely drop to 77%.
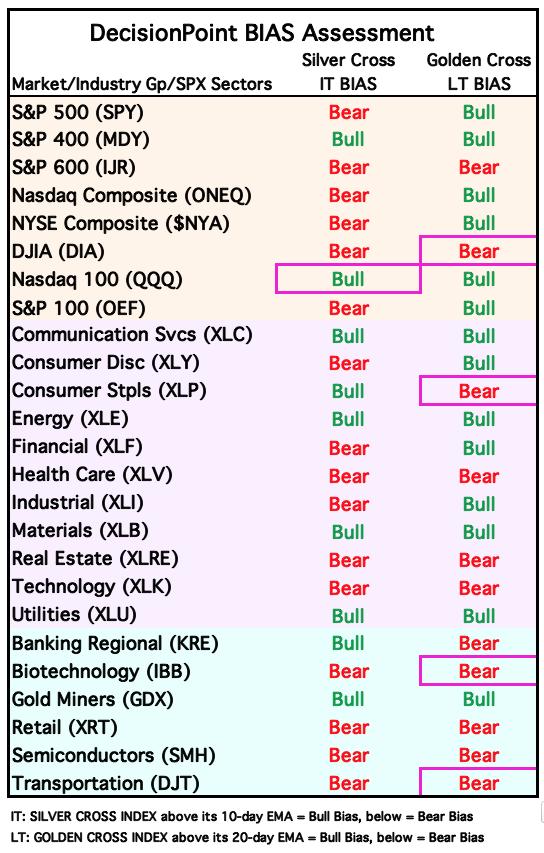
BIAS Assessment: The following table expresses the current BIAS of various price indexes based upon the relationship of the Silver Cross Index to its 10-day EMA (intermediate-term), and of the Golden Cross Index to its 20-day EMA (long-term). When the Index is above the EMA it is bullish, and it is bearish when the Index is below the EMA. The BIAS does not imply that any particular action should be taken. It is information to be used in the decision process.
The items with highlighted borders indicate that the BIAS changed today.
**************************************************************************************
CONCLUSION: SPY remains about one percent below all-time highs and in a very tight trading range. Short-term indicators are rising, so there is the potential for a rally in that time frame. Intermediate-term indicators are neutral and in a negative configuration, but they are showing a potential to bottom. We can't count the bull out.
Erin is 75% long, 0% short.
**************************************************************************************
Have you subscribed the DecisionPoint Diamonds yet? DP does the work for you by providing handpicked stocks/ETFs from exclusive DP scans! Add it with a discount! Contact support@decisionpoint.com for more information!
BITCOIN
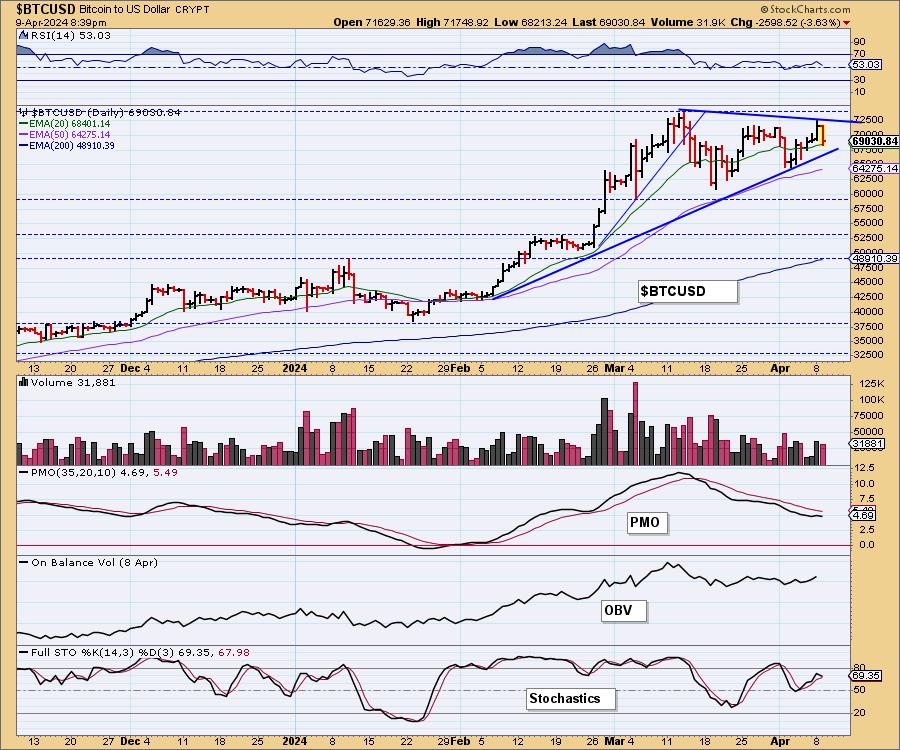
Bitcoin is having trouble breaking out of the triangle formation.
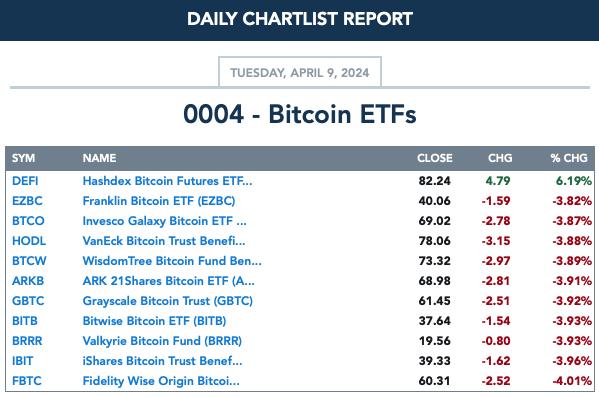
BITCOIN ETFs
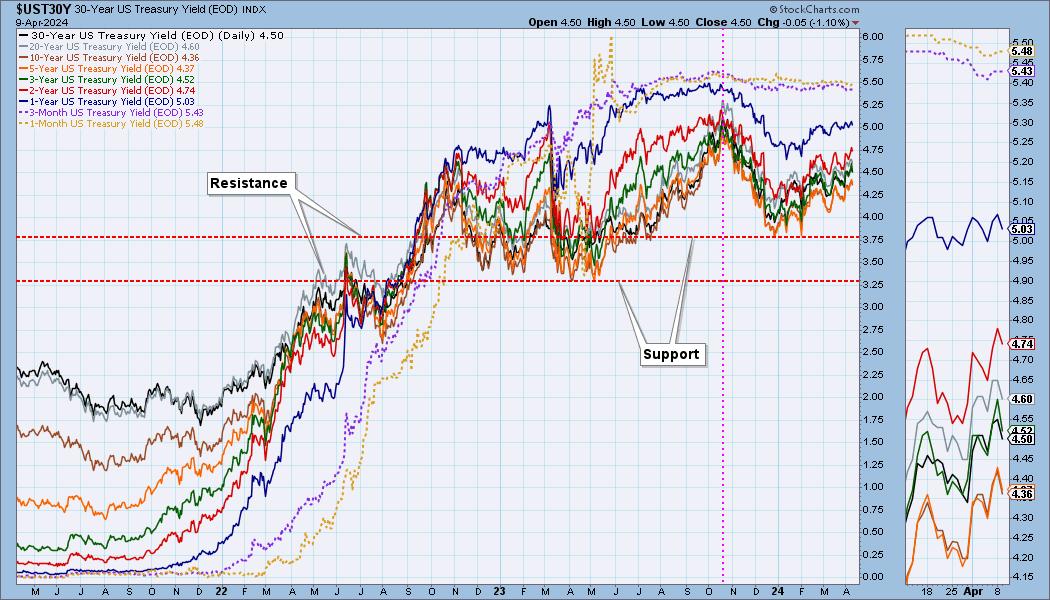
INTEREST RATES
Yields are rising within the range set during the last 18 months or so. We are currently expecting that range to hold for several months, or until the Fed does something.
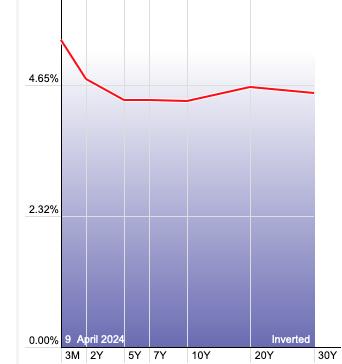
The Yield Curve Chart from StockCharts.com shows us the inversions taking place. The red line should move higher from left to right. Inversions are occurring where it moves downward.
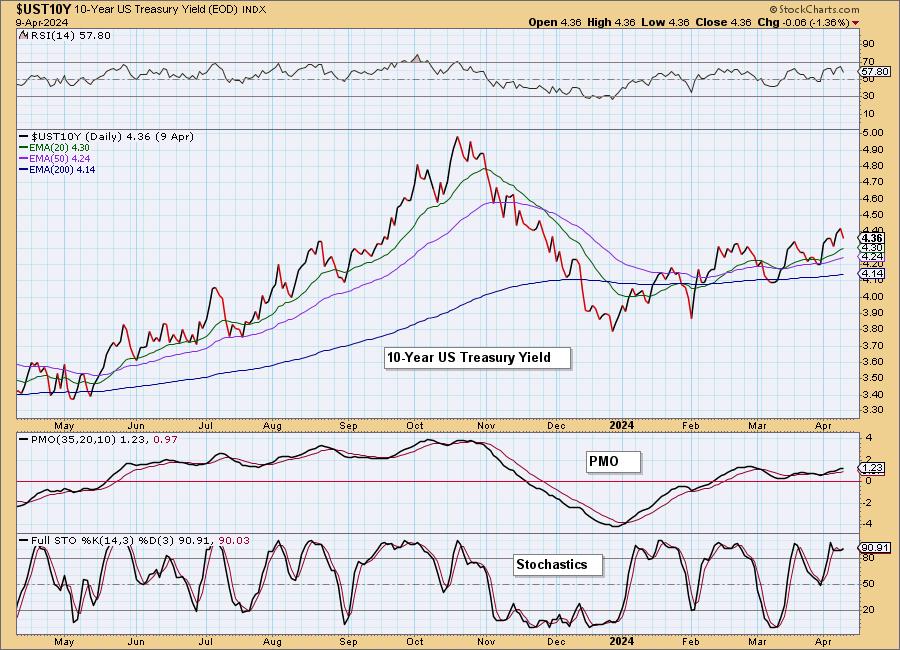
10-YEAR T-BOND YIELD
The bearish rising wedge implies that $TNX will eventually start down and move out of the wedge, but currently it is moving toward the top of the wedge.
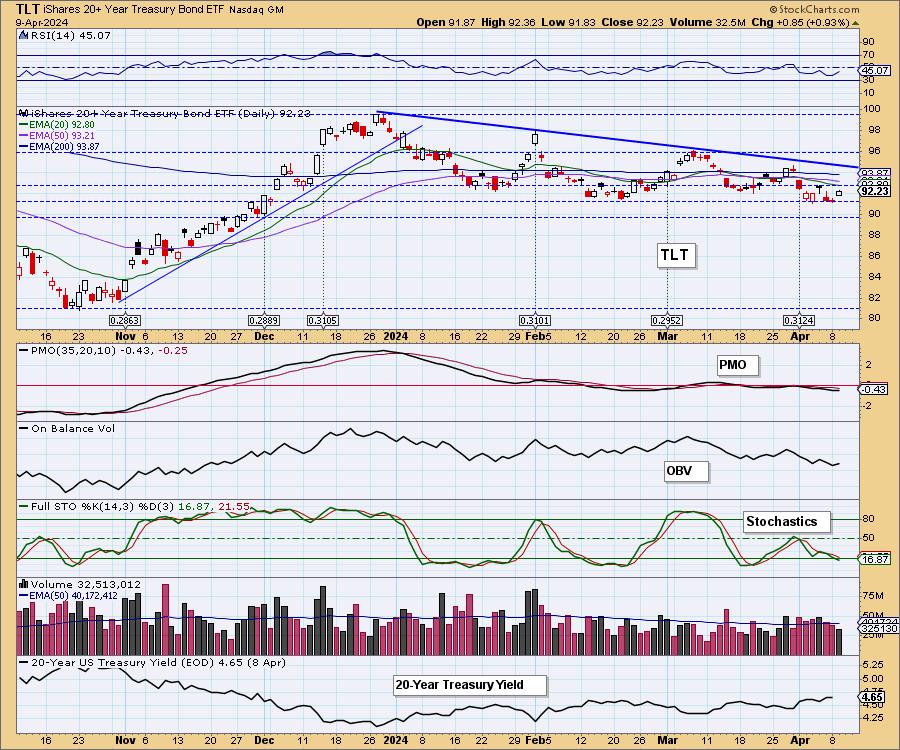
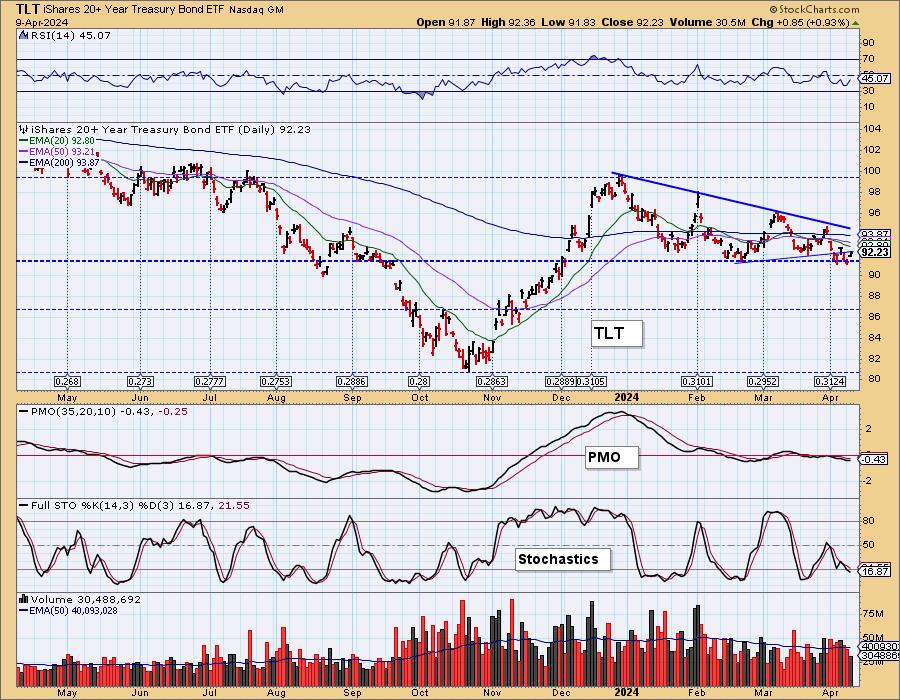
BONDS (TLT)
IT Trend Model: SELL as of 3/20/2024
LT Trend Model: SELL as of 1/19/2022
TLT Daily Chart: For the last six trading days TLT has remained within a very narrow range.
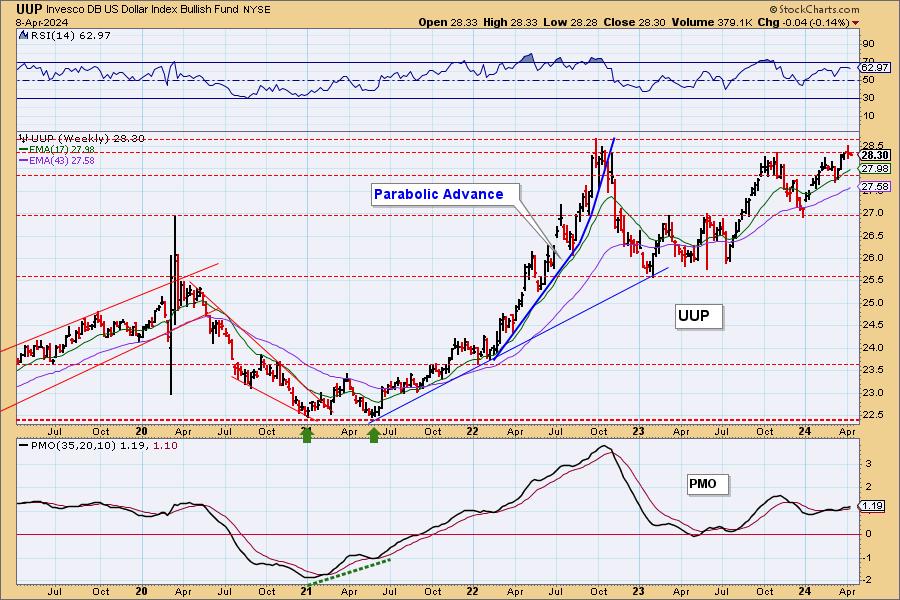
DOLLAR (UUP)
IT Trend Model: BUY as of 1/23/2024
LT Trend Model: BUY as of 5/25/2023
UUP Daily Chart: The bearish rising wedge continues.
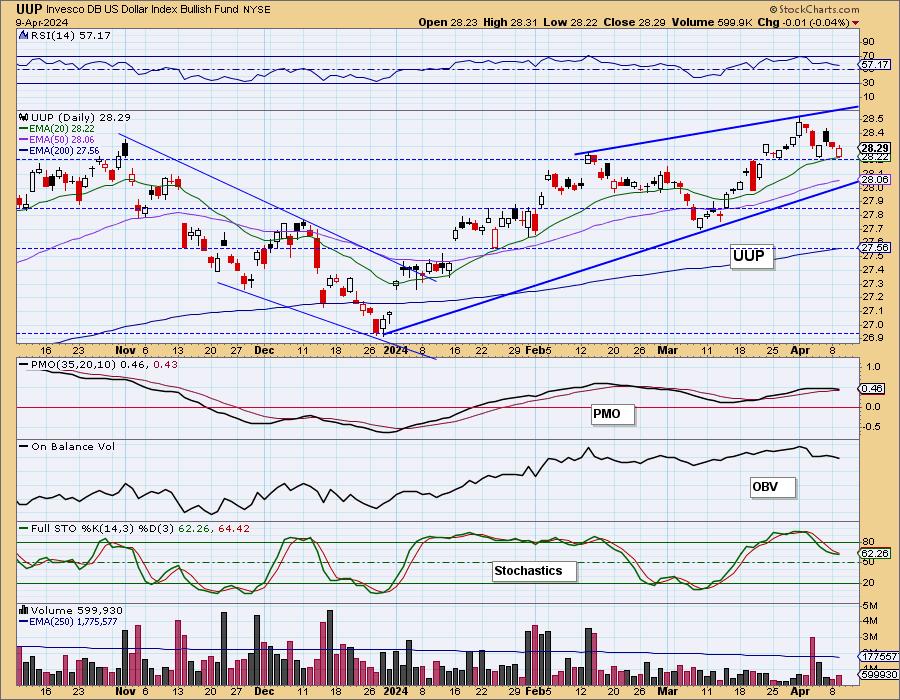
Approaching the overhead resistance line drawn across the 2022 high.
GOLD
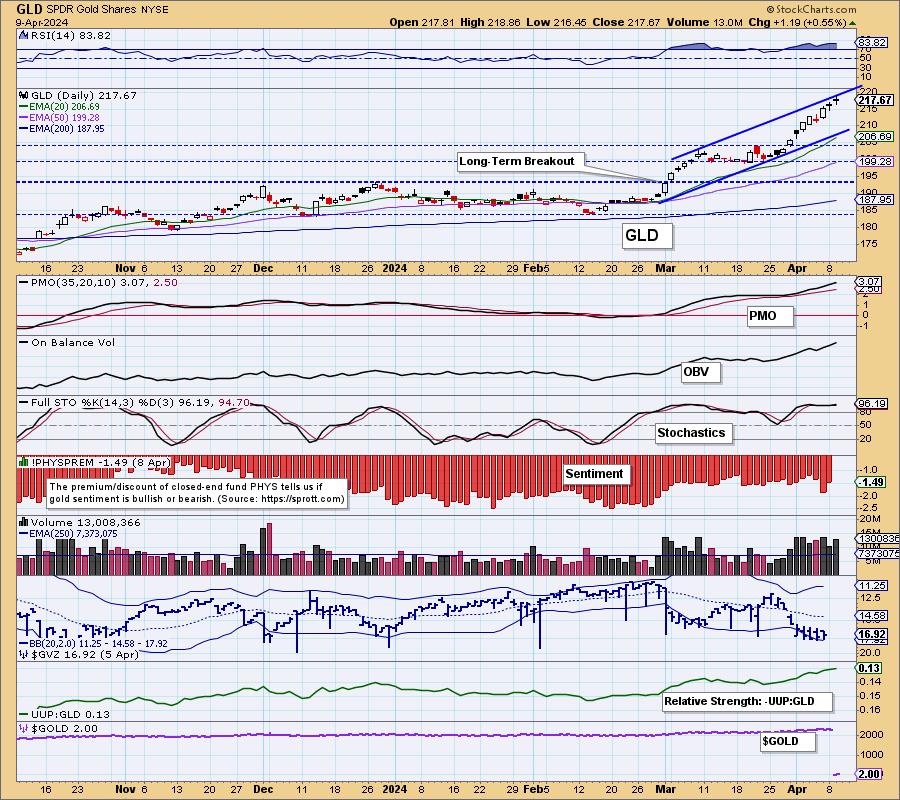
IT Trend Model: BUY as of 10/23/2023
LT Trend Model: BUY as of 10/20/2023
GLD Daily Chart: GLD has reached the top of its rising trend channel, so it is reasonable to expect some corrective action in the short term. Note that in March the correction was a sideways move.
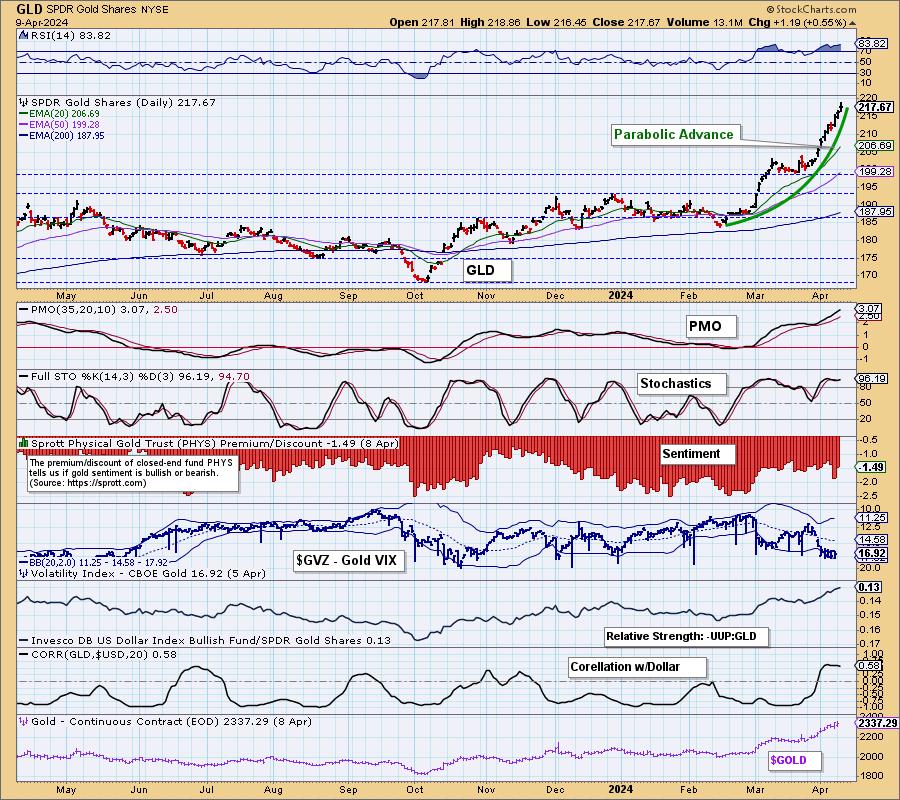
GOLD Daily Chart: The one-year chart shows how steep the advance has been, going parabolic in the last two months. A correction would be healthy.
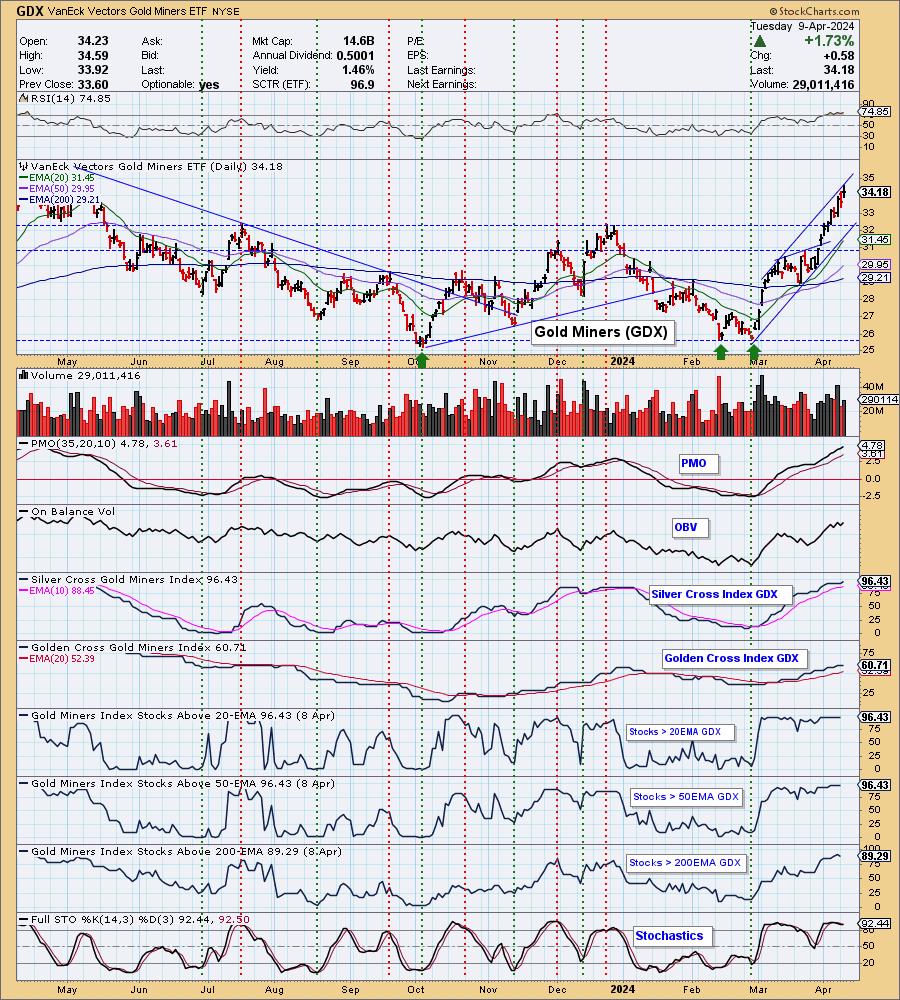
GOLD MINERS Golden and Silver Cross Indexes: Participation for Gold Miners is excellent, with all indexes being in the 90s, but like GLD, GDX has reached the top of the rising trend channel, so a trip back to the bottom of the channel is likely. Fortunately, there will be support on the rising trend line and the horizontal support line.
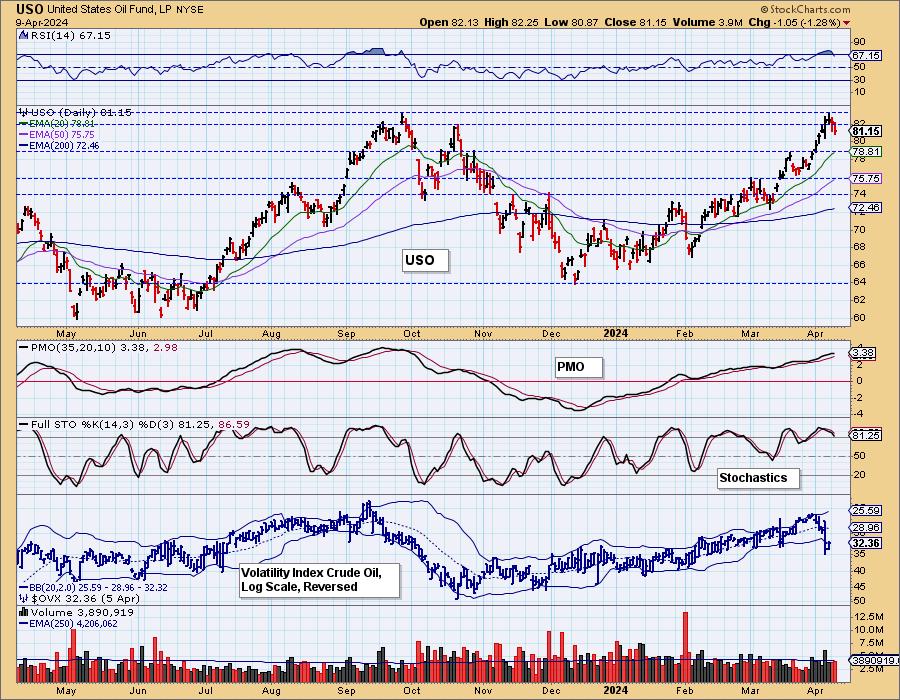
CRUDE OIL (USO)
IT Trend Model: BUY as of 2/12/2024
LT Trend Model: BUY as of 2/27/2024
USO Daily Chart: USO corrected slightly more deeply today, but no serious damage was done.
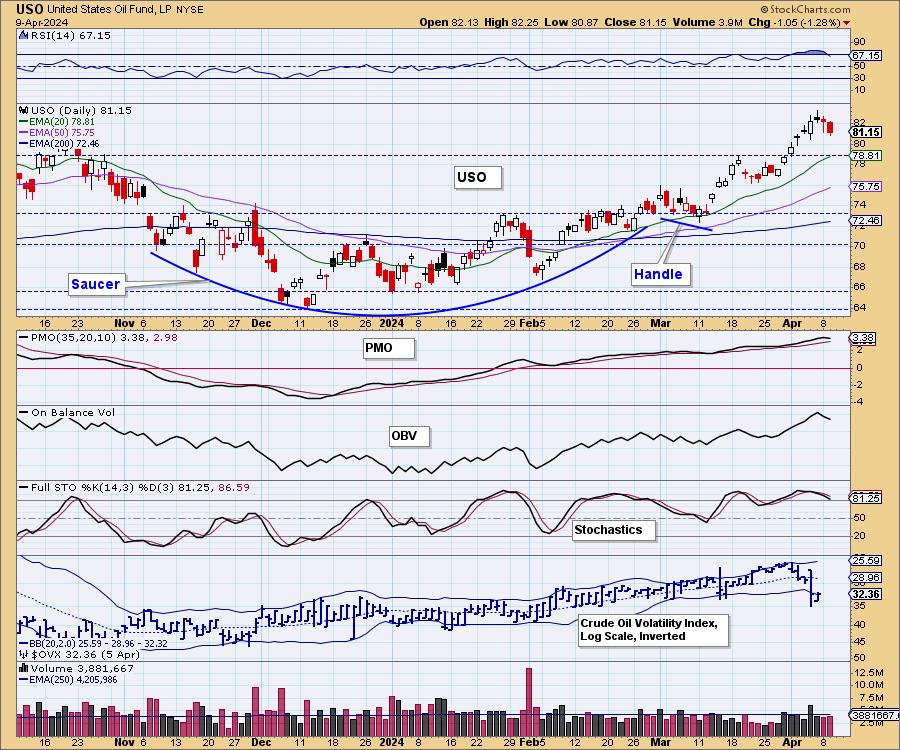
On Friday USO was stopped by the resistance line drawn across the September top. The last two days has broken a very steep angle of ascent, which was necessary to avoid more serious problems.
Good Luck & Good Trading!
Erin Swenlin and Carl Swenlin
Technical Analysis is a windsock, not a crystal ball. --Carl Swenlin
(c) Copyright 2024 DecisionPoint.com
Disclaimer: This blog is for educational purposes only and should not be construed as financial advice. The ideas and strategies should never be used without first assessing your own personal and financial situation, or without consulting a financial professional. Any opinions expressed herein are solely those of the author, and do not in any way represent the views or opinions of any other person or entity.
DecisionPoint is not a registered investment advisor. Investment and trading decisions are solely your responsibility. DecisionPoint newsletters, blogs or website materials should NOT be interpreted as a recommendation or solicitation to buy or sell any security or to take any specific action.
NOTE: The signal status reported herein is based upon mechanical trading model signals, specifically, the DecisionPoint Trend Model. They define the implied bias of the price index based upon moving average relationships, but they do not necessarily call for a specific action. They are information flags that should prompt chart review. Further, they do not call for continuous buying or selling during the life of the signal. For example, a BUY signal will probably (but not necessarily) return the best results if action is taken soon after the signal is generated. Additional opportunities for buying may be found as price zigzags higher, but the trader must look for optimum entry points. Conversely, exit points to preserve gains (or minimize losses) may be evident before the model mechanically closes the signal.
Helpful DecisionPoint Links:
DecisionPoint Alert Chart List
DecisionPoint Golden Cross/Silver Cross Index Chart List
DecisionPoint Sector Chart List
Price Momentum Oscillator (PMO)