
Sentiment indicators are contrarian, meaning that when the majority of investors are bullish on a market, it is bearish for that market. Most investors are aware of several sentiment indicators that relate to the stock market, but they may not be aware that there is a sentiment indicator for gold derived from the closed-end fund, Sprott Physical Gold Trust (PHYS).
Let's quickly review how mutual funds work. An open-end fund processes contributions and redemptions while the market is open. After the market closes, it calculates the net asset value (NAV) per share. Closed-end funds normally do not process new contributions and redemptions. Rather, their assets are fixed and they trade on the stock market like stocks. Because of this, their price can be bid higher or lower throughout the market day, and they can sell at a premium or discount against their NAV.
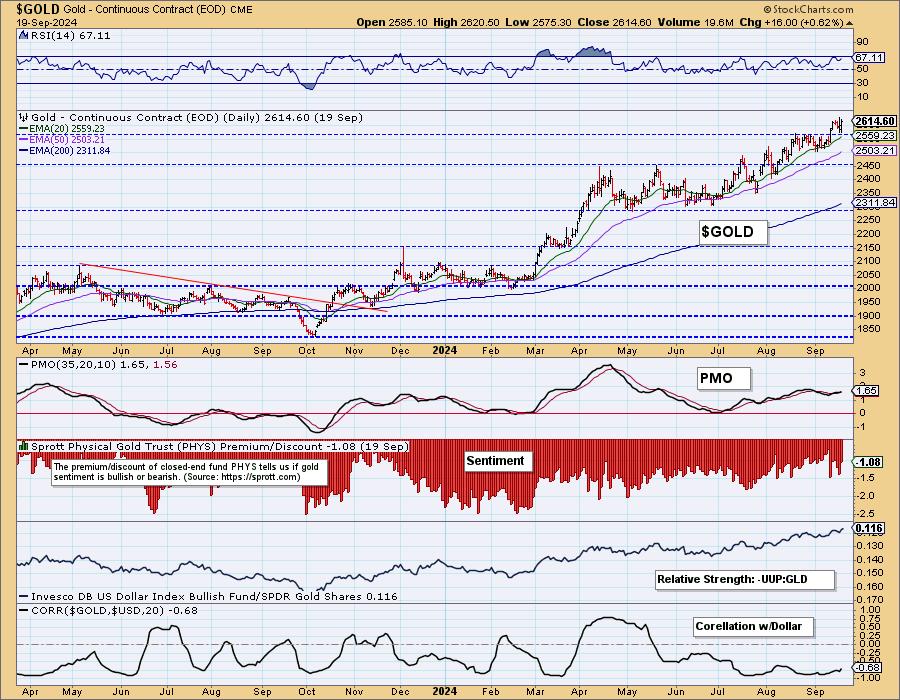
On the daily chart below, we can see sentiment panel, which shows that PHYS has been selling at a discount for at least a year. This means that investors are still reluctant to buy gold (bearish) even though gold has been making new all-time highs. This is clearly bullish for gold.
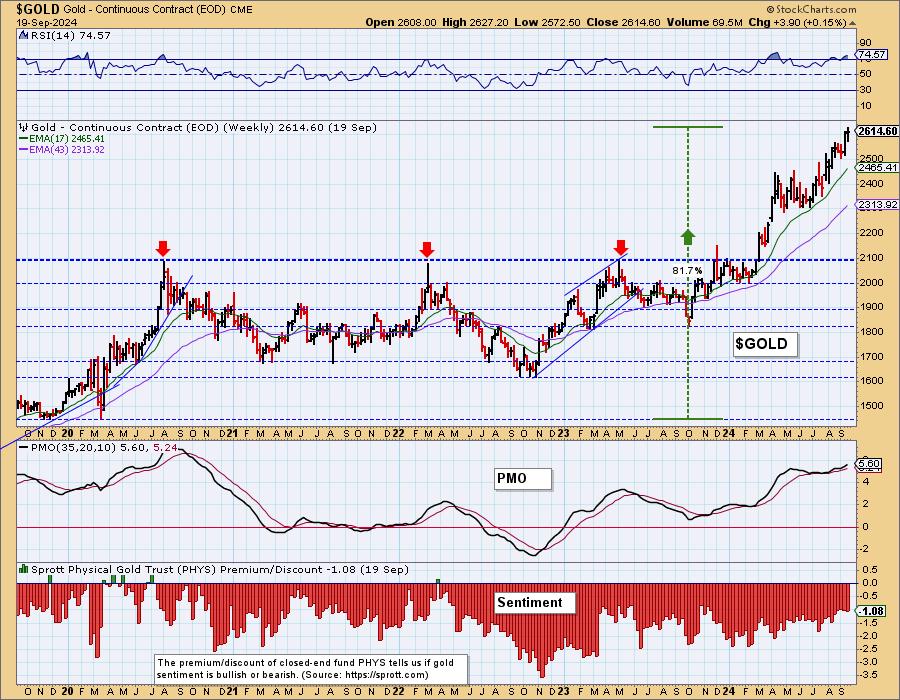
On the weekly chart, we see that gold was selling at a small premium (green bars) a handful of times in the five years shown. Otherwise, it sold at a discount, while price advanced +82% during the period shown.
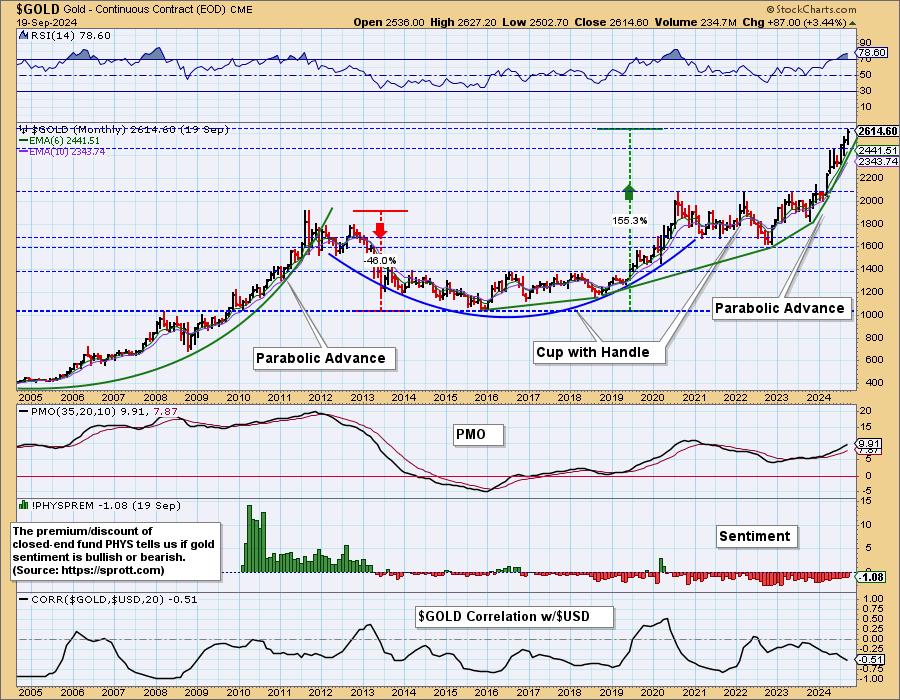
On the monthly chart, we can see that during the parabolic advance from 2005 to 2011, the gold held by PHYSwas selling at premium of about +14% in 2010, which is nuts. It continued selling at a premium for almost two years after the 2011 top, and it ultimately declined -46%.
The takeaway: Sentiment indicators are not precise timing tools, but, in this case, premium/discount analysis is an excellent method for assessing when investors in the gold market are too bullish or bearish.
Introducing the New Scan Alert System!
Delivered to your email box at the end of the market day. You'll get the results of our proprietary scans that Erin uses to pick her "Diamonds in the Rough" for the DecisionPoint Diamonds Report. Get all of the results and see which ones you like best! Only $29/month! Or, use our free trial to try it out for two weeks using coupon code: DPTRIAL2. Click HERE to subscribe NOW!
Learn more about DecisionPoint.com:
Watch the latest episode of the DecisionPointTrading Room on DP's YouTube channel here!

Try us out for two weeks with a trial subscription!
Use coupon code: DPTRIAL2 Subscribe HERE!
Technical Analysis is a windsock, not a crystal ball. --Carl Swenlin
(c) Copyright 2024 DecisionPoint.com
Disclaimer: This blog is for educational purposes only and should not be construed as financial advice. The ideas and strategies should never be used without first assessing your own personal and financial situation, or without consulting a financial professional. Any opinions expressed herein are solely those of the author, and do not in any way represent the views or opinions of any other person or entity.
DecisionPoint is not a registered investment advisor. Investment and trading decisions are solely your responsibility. DecisionPoint newsletters, blogs or website materials should NOT be interpreted as a recommendation or solicitation to buy or sell any security or to take any specific action.
Helpful DecisionPoint Links:
Price Momentum Oscillator (PMO)
Swenlin Trading Oscillators (STO-B and STO-V)