
The results today were mixed and not very plentiful. I always expect this because the ETF universe is so much smaller than the entire market universe. Still, I was able to find three interesting selections.
I included an inverse Bond ETF (TYO) as I see rates rising in the future and Bonds taking a backseat. Also, I decided to include the inverse ETF of the Cathie Wood ARKK fund (SARK). Typically a rising rate environment puts pressure on Technology stocks.
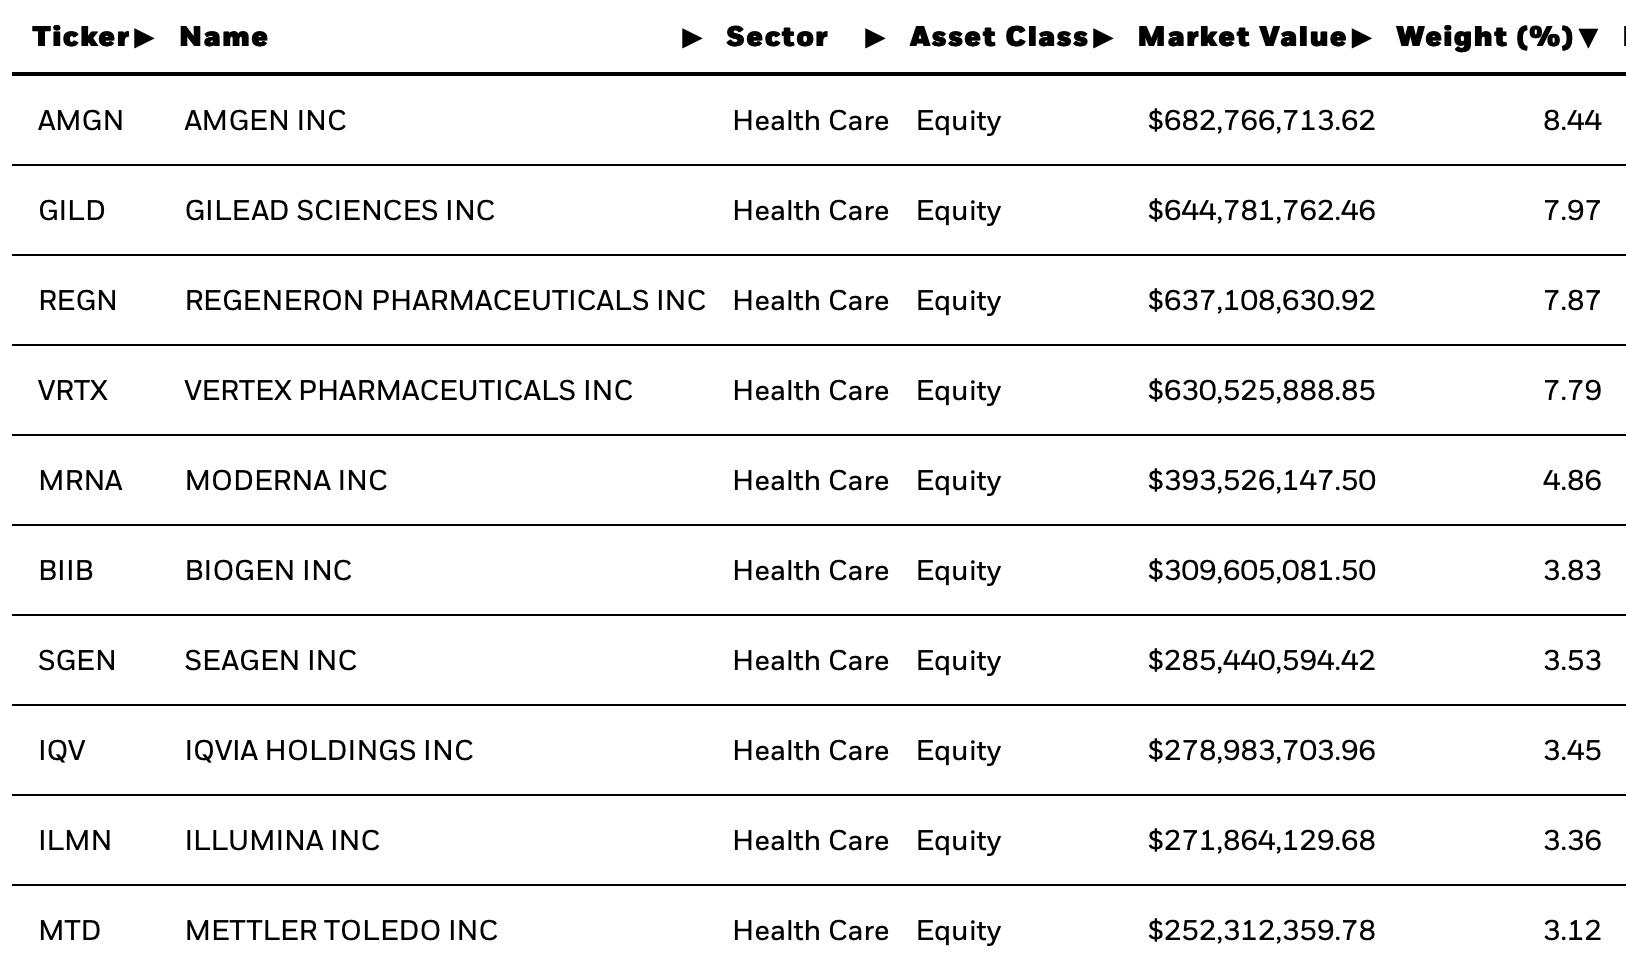
The final ETF is not surprising if you've been watching trading rooms and reading my commentary. I like the Healthcare Sector (XLV) and one lucrative group within is Biotechnology. If you aren't interested in the volatility of individual Biotechs, I have the Biotech ETF (IBB). While this ETF can see volatility too, it generally is less than many of the stocks.
Tomorrow is Reader Request Day! Send me an email to erin@decisionpoint.com if you want your symbol covered. I can't cover them all. If I don't cover yours, I generally will send a quick email with some quick analysis for one of your requests.
Good Luck & Good Trading,
Erin
Today's "Diamonds in the Rough": IBB, SARK and TYO.
Other scan results: PST, TBX, XHB, CGGR, PCY and TUR.

RECORDING LINK (4/7/2023):
Topic: DecisionPoint Diamond Mine (4/7/2023) LIVE Trading Room
Passcode: April#7th
REGISTRATION for 4/14/2023:
When: Apr 14, 2023 09:00 AM Pacific Time (US and Canada)
Topic: DecisionPoint Diamond Mine (4/14/2023) LIVE Trading Room
Register in advance for this webinar HERE.
After registering, you will receive a confirmation email containing information about joining the webinar.

Here is the last recording (4/10):
Welcome to DecisionPoint Diamonds, wherein I highlight ten "Diamonds in the Rough" per week. These are selected from the results of my DecisionPoint Scans which search for stocks that could benefit from the trend and condition of the market. Remember, these are not recommendations to buy or sell, but are the most interesting of the stocks that surfaced in my scans. My objective is to save you the work of the initial, tedious culling process, but you need to apply your own analysis to see if these stocks pique your interest as well. There are no guaranteed winners here!
"Predefined Scans Triggered" are taken from StockCharts.com using the "Symbol Summary" option instead of a "SharpChart" on the workbench.
Stop levels are all rounded down.
iShares Nasdaq Biotechnology ETF (IBB)
EARNINGS: N/A
IBB tracks the performance of a modified market-cap-weighted index of US biotechnology companies listed on US exchanges. For more information click HERE.
Predefined Scans Triggered: None.
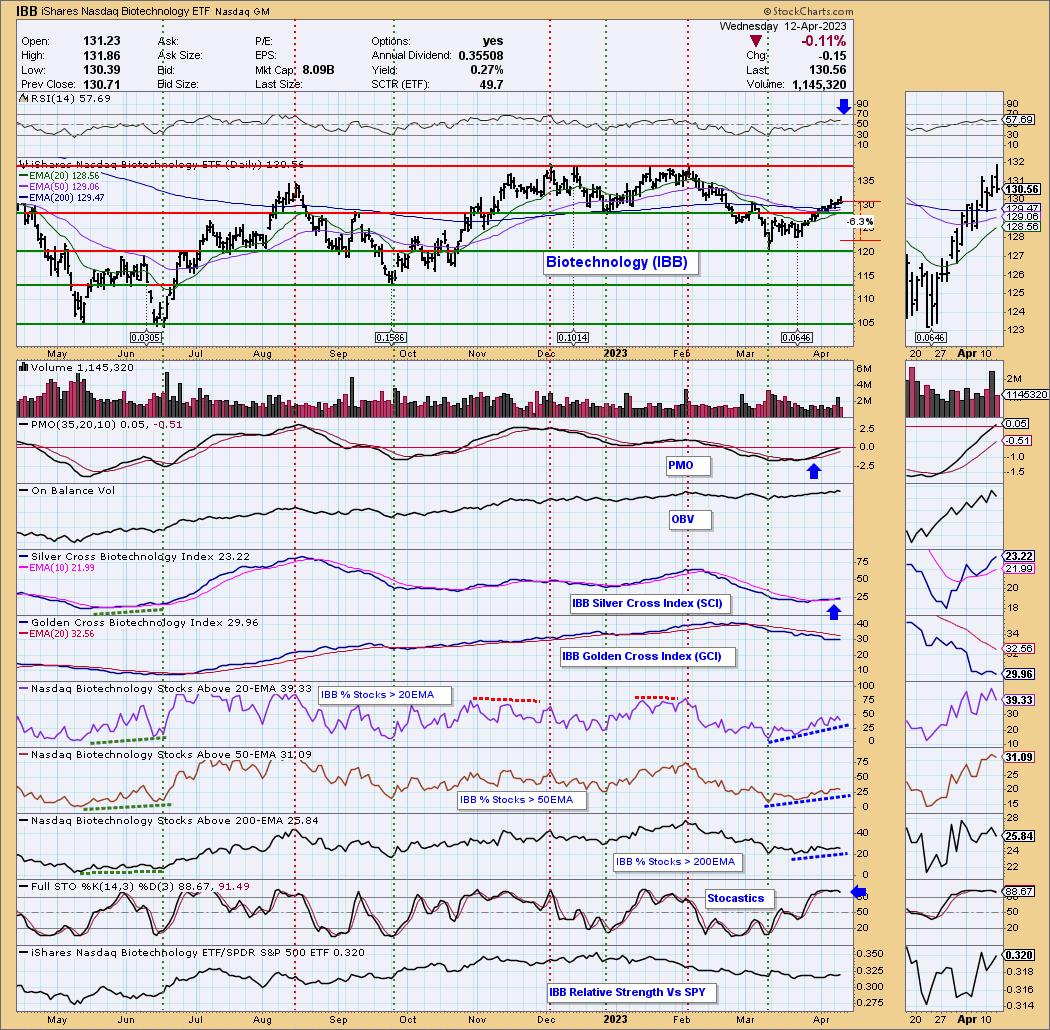
IBB is up +0.60% in after hours trading. We have our "under the hood" chart for this industry group. It looks very positive. The RSI is above net neutral (50). The PMO is on a BUY Signal and just hit positive territory above the zero line. The Silver Cross Index has bottomed above the signal line which is especially bullish. We see that %Stocks > 20/50-day EMAs is expanding so the Silver Cross Index will continue moving higher. I'd like to see improvement on the Golden Cross Index, but we need to get more stocks above their 200-day EMA for that to happen. Stochastics are oscillating in the upper range above 80. The stop is set below the last March low at 6.3% or $122.33.
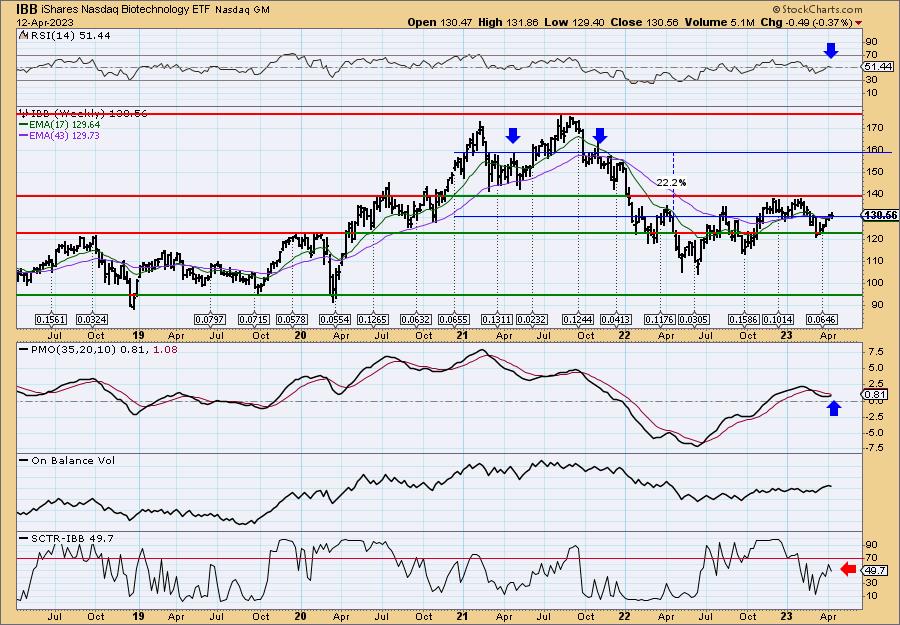
The weekly chart is getting very interesting. The weekly RSI just hit positive territory and the PMO is rising again toward a crossover BUY Signal. The StockCharts Technical Rank (SCTR) is outside the "hot zone"* above 70. Overall I'd say this is a short-term investment that could turn into an intermediate-term investment.
*We call it the "hot zone" because it implies that the stock/ETF is in the top 30% of its "universe" (large-, mid-, small-caps and ETFs) as far as trend and condition, particularly in the intermediate and long terms.
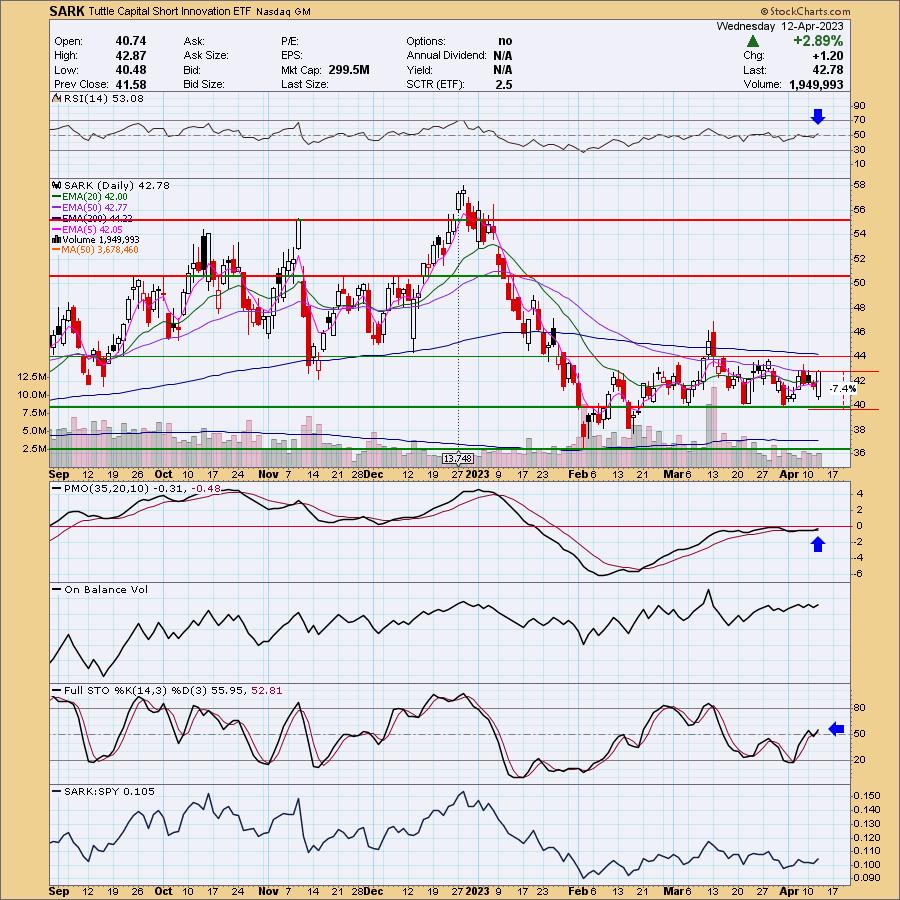
Tuttle Capital Short Innovation ETF (SARK)
EARNINGS: N/A
SARK is an actively-managed fund that seeks to achieve -1x the return, for a single day, of the ARK Innovation ETF (ARKK) through swap agreements with major global financial institutions. Click HERE for more information.
Predefined Scans Triggered: Elder Bar Turned Green, Bullish MACD Crossovers and Bullish Engulfing.
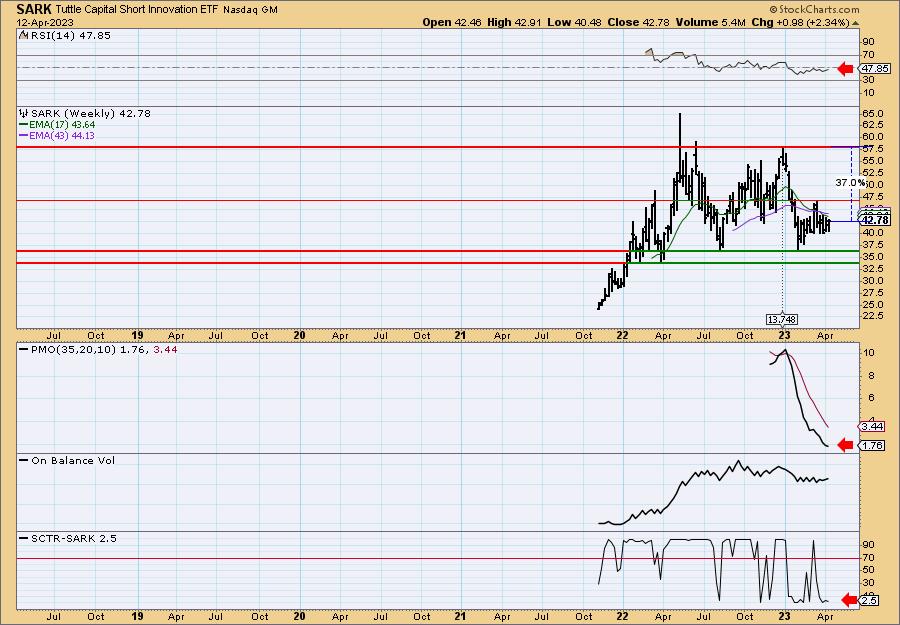
SARK is up +0.07% in after hours trading. This could be a great hedge. As noted in the opening, I'm banking on rising rates to help this ETF along. It has been in a trading range for some time, but I believe it is getting ready to breakout. The RSI just moved into positive territory, the PMO is rising on a recent BUY signal. Stochastics are rising in positive territory. They usually provide early detection of a shift in price. The stop was easy to set below support at 7.4% or $39.61.
The weekly chart needs serious help so this is a short-term hedge, not an intermediate-term investment. The RSI is still negative and the PMO, while decelerating a bit, is still falling. The SCTR is in the basement. If the market really turns south, this one has great potential but, remember, keep this in the "hedge" category.
Direxion Daily 7-10 Year Treasury Bear 3x Shares (TYO)
EARNINGS: N/A
TYO provides daily -3x exposure to a market-value weighted index of U.S. Treasury bonds with remaining maturities between 7 and 10 years. Click HERE for more information.
Predefined Scans Triggered: Bullish MACD Crossovers, Hollow Red Candles and P&F Double Bottom Breakout.
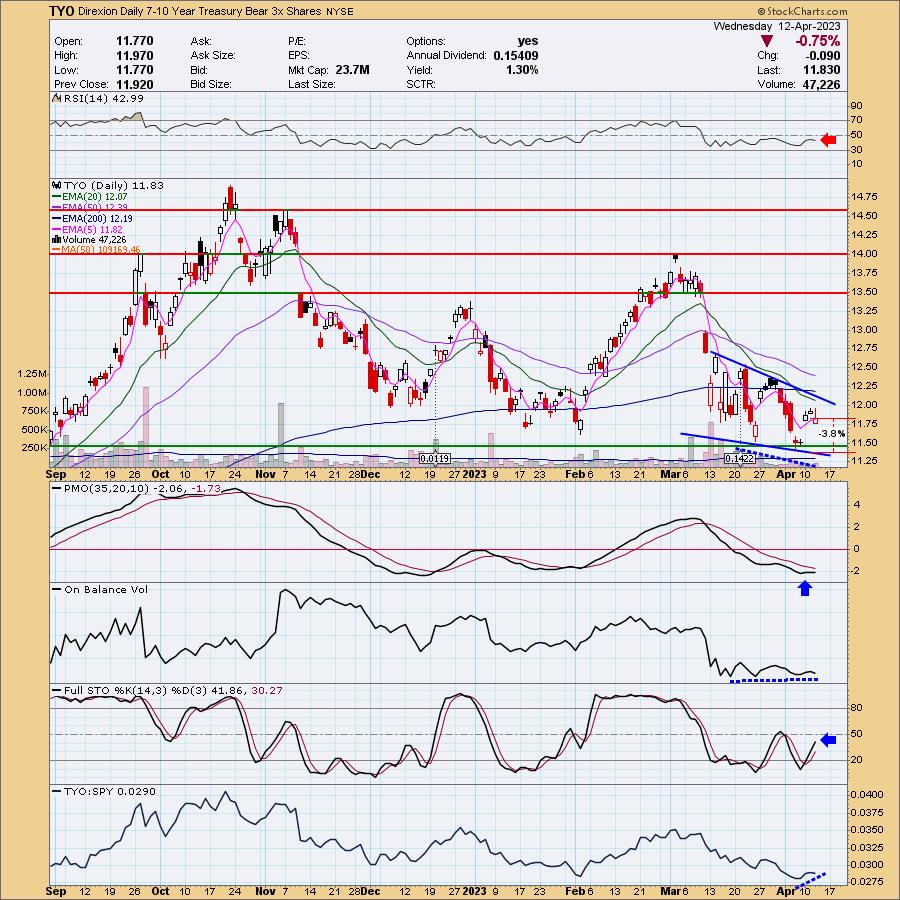
TYO is down -0.42% in after hours trading. I don't usually go for 3x inverses, but Bond funds' daily changes are generally very low. It is early, but as I said I would look for interest rates to rise from here. We have a negative RSI unfortunately, but it is early on this one. There is a bullish falling wedge. There was a bullish hollow red candlestick today which means it closed above the open, but was lower than yesterday. They often come at pivot points. The PMO is rising toward an oversold BUY Signal. There is a positive OBV divergence between price bottoms and OBV rising bottoms. Stochastics are rising strongly. We can set a very thin stop at 3.8% (you can extend that) or $11.38.
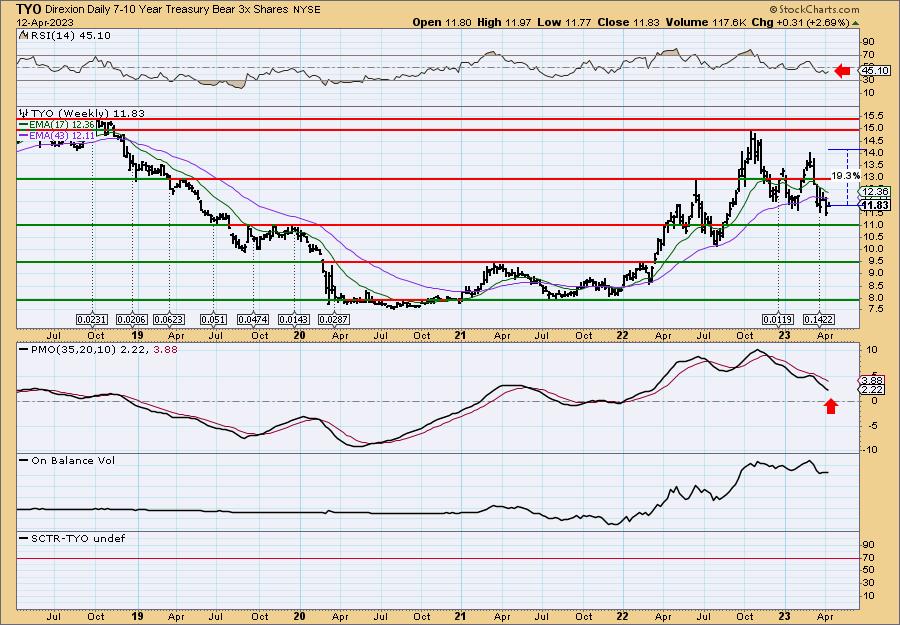
The weekly chart needs work, but this is not a surprise given the decline in yields of late. The RSI is negative and the PMO is falling. Remember this one will do well in a rising rate environment, but if the 10-year yield ($TNX) breaks below 3.3%, we will want to shed this one. I would look for a gain to the last top of about 19.3%.
Don't forget, on Thursdays I look at reader-requested symbols, click HERE to send me an email. I read every email I receive and try to answer them all!
Current Market Outlook:
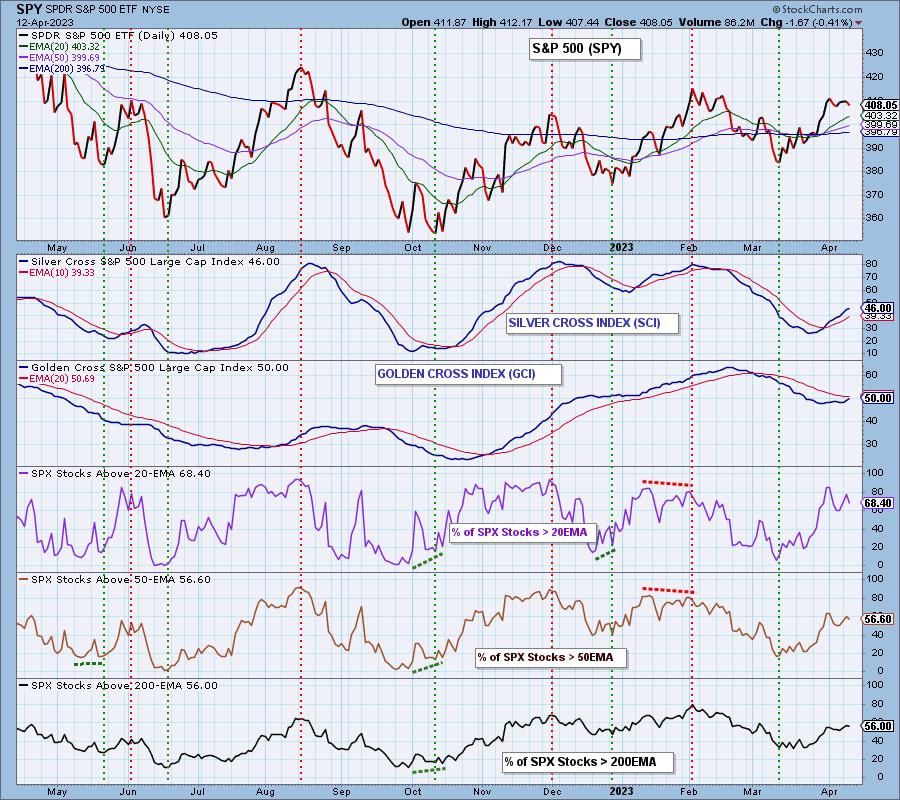
Market Environment: It is important to consider the odds for success by assessing the market tides. The following chart uses different methodologies for objectively showing the depth and trend of participation for intermediate- and long-term time frames.
- The Silver Cross Index (SCI) shows the percentage of SPX stocks on IT Trend Model BUY signals (20-EMA > 50-EMA)
- The Golden Cross Index (GCI) shows the percentage of SPX stocks on LT Trend Model BUY signals (50-EMA > 200-EMA)
Don't forget that as a "Diamonds" member, you have access to our GCI/SCI curated ChartList on DecisionPoint.com. You'll find it under "Members Only" links on the left side on the Blogs and Links Page.
Here is the current chart:
Full Disclosure: I am 26% long, 2% short. I'm considering SARK and TYO as hedges.
I'm required to disclose if I currently own a stock I mention and/or may buy/short it within the next 72 hours.
"Technical Analysis is a windsock, not a crystal ball." - Carl Swenlin
(c) Copyright 2023 DecisionPoint.com
Watch the latest episode of DecisionPoint Trading Room with Carl & Erin Swenlin on Mondays 7:00p EST or on the DecisionPoint playlist on the StockCharts TV YouTube channel here!
NOTE: The stocks reported herein are from mechanical trading model scans that are based upon moving average relationships, momentum and volume. DecisionPoint analysis is then applied to get five selections from the scans. The selections given should prompt readers to do a chart review using their own analysis process. This letter is not a call for a specific action to buy, sell or short any of the stocks provided. There are NO sure things or guaranteed returns on the daily selection of "Diamonds in the Rough."
Regarding BUY/SELL Signals: The signal status reported herein is based upon mechanical trading model signals and crossovers. They define the implied bias of the price index/stock based upon moving average relationships and momentum, but they do not necessarily call for a specific action. They are information flags that should prompt chart review. Further, they do not call for continuous buying or selling during the life of the signal. For example, a BUY signal will probably (but not necessarily) return the best results if action is taken soon after the signal is generated. Additional opportunities for buying may be found as price zigzags higher, but the trader must look for optimum entry points. Conversely, exit points to preserve gains (or minimize losses) may be evident before the model mechanically closes the signal.
Helpful DecisionPoint Links:
DecisionPoint Shared ChartList and DecisionPoint Chart Gallery
Price Momentum Oscillator (PMO)
Swenlin Trading Oscillators (STO-B and STO-V)
For more links, go to DecisionPoint.com