
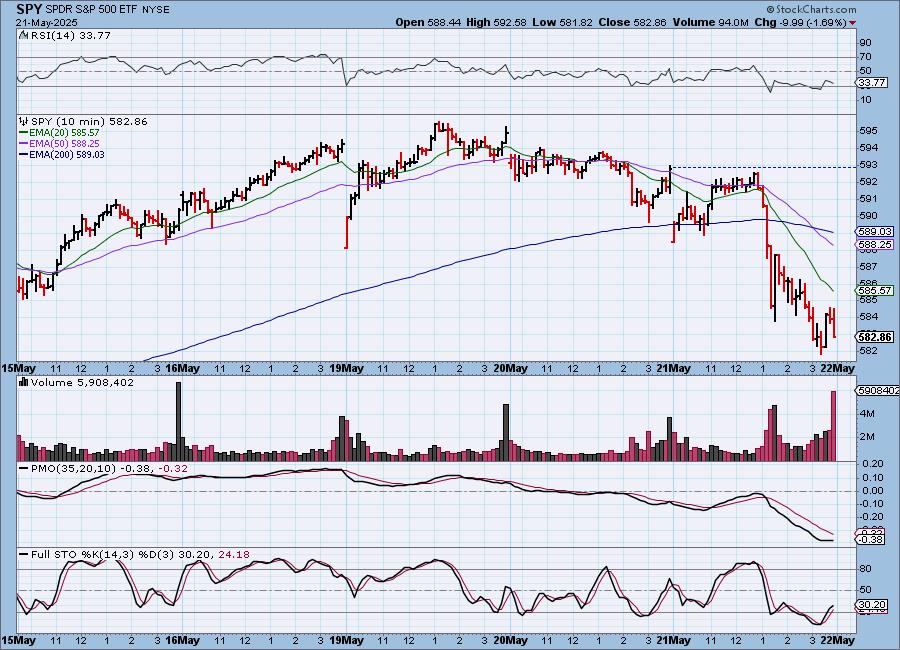
SPY 10-Minute Chart: There have been concerns about the health of the treasury markets based on the rising yields. Today, yields popped on a disappointing auction coming off the heels of a downgrade of U.S. debt. This sent alarm bells off midday and had the market sinking rapidly. Headline driven price action continues. The 10-minute Stochastics do look somewhat encouraging, but we doubt we'll see much upside tomorrow.
The DecisionPoint Alert Weekly Wrap presents an end-of-week assessment of the trend and condition of the Stock Market, the U.S. Dollar, Gold, Crude Oil, and Bonds. The DecisionPoint Alert daily report (Monday through Thursday) is abbreviated and gives updates on the Weekly Wrap assessments.
MARKET/INDUSTRY GROUP/SECTOR INDEXES
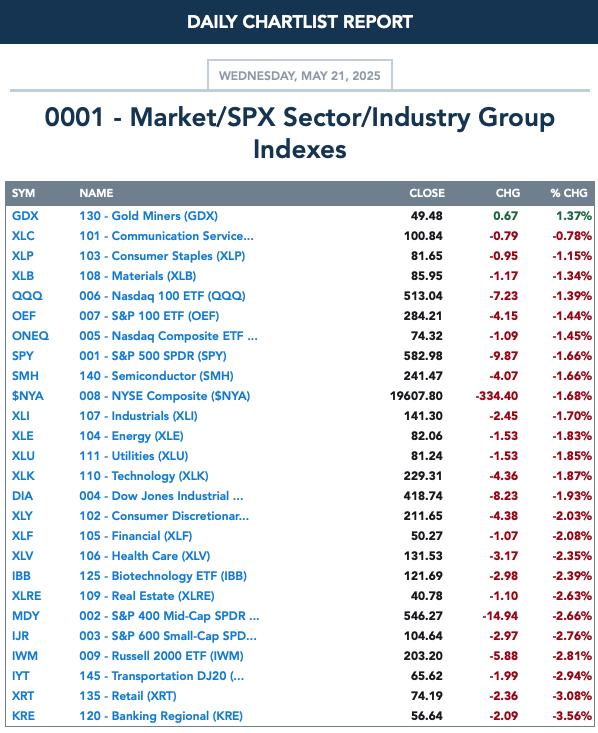
CLICK HERE for Carl's annotated Market Index, Sector, and Industry Group charts.
THE MARKET (S&P 500)
IT Trend Model: NEUTRAL as of 3/4/2025
LT Trend Model: SELL as of 4/16/2025
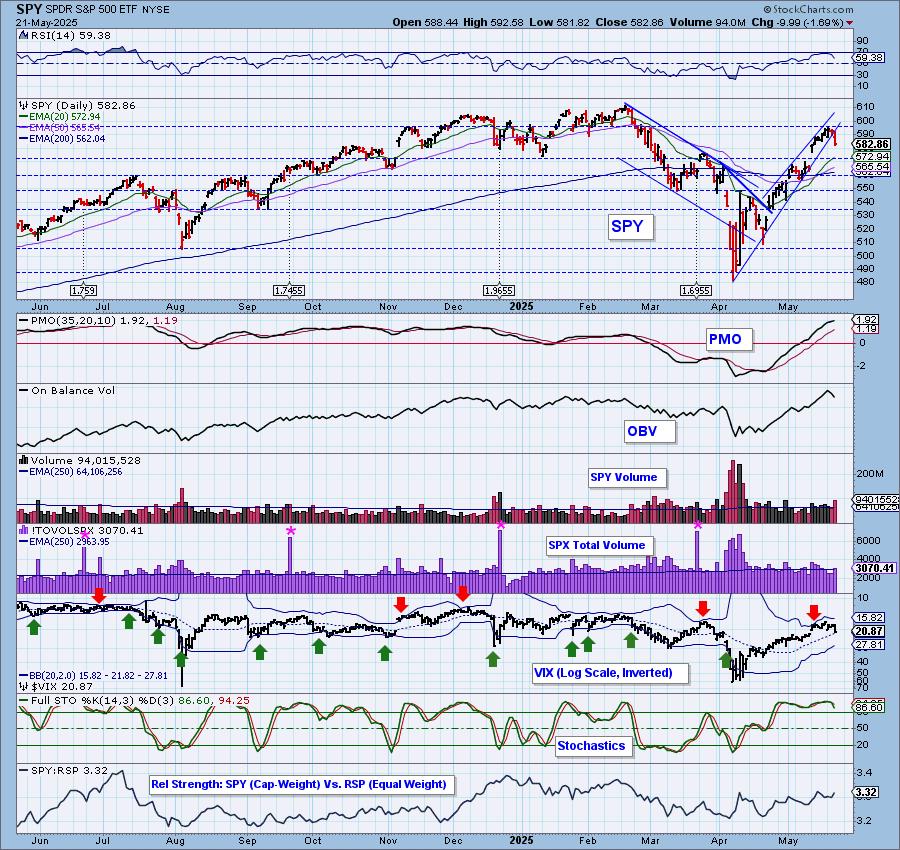
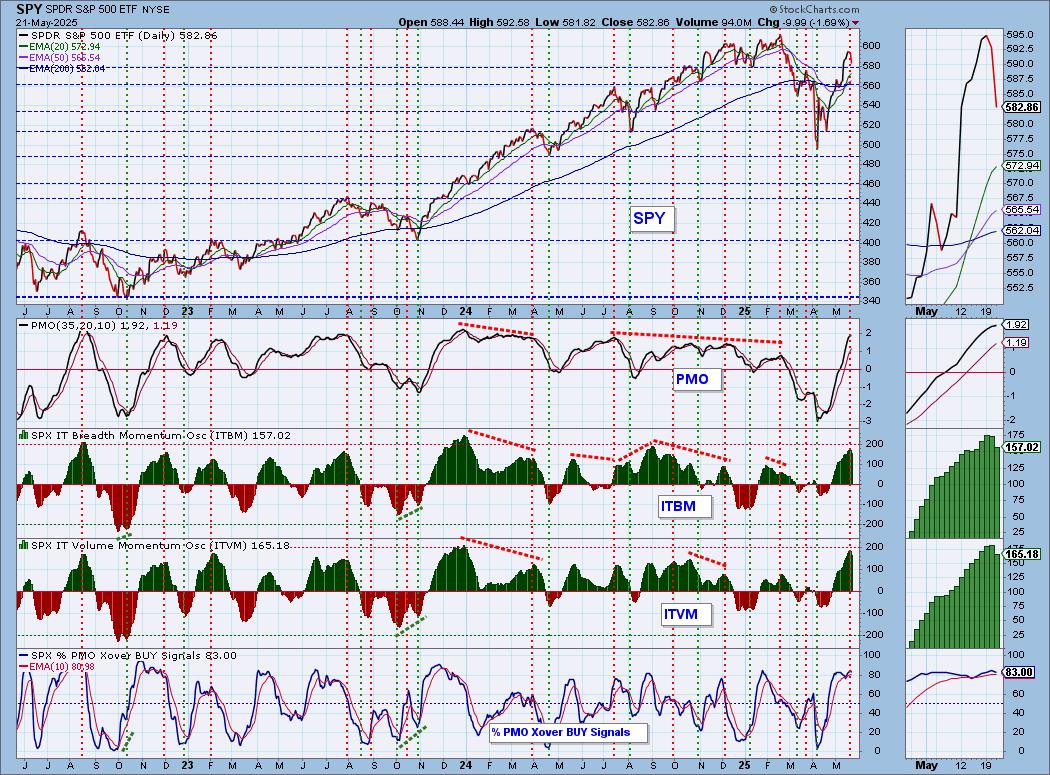
SPY Daily Chart: The bearish rising wedge was confirmed with today's decline. Price is sitting near support, but it looks somewhat vulnerable given trading today. The RSI has pulled out of overbought territory. The PMO continues to rise, but does appear to be showing signs of deceleration.
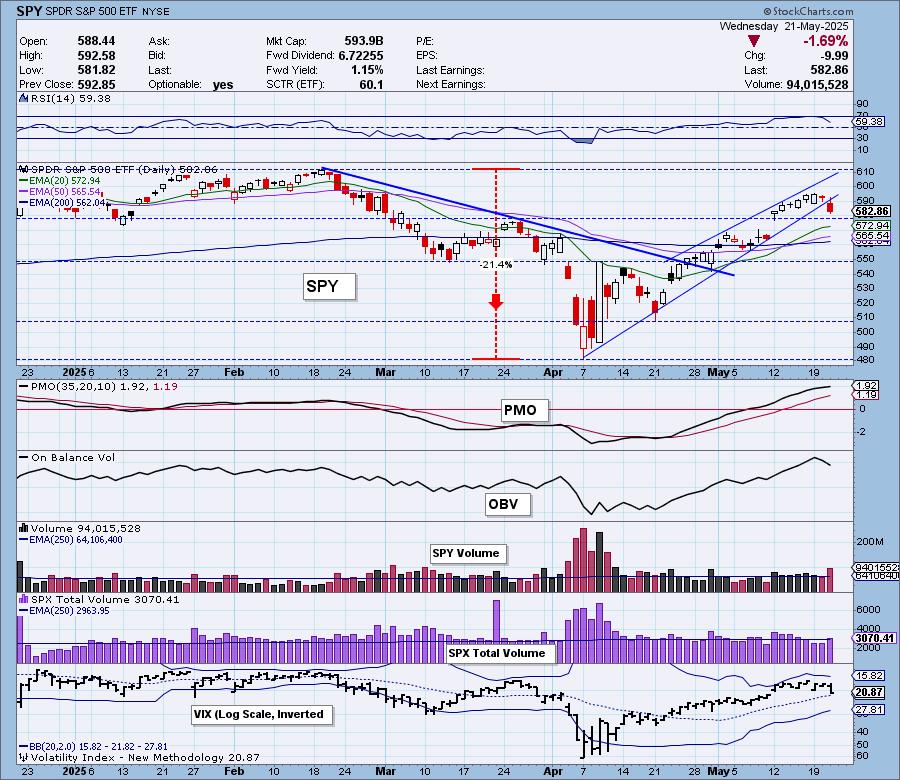
The VIX nearly dropped below its moving average on the inverted scale. A drop below would be a sign of internal weakness. That could come as soon as tomorrow. Stochastics are dropping again, but do remain above 80 so it is a sign of diminishing strength, not new weakness.
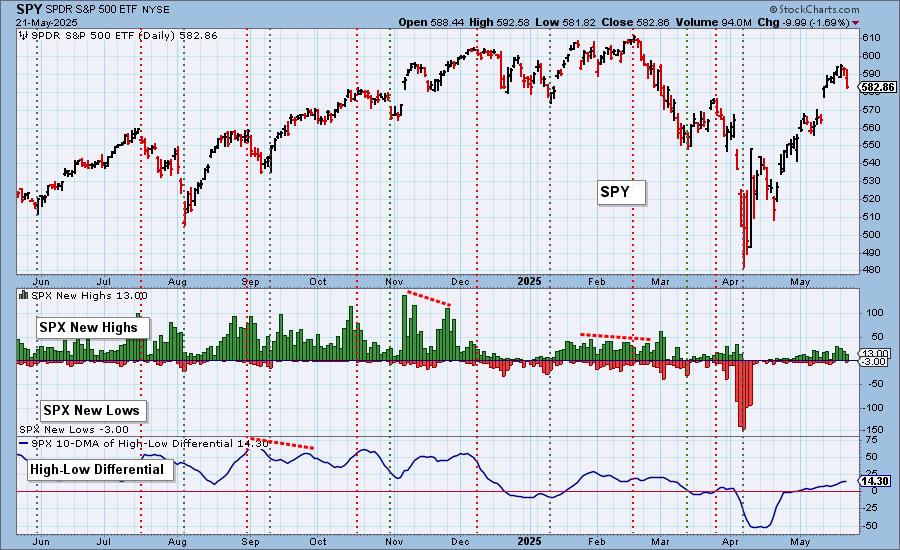
S&P 500 New 52-Week Highs/Lows: New Highs pared back on the decline as we would expect. New Lows are beginning to make an appearance. For now the High-Low Differential is rising which is bullish.
Climax* Analysis: Today there were unanimous, strong climax readings on the four relevant indicators, which gives us a downside initiation climax. Total Volume was on average and not at blowout levels.
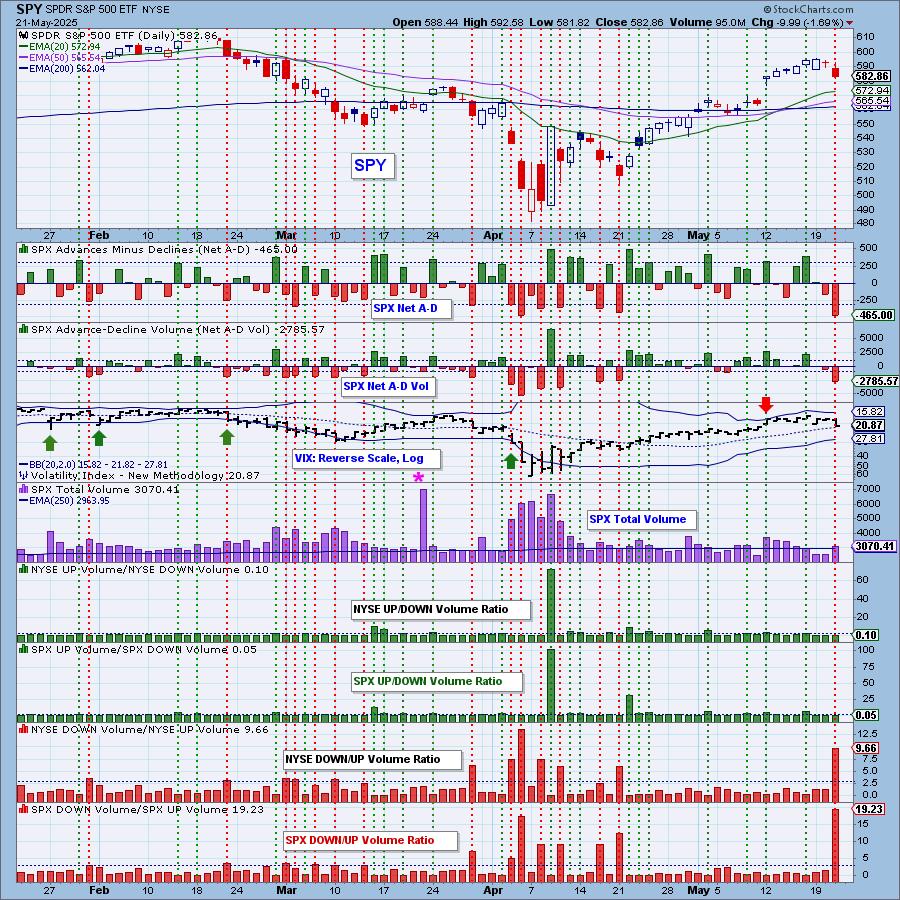
*A climax is a one-day event when market action generates very high readings in, primarily, breadth and volume indicators. We also include the VIX, watching for it to penetrate outside the Bollinger Band envelope. The vertical dotted lines mark climax days -- red for downside climaxes, and green for upside. Climaxes are at their core exhaustion events; however, at price pivots they may be initiating a change of trend.
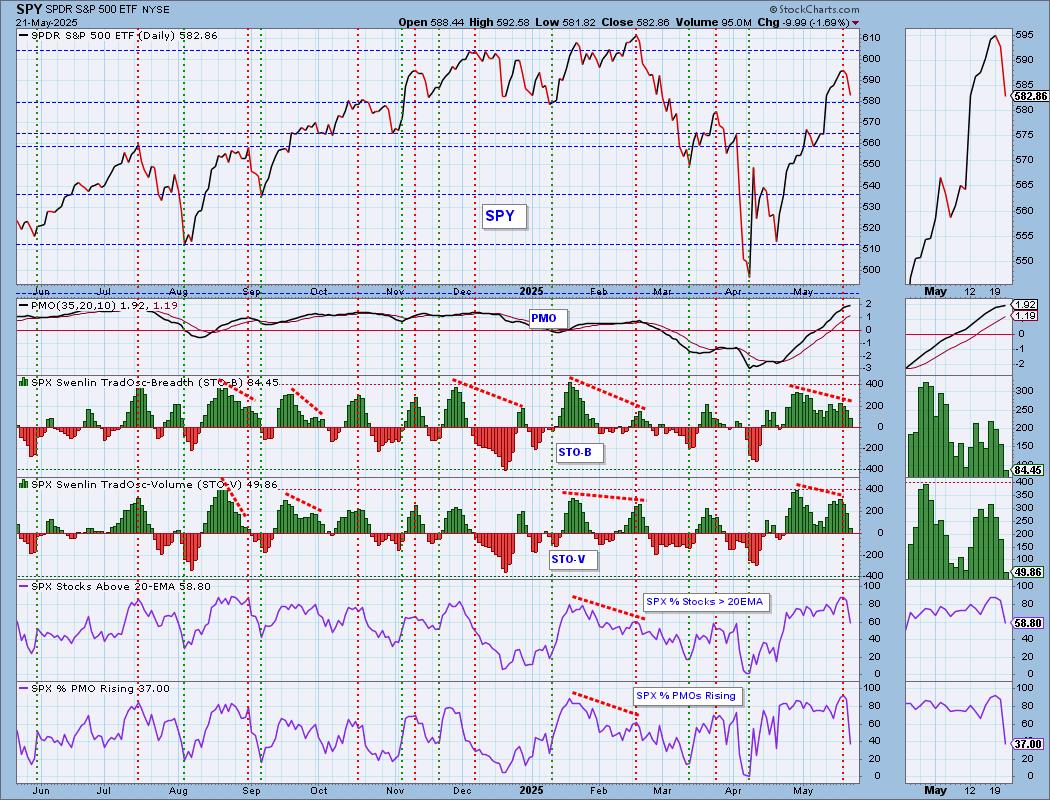
Short-Term Market Indicators: The short-term market trend is UP and the condition is NEUTRAL.
The negative divergences on the Swenlin Trading Oscillators (STOs) may be playing out already with today's decline and downside initiation climax. Both STOs are dropping quickly which doesn't bode well. Participation was hit very hard and that does suggest we have more downside to absorb. Rising momentum was slashed on the decline which is clearly bearish.
Intermediate-Term Market Indicators: The intermediate-term market trend is UP and the condition is OVERBOUGHT.
Both the ITBM and ITVM are falling now, coming out of overbought conditions. This could mean a more substantial or lasting decline. Despite losing so many rising PMOs, we didn't see much damage to %PMO Xover BUY Signals. That will change quickly if this decline gets going.
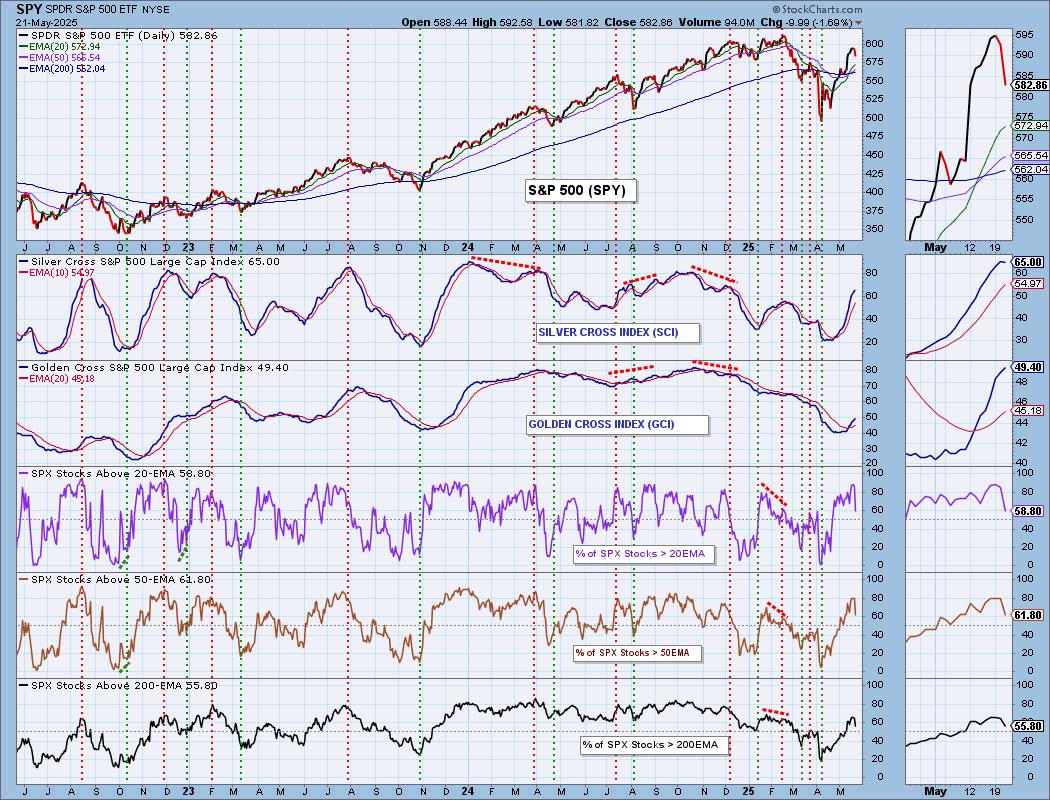
PARTICIPATION CHART (S&P 500): The following chart objectively shows the depth and trend of participation for the SPX in two time frames.
- Intermediate-Term - the Silver Cross Index (SCI) shows the percentage of SPX stocks on IT Trend Model BUY signals (20-EMA > 50-EMA). The opposite of the Silver Cross is a "Dark Cross" -- those stocks are, at the very least, in a correction.
- Long-Term - the Golden Cross Index (GCI) shows the percentage of SPX stocks on LT Trend Model BUY signals (50-EMA > 200-EMA). The opposite of a Golden Cross is the "Death Cross" -- those stocks are in a bear market.
The market bias is BULLISH in the intermediate and long terms.
Participation was really hit hard by today's decline, more than we would've expected given the market was clicking along. Percentages are still above our bullish 50% threshold, but that looks like it won't last much longer if the decline sees follow-through. At this point, the Silver Cross Index is above its signal line so the IT Bias is still BULLISH. Similarly, the Golden Cross Index is above its signal line so the LT Bias is BULLISH as well.
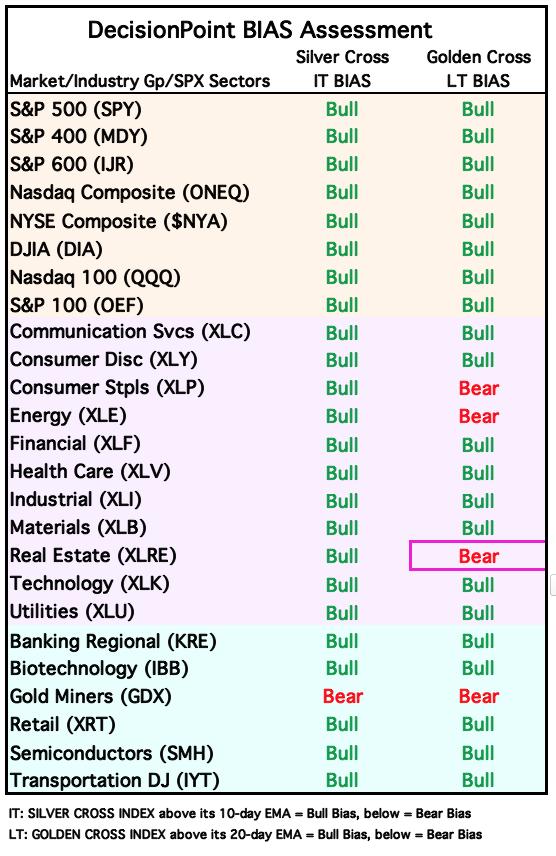
BIAS Assessment: The following table expresses the current BIAS of various price indexes based upon the relationship of the Silver Cross Index to its 10-day EMA (intermediate-term), and of the Golden Cross Index to its 20-day EMA (long-term). When the Index is above the EMA it is bullish, and it is bearish when the Index is below the EMA. The BIAS does not imply that any particular action should be taken. It is information to be used in the decision process.
The items with highlighted borders indicate that the BIAS changed today.
*****************************************************************************************************
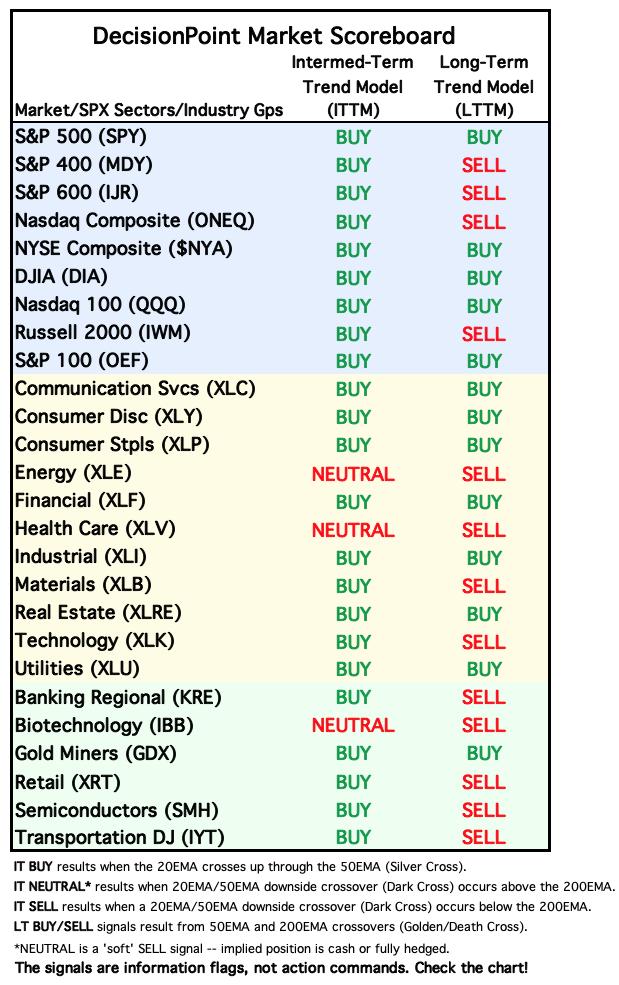
CONCLUSION: There was a weak Treasury auction today, which triggered the sell-off. Nevertheless, with overbought intermediate-term indicators, the market was due for a pullback. Participation and rising PMOs really fell off a cliff today and that has us thinking that this decline could catch fire. STOs are falling and their negative divergences seem to be playing out today. The ITBM and ITVM are now confirming falling STOs and today saw a new downside initiation climax. We should expect this decline to continue. The market ran too hot for too long. It may be time to watch all those new BUY signals on our Signal Scoreboard flip back to Neutral.
Erin is 70% long, 0% short. (This is intended as information, not a recommendation.)
*****************************************************************************************************
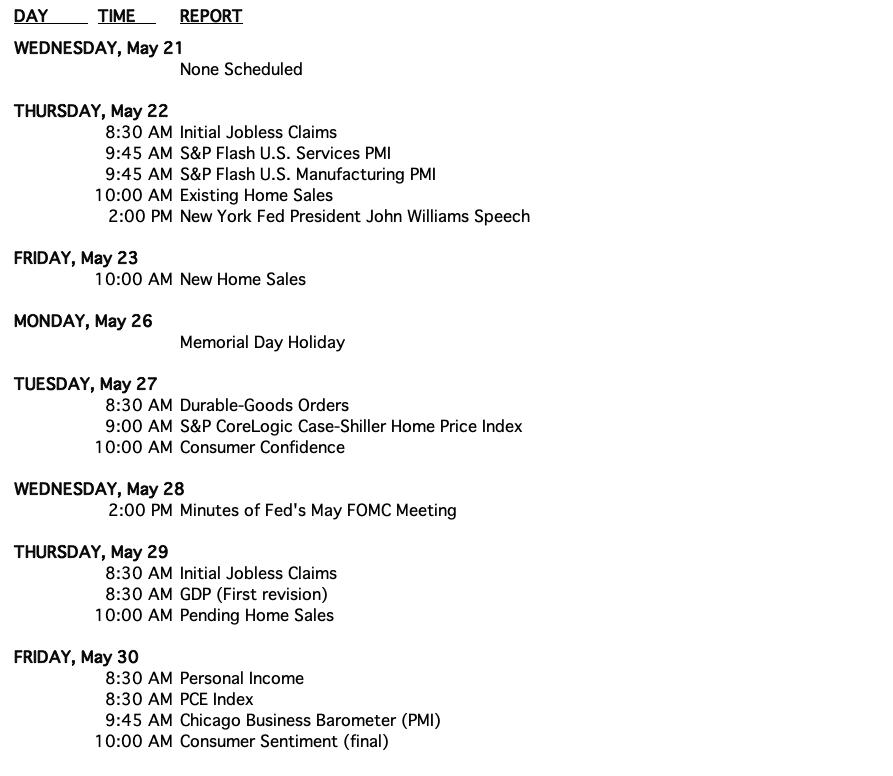
CALENDAR
BITCOIN
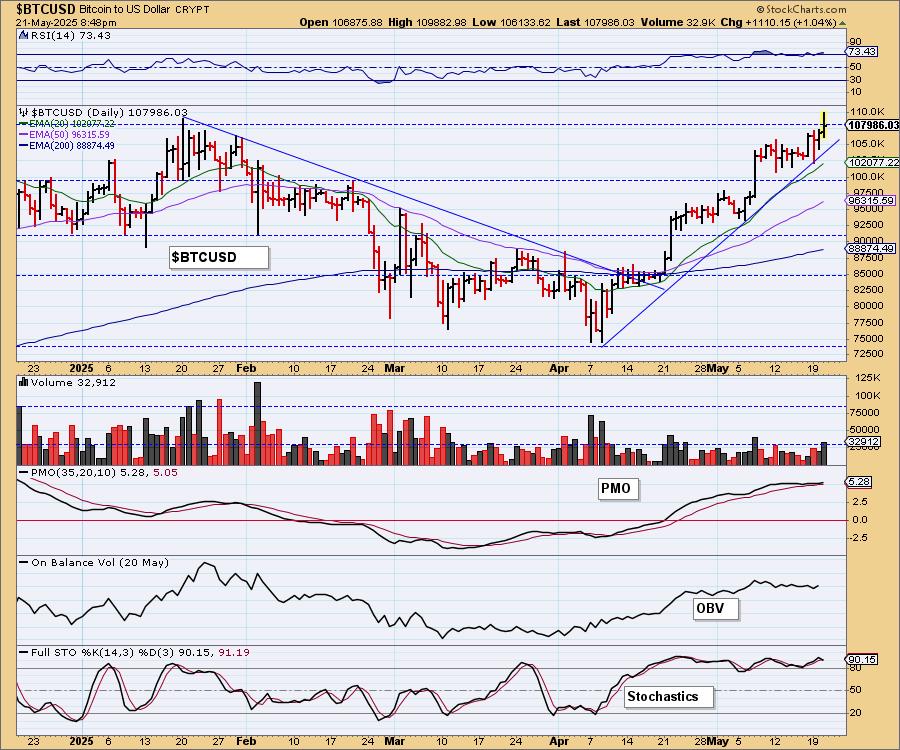
Bitcoin hit new all-time highs and is likely to climb higher from here given the strong rising trend. The PMO is flattening above the zero line and that means pure strength. The one problem we see is that Bitcoin is now overbought based on the RSI being over 70. This could mean another period of consolidation ahead.
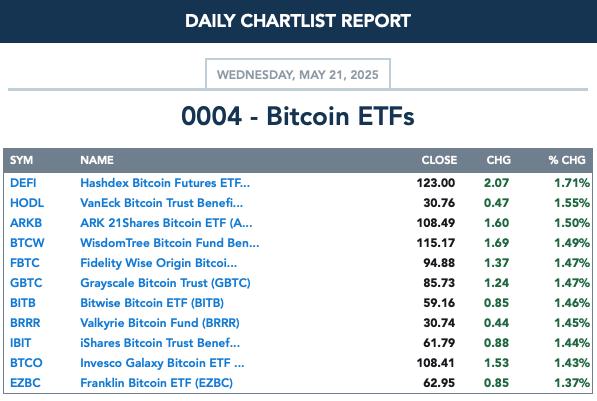
BITCOIN ETFs
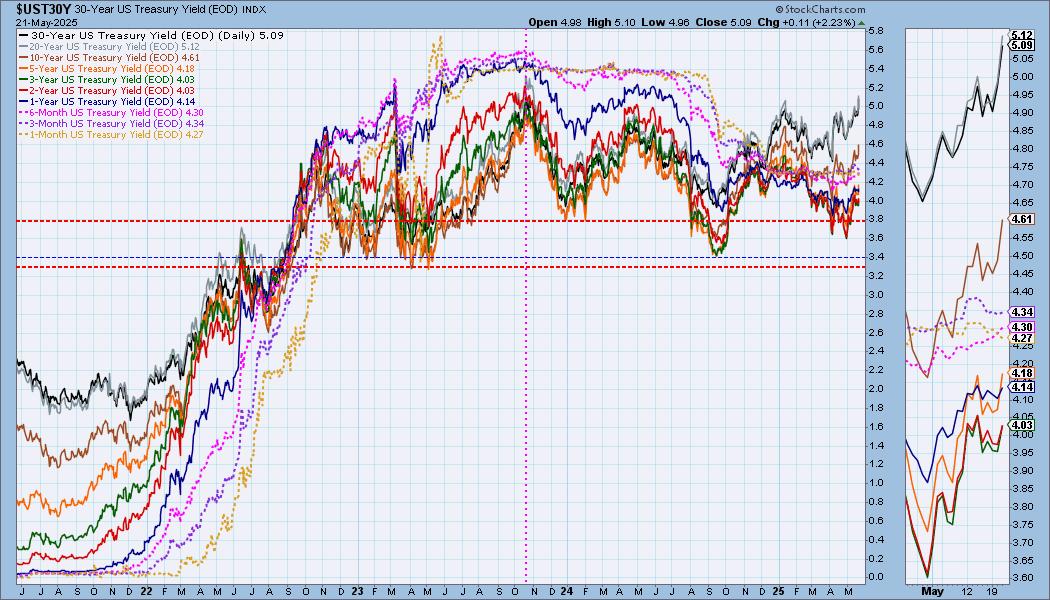
INTEREST RATES
As noted in the opening, long-term yields burst forth today on the lackluster treasury auction. We think yields are going to rise higher from here given strong rising trends and weak bond market.
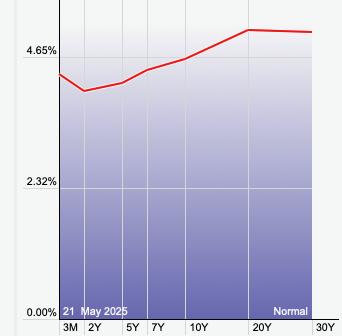
The Yield Curve Chart from StockCharts.com shows us the inversions taking place. The red line should move higher from left to right. Inversions are occurring where it moves downward.
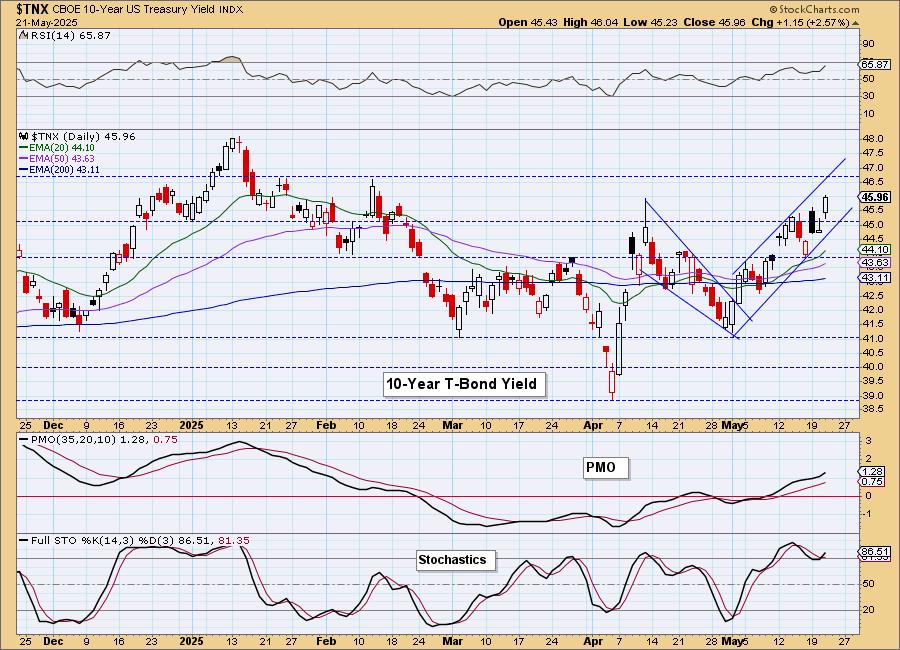
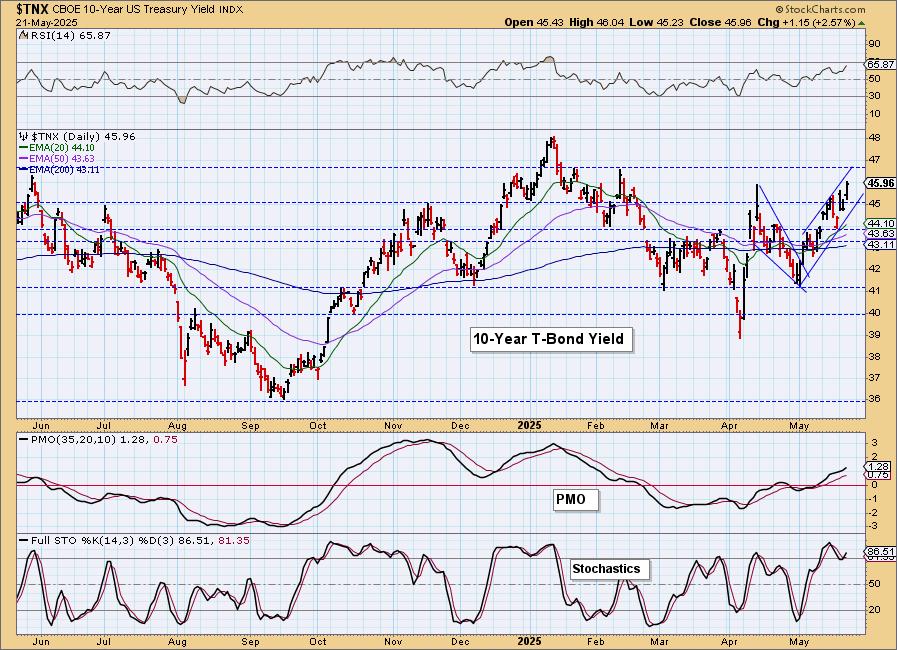
10-YEAR T-BOND YIELD
This rising wedge could easily be a rising trend channel. We'll err on the bullish side today given the fundamental outlook for bonds which is bearish. We would expect to see the yield move higher from here on today's breakout move. The PMO is accelerating higher and the RSI is not overbought. Stochastics are also rising strongly.
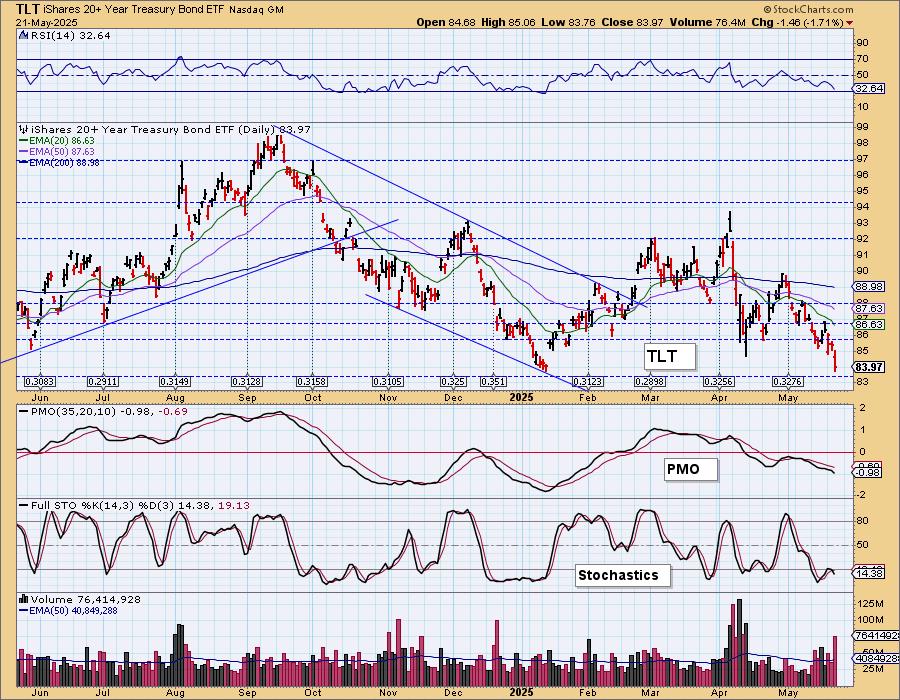
BONDS (TLT)
IT Trend Model: SELL as of 4/14/2025
LT Trend Model: SELL as of 12/13/2024
TLT Daily Chart: We mentioned yesterday that the support zone was very vulnerable and we're seeing that play out today. The indicators are very bearish. The PMO in particular is headed lower below the zero line. Stochastics have topped and are reading below 20 implying internal weakness. We expect bonds to head lower.
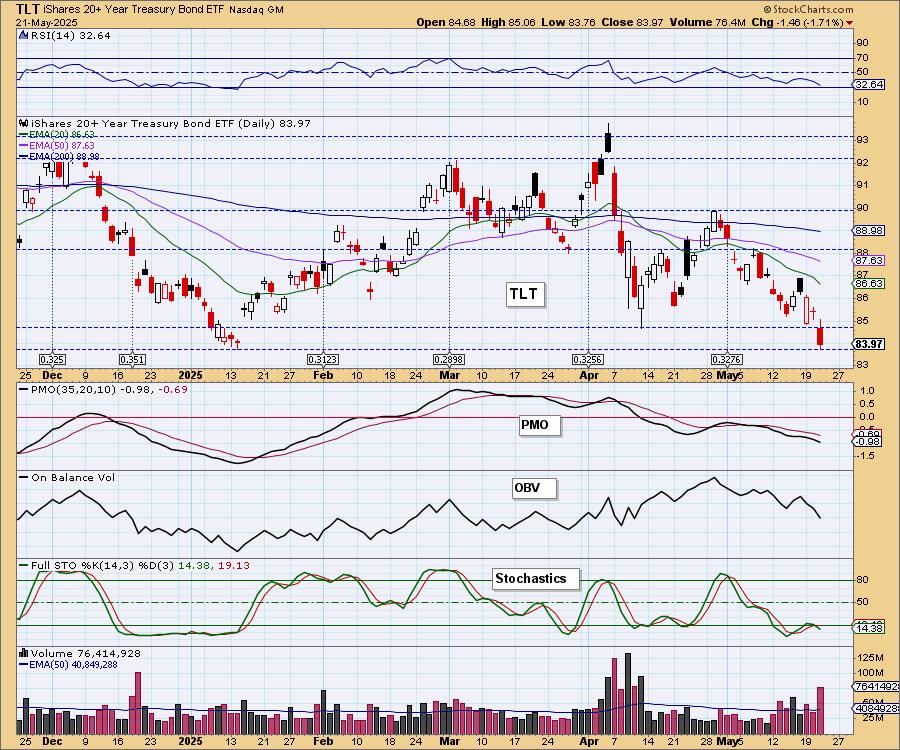
The strongest level of support lies close to 83 and that is where we are looking for Bonds to go.
DOLLAR (UUP)
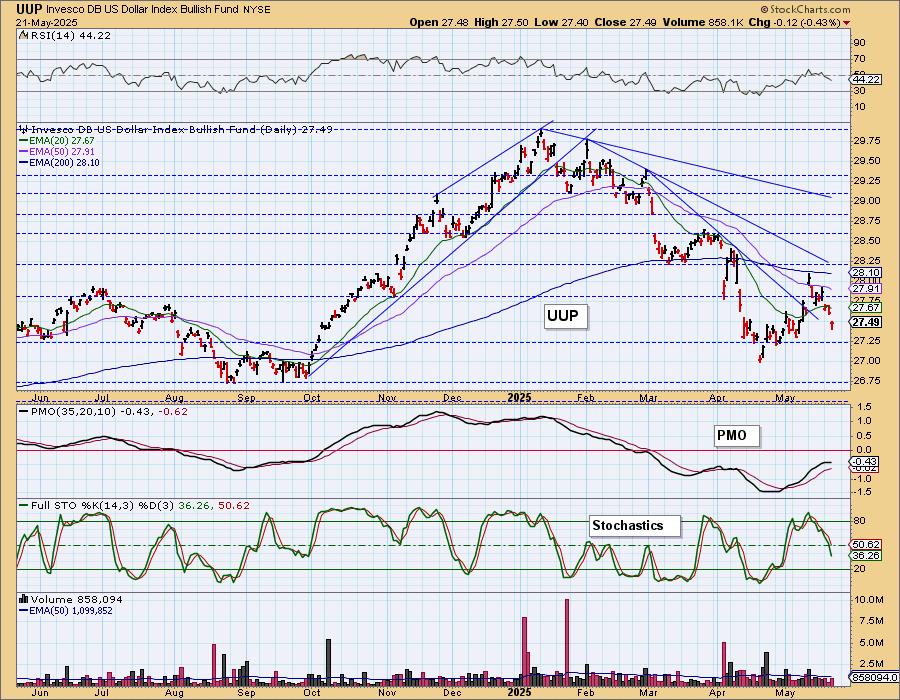
IT Trend Model: NEUTRAL as of 3/5/2025
LT Trend Model: SELL as of 4/25/2025
UUP Daily Chart: The Dollar has broken its rising trend. It did form a bullish hammer candlestick, but we think it will head lower. The PMO has now topped beneath the zero line and Stochastics are diving lower. This is a good setup for Gold and Silver.
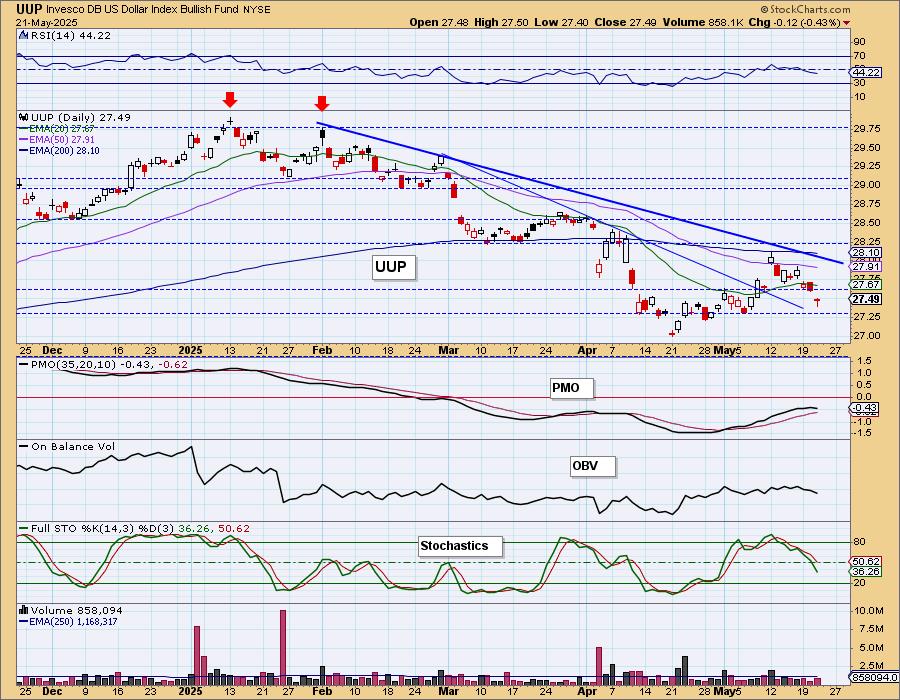
Price failed at the 200-day EMA and retreated. We would look past support for a drop to test the April low.
GOLD
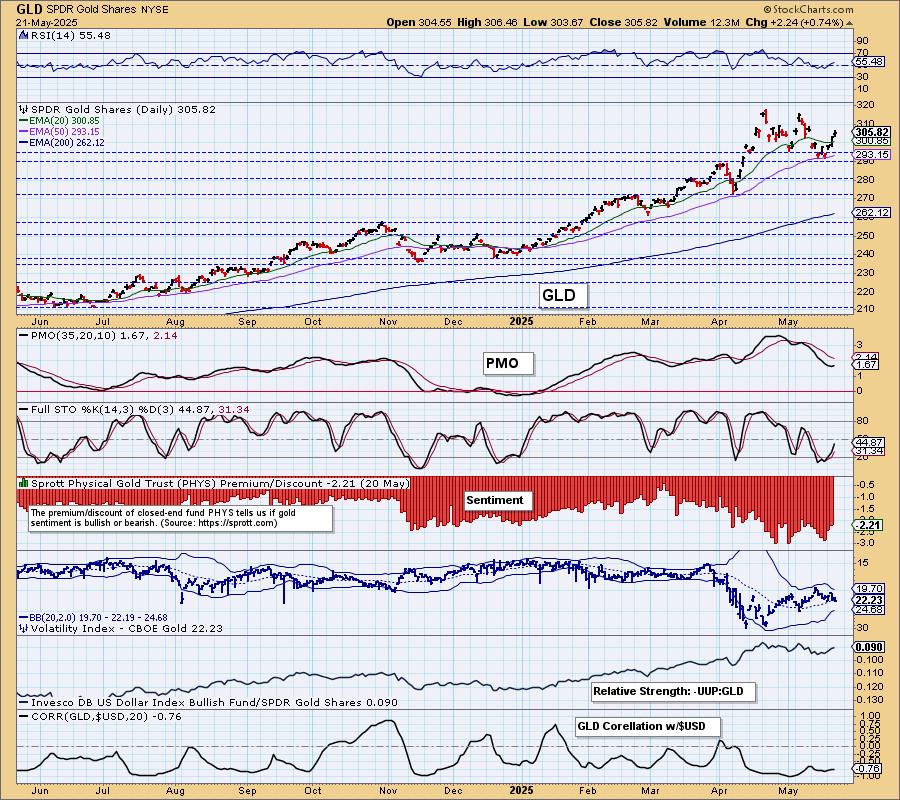
IT Trend Model: BUY as of 1/10/2025
LT Trend Model: BUY as of 10/20/2023
GLD Daily Chart: With the Dollar weakening, Gold is far more attractive. It is in a declining trend channel, but it could be setting up for a breakout. The RSI is back in positive territory and the PMO has turned back up. Stochastics also look favorable.
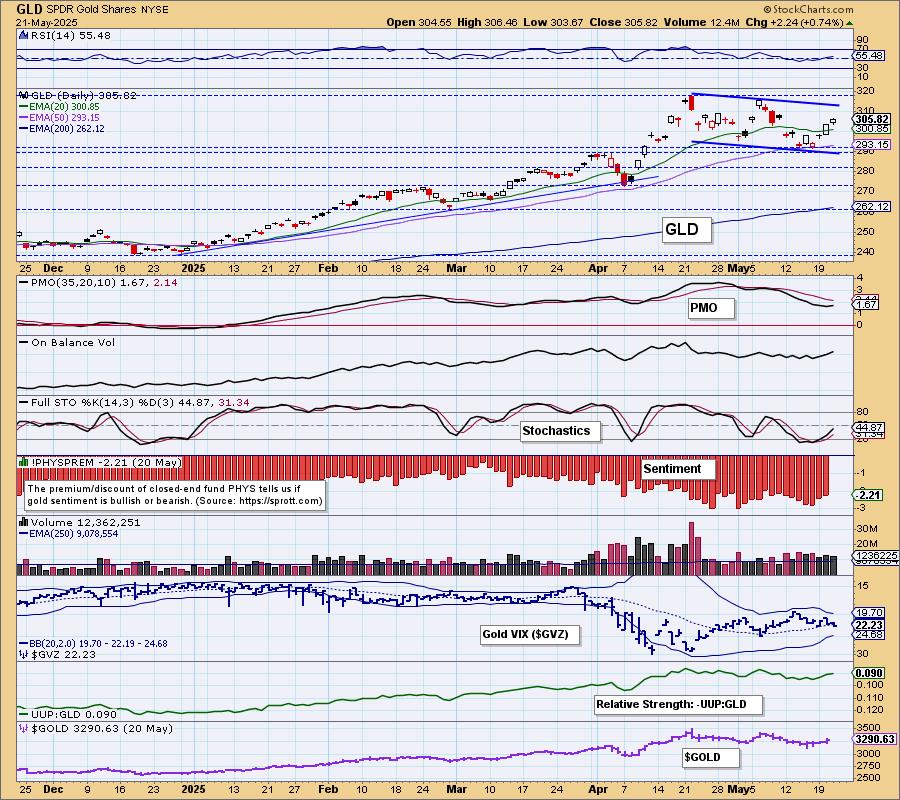
The double top formation hasn't actually been busted, that would take a move to all-time highs, but it doesn't look very formidable. We could even make a case for a large bull flag. The correlation between Gold and the Dollar is strongly negative so weakness in the Dollar will definitely help out Gold.
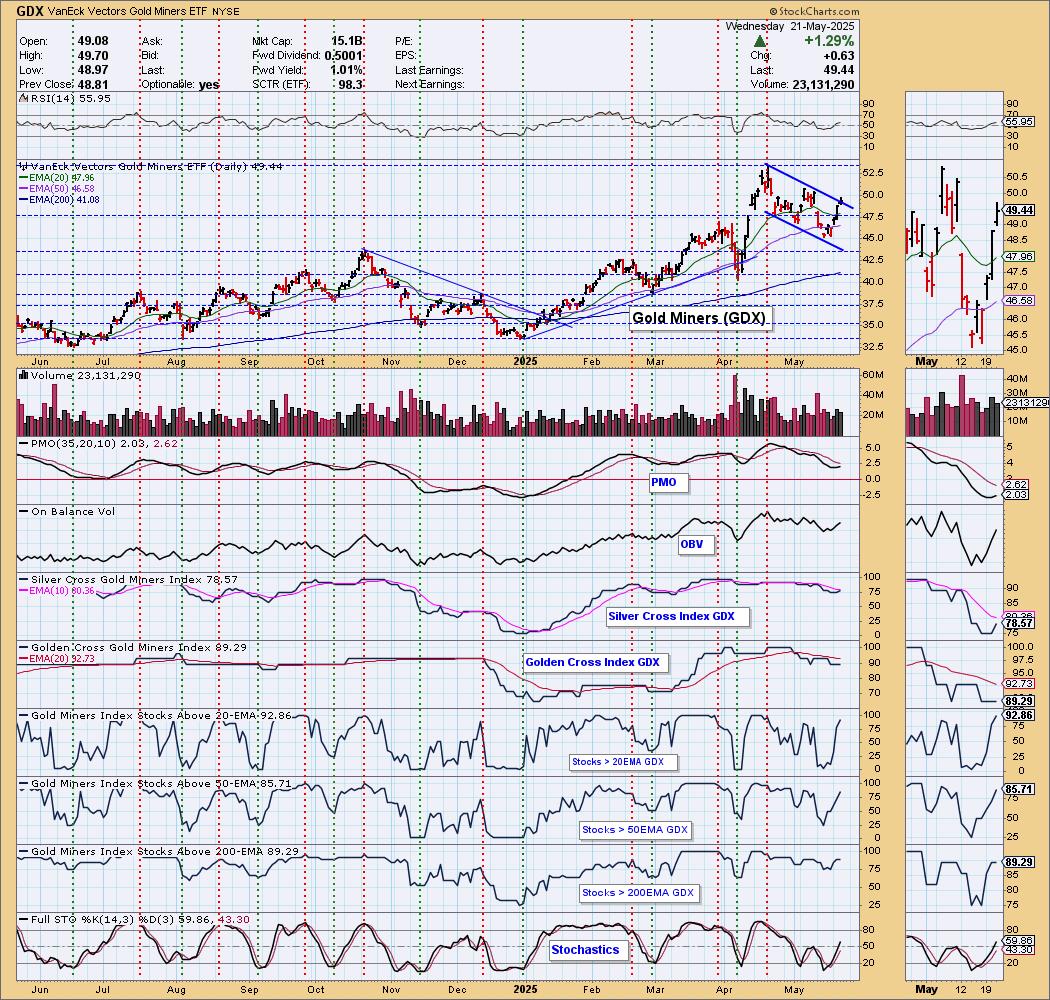
GOLD MINERS (GDX) Daily Chart: We mentioned it on Gold and now we will mention it with Gold Miners. We think we have a bull flag formation here and price technically broke out of the flag today. A weak Dollar and strong Gold will put the wind at GDX's back. Participation has healed and the Silver Cross Index has turned back up. This looks very promising.
CRUDE OIL (USO)
IT Trend Model: NEUTRAL as of 2/27/2025
LT Trend Model: SELL as of 3/18/2025
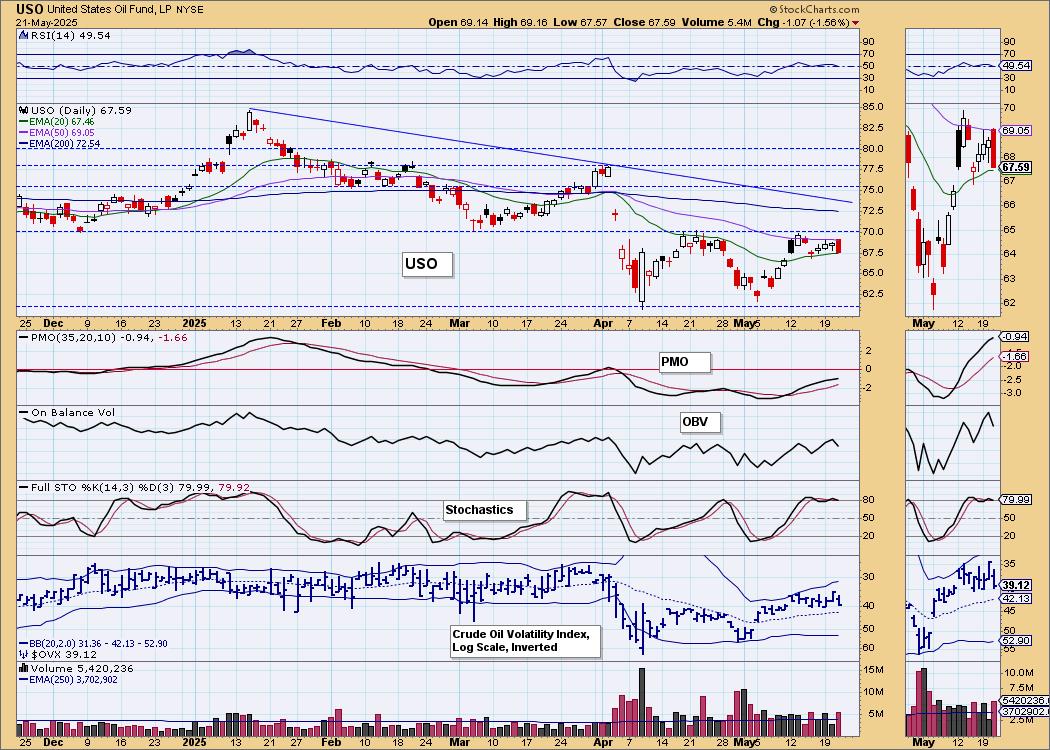
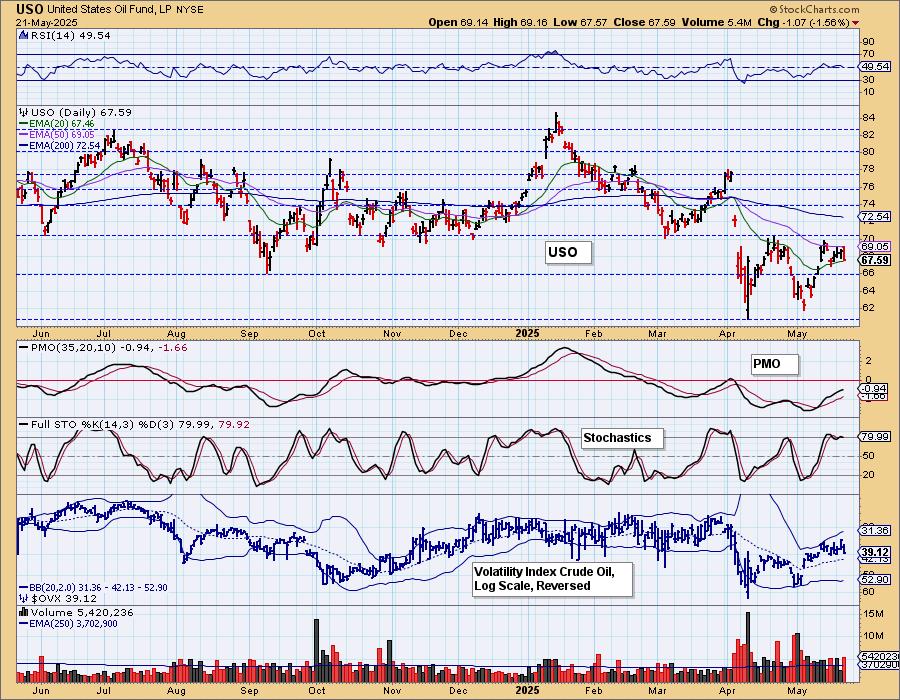
USO Daily Chart: Crude continues to struggle below resistance. The administration is working very hard to get Oil prices lower to help with inflation. So far their efforts have kept Crude in their long-term price range. This, however, looks like a possible new trading range. The indicators aren't really bearish, but neither are they very bullish. We suspect Crude will remain in a holding pattern.
Good Luck & Good Trading!
Erin Swenlin and Carl Swenlin
Technical Analysis is a windsock, not a crystal ball. --Carl Swenlin
(c) Copyright 2025 DecisionPoint.com
Disclaimer: This blog is for educational purposes only and should not be construed as financial advice. The ideas and strategies should never be used without first assessing your own personal and financial situation, or without consulting a financial professional. Any opinions expressed herein are solely those of the author, and do not in any way represent the views or opinions of any other person or entity.
DecisionPoint is not a registered investment advisor. Investment and trading decisions are solely your responsibility. DecisionPoint newsletters, blogs or website materials should NOT be interpreted as a recommendation or solicitation to buy or sell any security or to take any specific action.
NOTE: The signal status reported herein is based upon mechanical trading model signals, specifically, the DecisionPoint Trend Model. They define the implied bias of the price index based upon moving average relationships, but they do not necessarily call for a specific action. They are information flags that should prompt chart review. Further, they do not call for continuous buying or selling during the life of the signal. For example, a BUY signal will probably (but not necessarily) return the best results if action is taken soon after the signal is generated. Additional opportunities for buying may be found as price zigzags higher, but the trader must look for optimum entry points. Conversely, exit points to preserve gains (or minimize losses) may be evident before the model mechanically closes the signal.
Helpful DecisionPoint Links:
DecisionPoint Alert Chart List
DecisionPoint Golden Cross/Silver Cross Index Chart List
DecisionPoint Sector Chart List
Price Momentum Oscillator (PMO)