
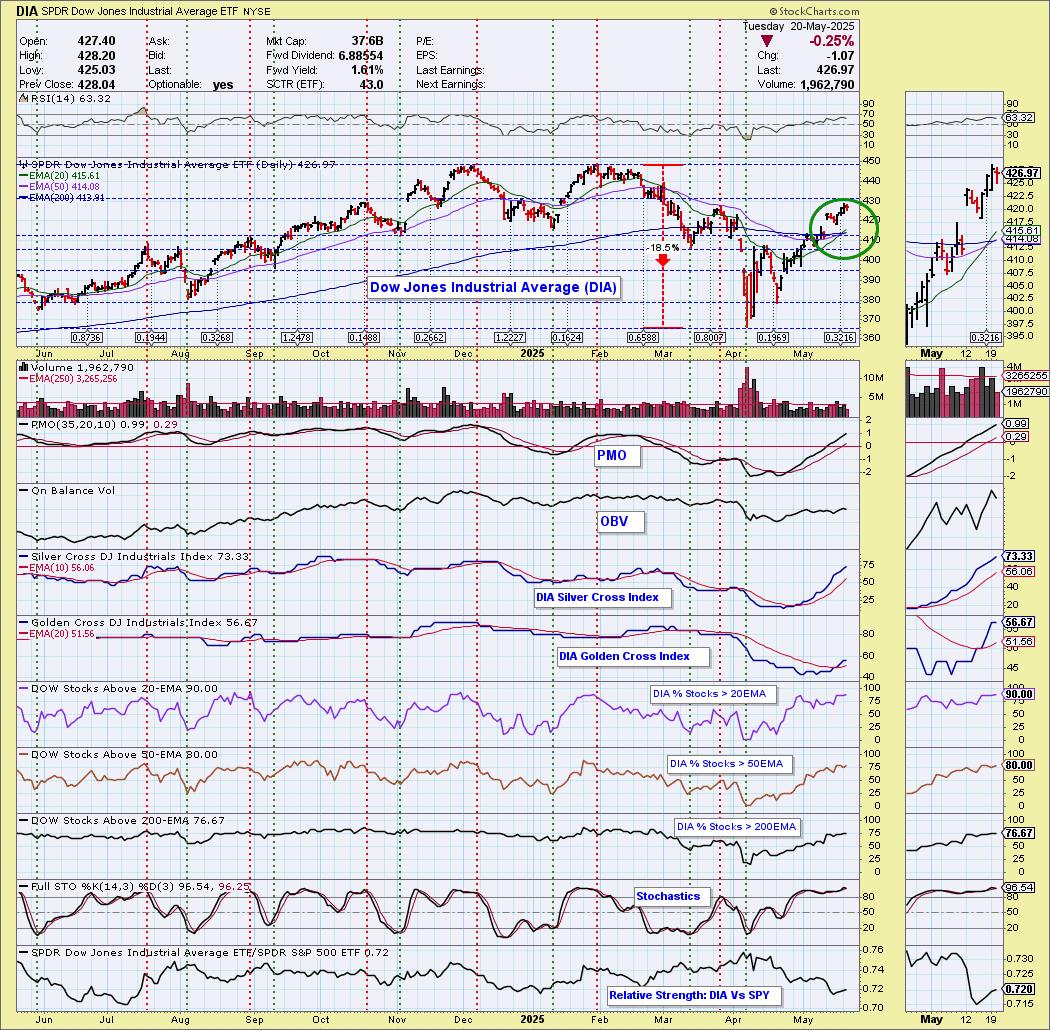
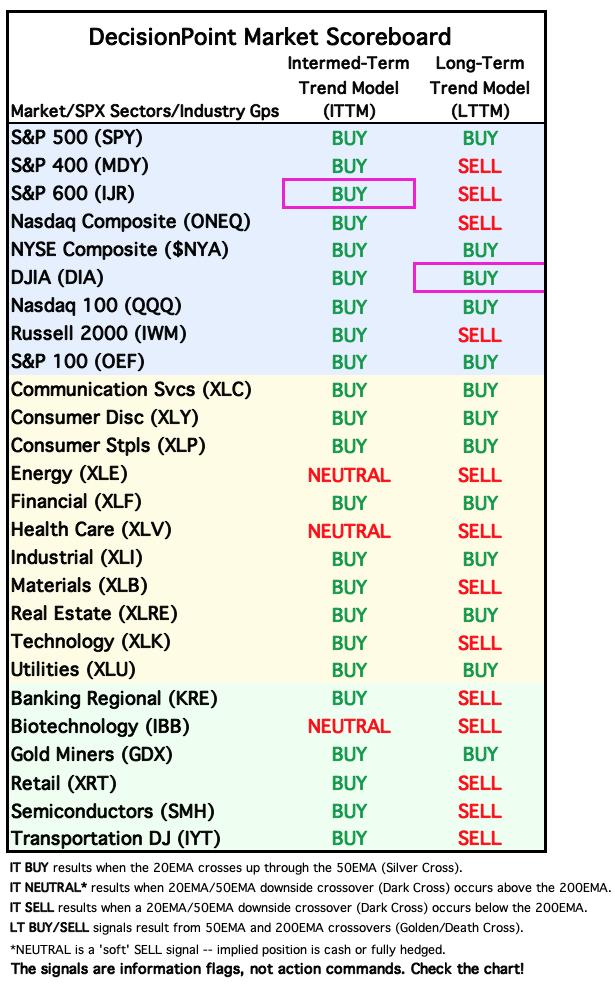
Today the Dow Jones Industrial Average ETF (DIA) 50-day EMA crossed up through the 200-day EMA (Golden Cross), generating an LT Trend Model BUY Signal. DIA has not been performing as well as the SPY, but it is on a good rally. We do have overhead resistance nearing, but with such robust participation readings, it likely has further to go to the up side. Stochastics are camped out above 80 indicating excellent internal strength.
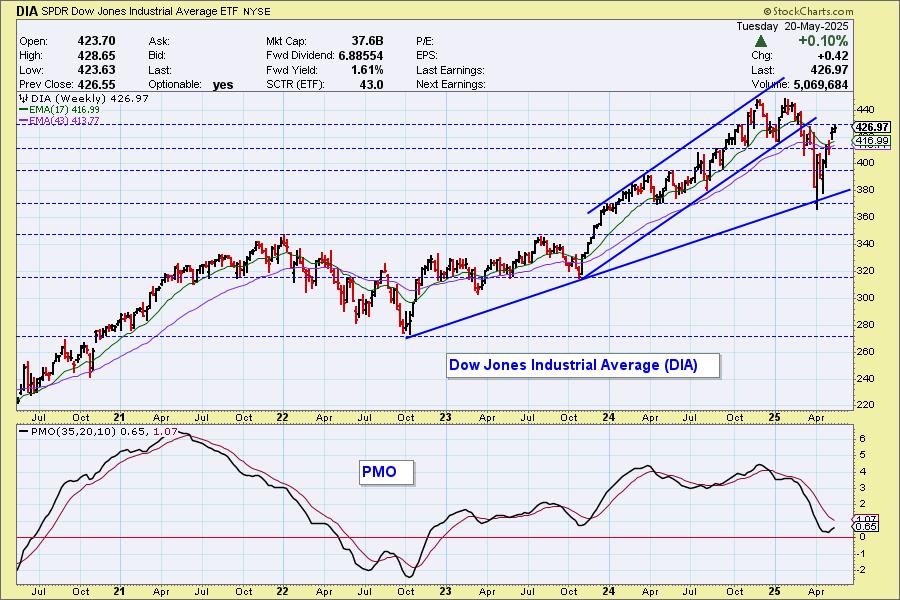
Price bounced off the rising bottoms trendline and appears ready to move up to all-time highs. The weekly PMO is confirming this.
__________
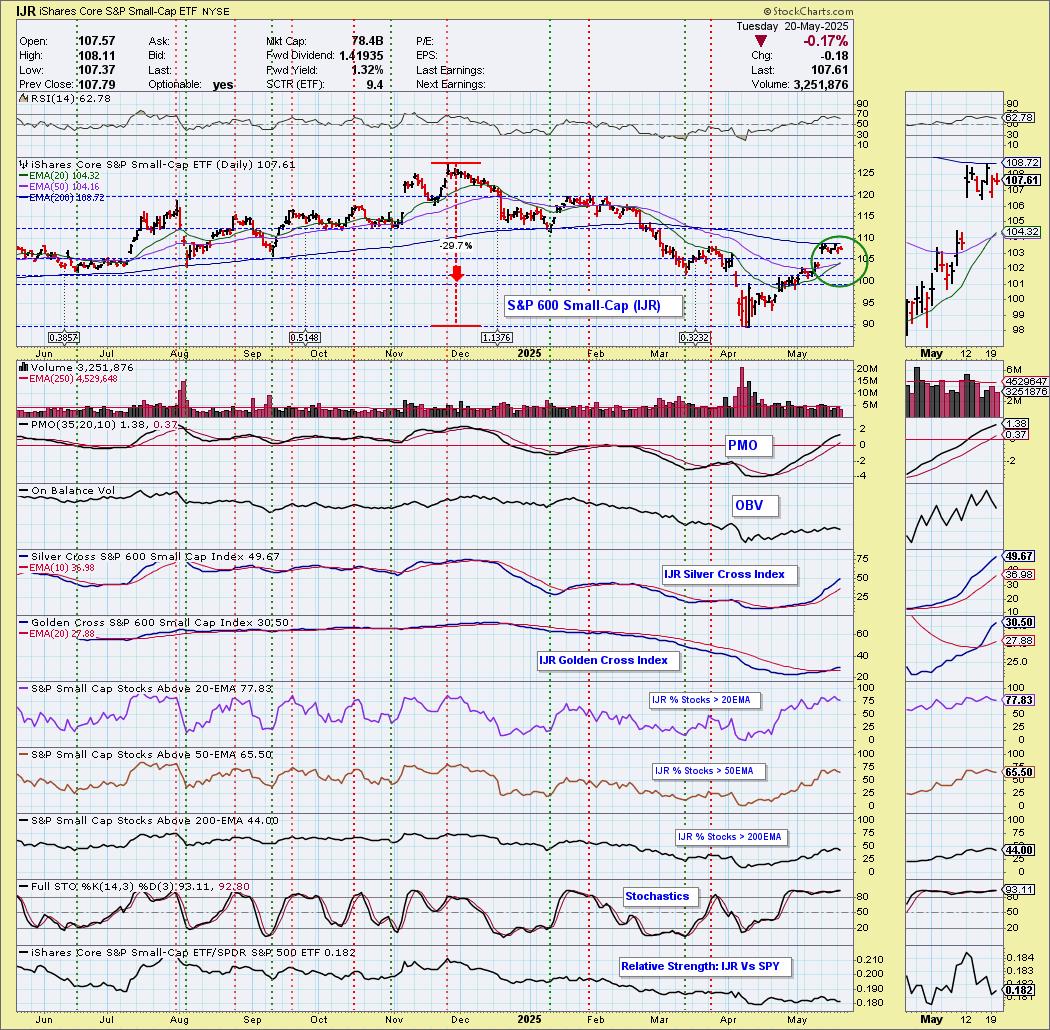
Today the S&P 600 Small-Cap Index ETF (IJR) 20-day EMA crossed up through the 50-day EMA (Silver Cross) generating an IT Trend Model BUY Signal. IJR is performing in line with the SPY right now, but it is very far away from its all-time highs. Participation is still very strong and the Golden and Silver Cross Indexes look very bullish. Stochastics are hovering above 80 indicating internal strength. We should see price get over resistance at the 200-day EMA.
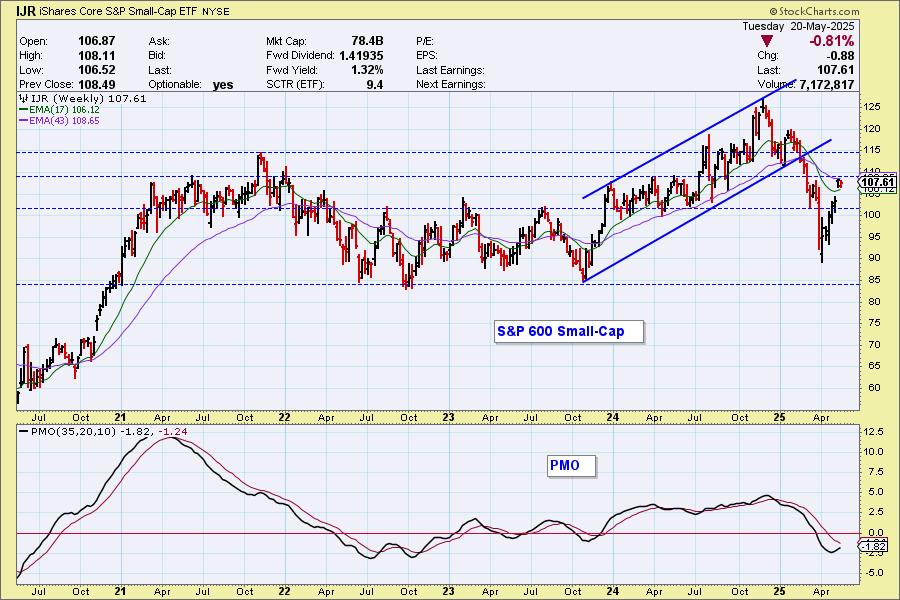
IJR did not preserve its rising trend, but this bullish "V" Bottom suggests we will see price move much higher. We also have the weekly PMO confirming this with its rise.
The DecisionPoint Alert Weekly Wrap presents an end-of-week assessment of the trend and condition of the Stock Market, the U.S. Dollar, Gold, Crude Oil, and Bonds. The DecisionPoint Alert daily report (Monday through Thursday) is abbreviated and gives updates on the Weekly Wrap assessments.
MARKET/INDUSTRY GROUP/SECTOR INDEXES
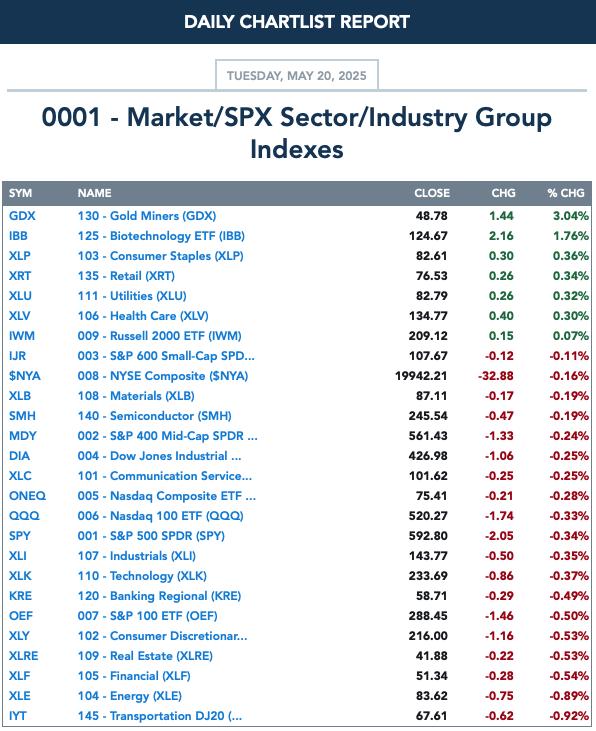
CLICK HERE for Carl's annotated Market Index, Sector, and Industry Group charts.
THE MARKET (S&P 500)
IT Trend Model: NEUTRAL as of 3/4/2025
LT Trend Model: SELL as of 4/16/2025
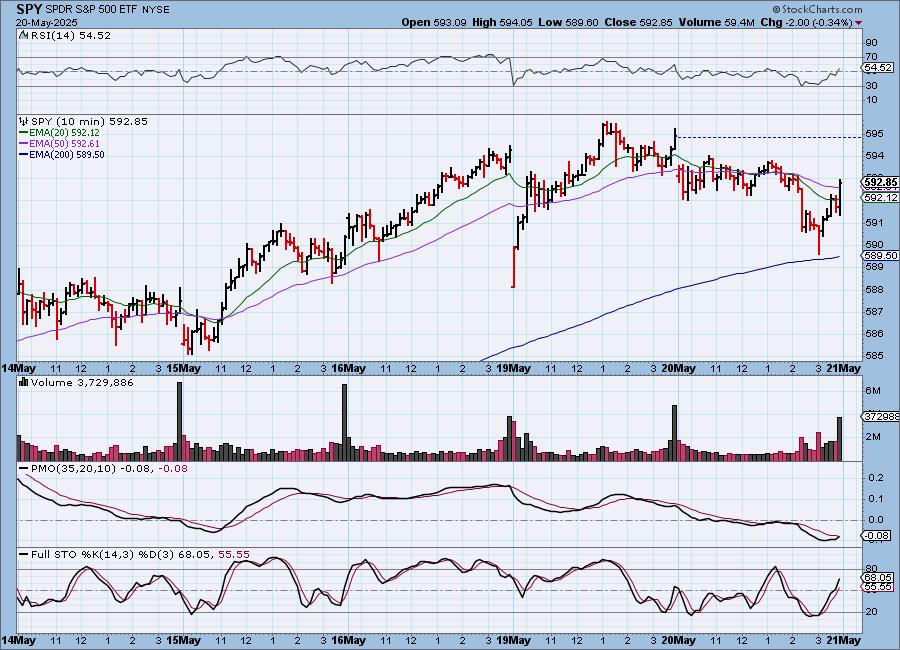
SPY 10-Minute Chart: It was a down day from start to finish but we did see a nice thrust higher to finish trading. This pushed the 10-minute PMO back up into a Crossover BUY Signal. Stochastics are rising strongly so we could see a rally to start trading tomorrow.
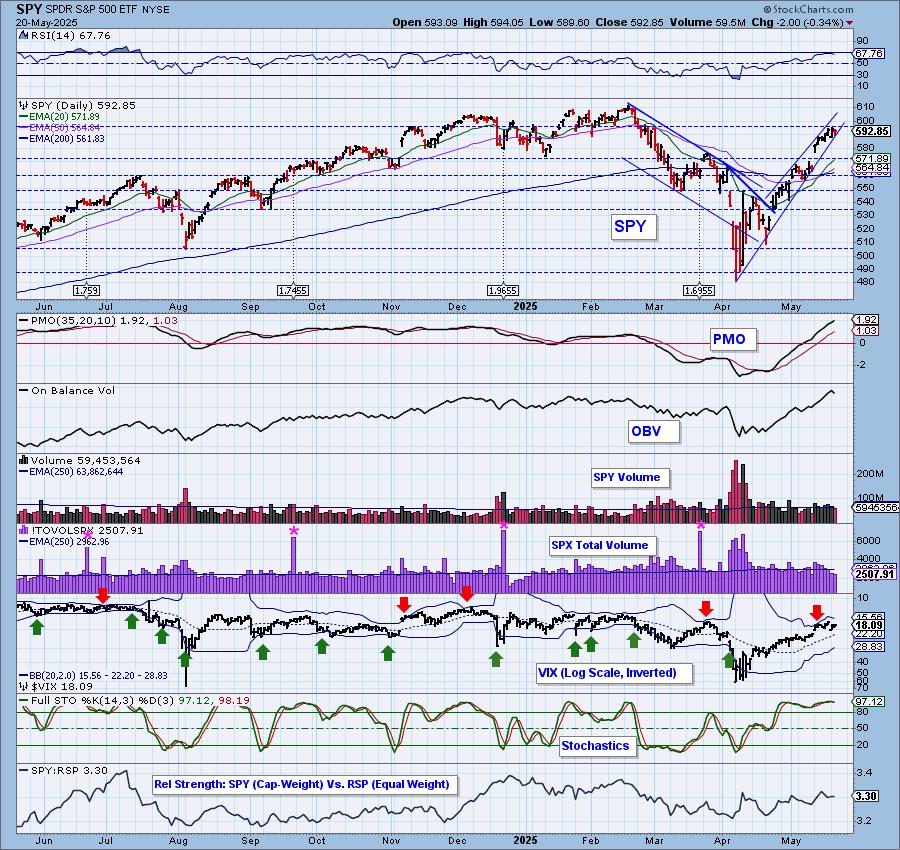
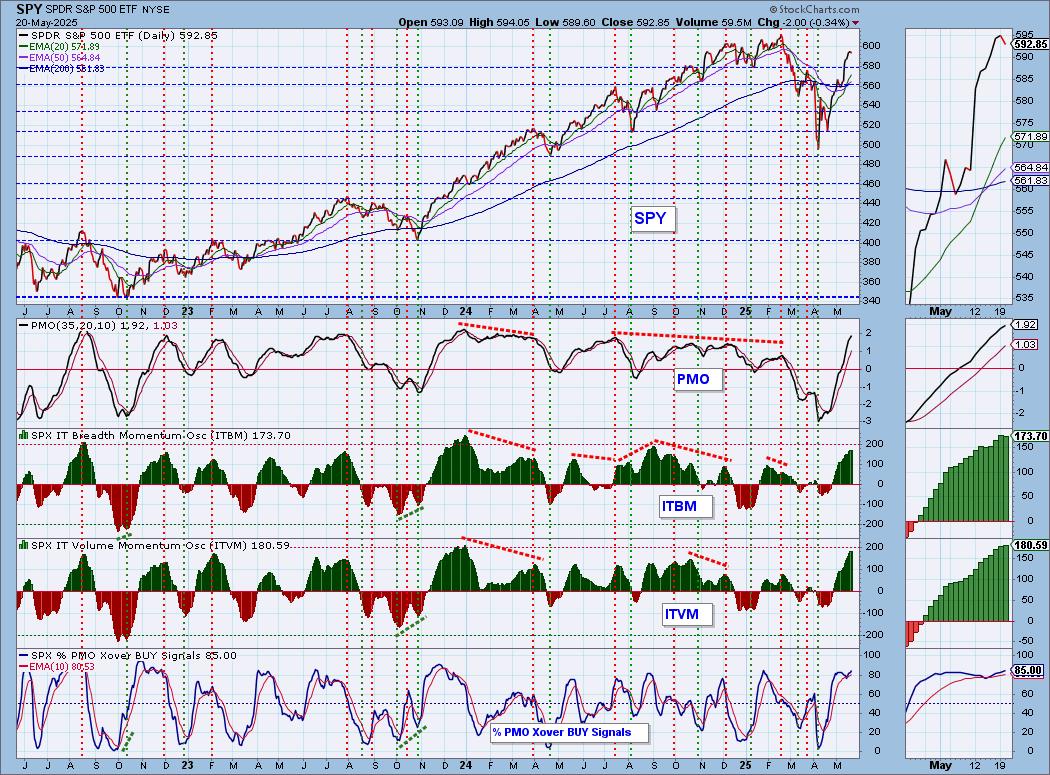
SPY Daily Chart: There is a bearish rising wedge on the SPY right now that does imply this rising trend will be compromised soon. Today's decline could be the harbinger. The PMO still looks very bullish and right now price isn't that overbought based on the RSI being below 70.
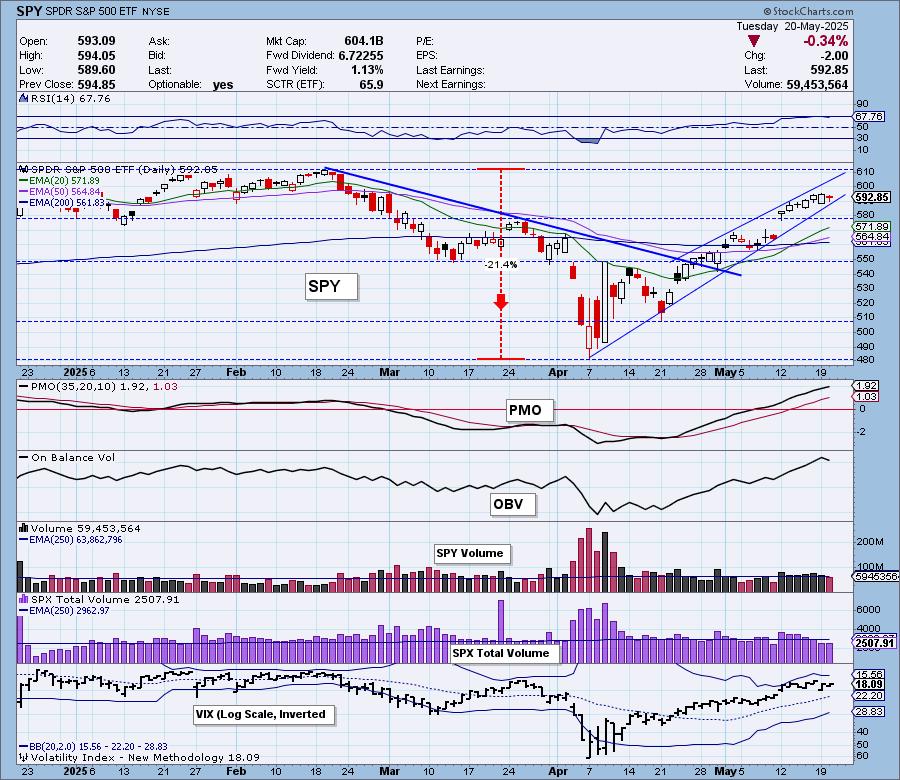
The VIX looks comfortable above its moving average on the inverted scale which is good for the market, but it does look a bit toppy. Stochastics are very strong above 80 so internal strength is available.
S&P 500 New 52-Week Highs/Lows: New Highs pared back which is not unexpected on a decline, but we do note they are angling lower while price is angling higher. That's a negative divergence. On the positive side, there were no New Lows and the High-Low Differential is still rising.
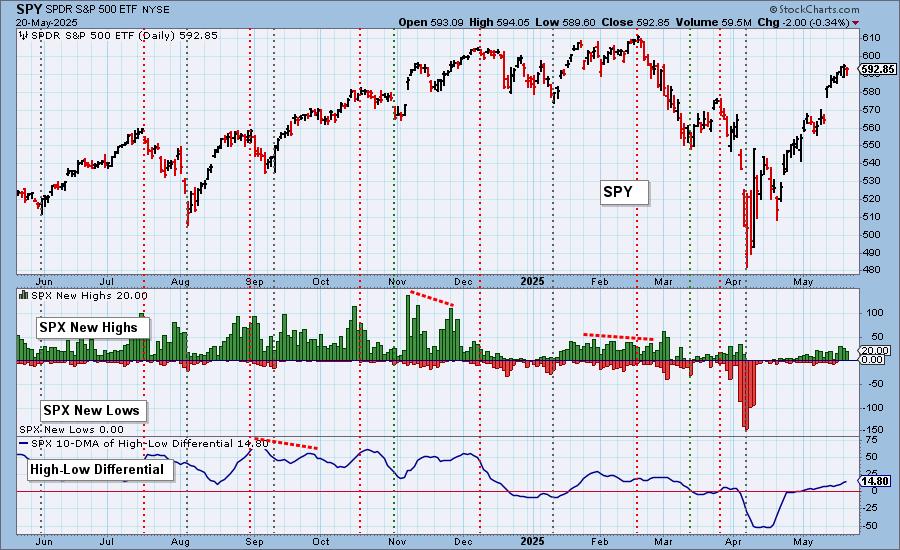
Climax* Analysis: There were no climax readings today. SPX Total Volume was again very low suggesting little conviction on this decline.
*A climax is a one-day event when market action generates very high readings in, primarily, breadth and volume indicators. We also include the VIX, watching for it to penetrate outside the Bollinger Band envelope. The vertical dotted lines mark climax days -- red for downside climaxes, and green for upside. Climaxes are at their core exhaustion events; however, at price pivots they may be initiating a change of trend.
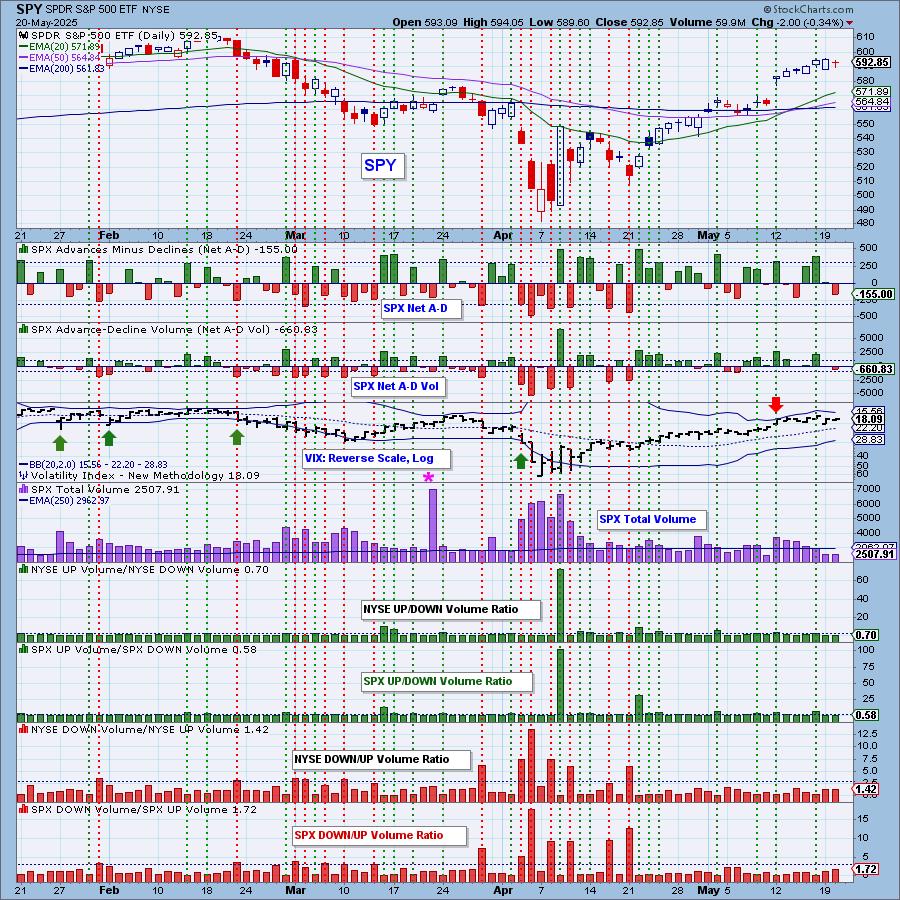
Short-Term Market Indicators: The short-term market trend is UP and the condition is SOMEWHAT OVERBOUGHT.
The big problem we've identified on the Swenlin Trading Oscillators (STOs) are negative divergences with price. Both are also in decline suggesting more downside ahead. Participation lost some ground which is to be expected. We also lost some rising PMOs. Both indicators are still at very healthy levels.
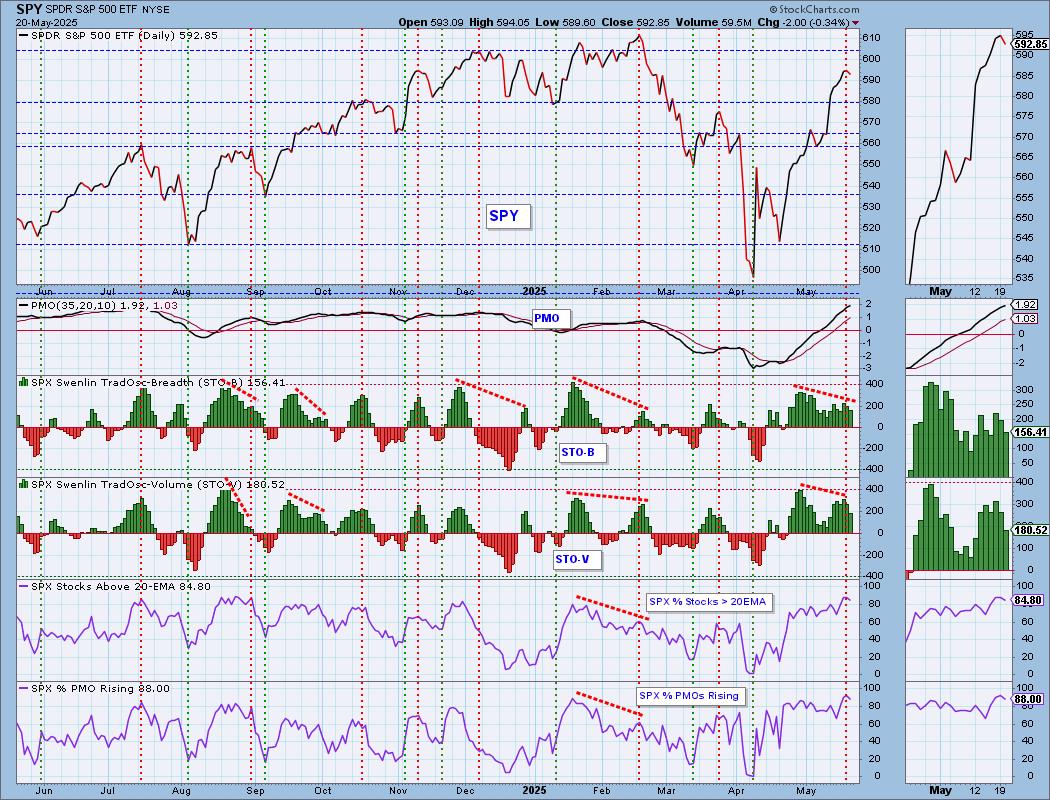
Intermediate-Term Market Indicators: The intermediate-term market trend is UP and the condition is OVERBOUGHT.
The ITBM topped today in very overbought territory which is a bad sign. At the same time at least the ITVM is still rising and we did see a few more PMO BUY Signals come in.
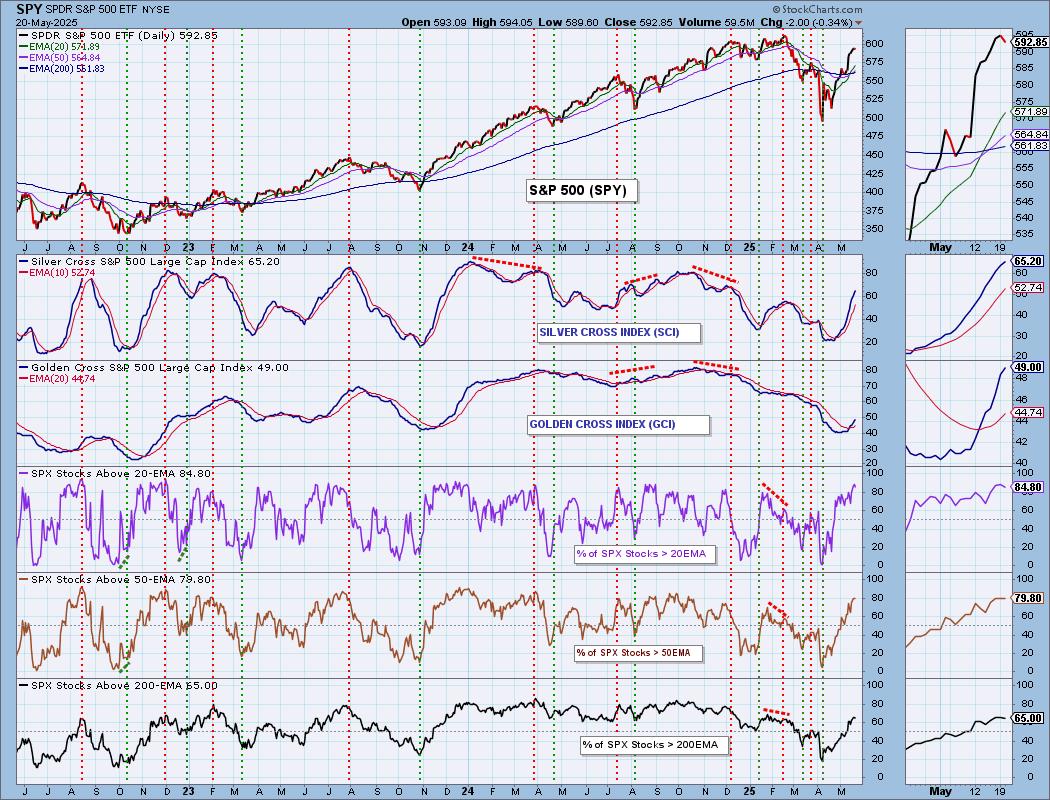
PARTICIPATION CHART (S&P 500): The following chart objectively shows the depth and trend of participation for the SPX in two time frames.
- Intermediate-Term - the Silver Cross Index (SCI) shows the percentage of SPX stocks on IT Trend Model BUY signals (20-EMA > 50-EMA). The opposite of the Silver Cross is a "Dark Cross" -- those stocks are, at the very least, in a correction.
- Long-Term - the Golden Cross Index (GCI) shows the percentage of SPX stocks on LT Trend Model BUY signals (50-EMA > 200-EMA). The opposite of a Golden Cross is the "Death Cross" -- those stocks are in a bear market.
The market bias is BULLISH in the intermediate and long terms.
Participation of stocks above their 20/50-day EMAs are getting overbought, particularly %Stocks > 20EMA. This could pose a problem, but for now it is sign of strength in this market. The Silver Cross Index is rising strongly and is above its signal line so the IT Bias is BULLISH. The Golden Cross Index is almost above our bullish 50% threshold. It is not at all overbought right now. The Golden Cross Index is above its signal line so the LT Bias is BULLISH.
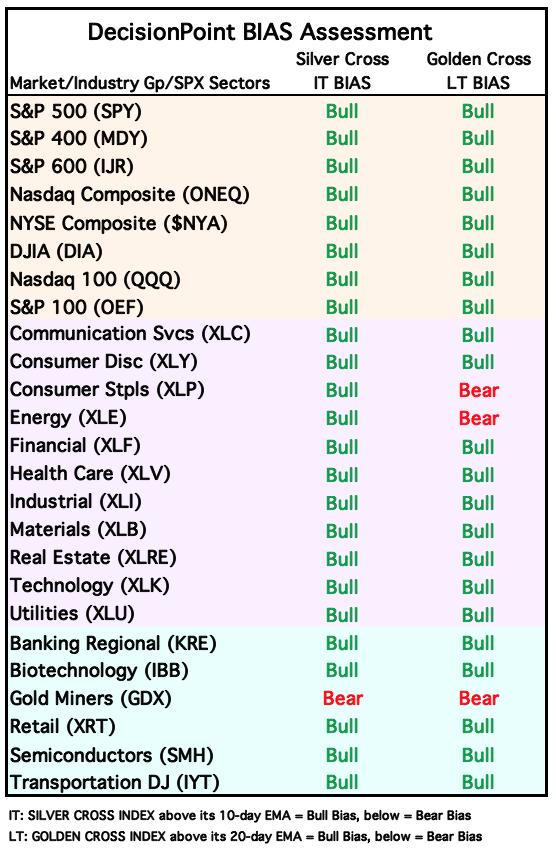
BIAS Assessment: The following table expresses the current BIAS of various price indexes based upon the relationship of the Silver Cross Index to its 10-day EMA (intermediate-term), and of the Golden Cross Index to its 20-day EMA (long-term). When the Index is above the EMA it is bullish, and it is bearish when the Index is below the EMA. The BIAS does not imply that any particular action should be taken. It is information to be used in the decision process.
The items with highlighted borders indicate that the BIAS changed today.
*****************************************************************************************************
CONCLUSION: We are starting to see some cracks in the foundation with new negative divergences and falling STOs. We also are seeing some overbought conditions with participation. The rally has run hot for some time and is definitely in need of a decline. Price isn't as overbought as it could be, but it is close based on the RSI. The 10-minute bar chart does suggest that we could see some rally to start off trading tomorrow, but we would start looking for some decline. As we continue to say, with participation so strong and our Bias Table and Signal Table very green, we aren't expecting a deep decline at this time, but it isn't a bad idea to evaluate stop levels.
Erin is 70% long, 0% short. (This is intended as information, not a recommendation.)
*****************************************************************************************************
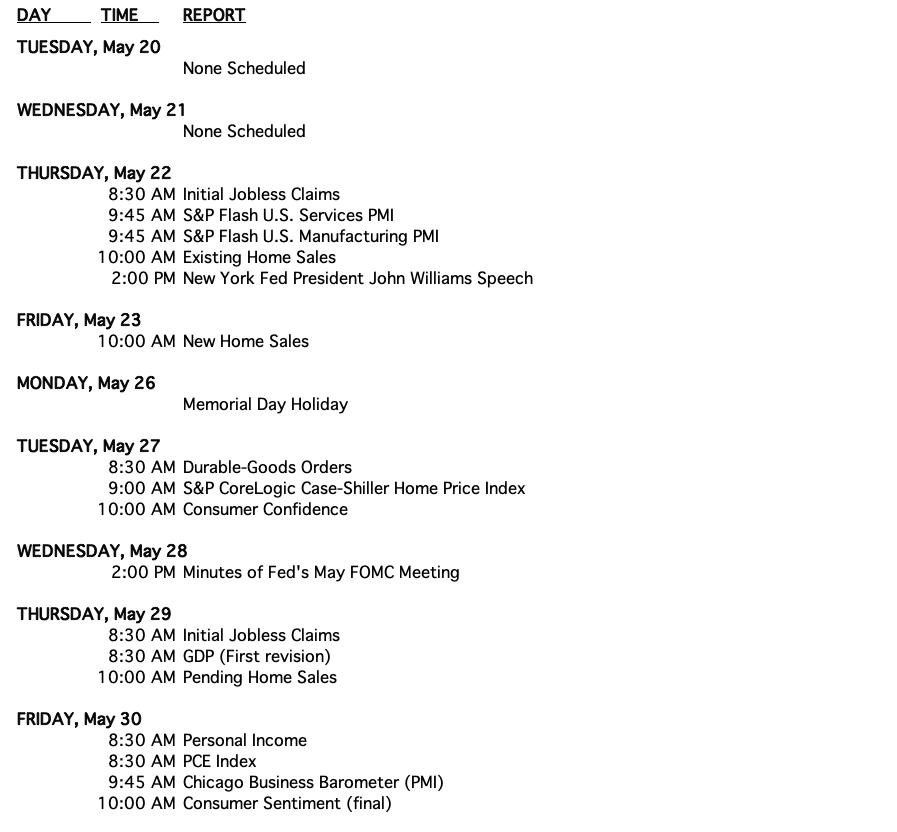
CALENDAR
BITCOIN
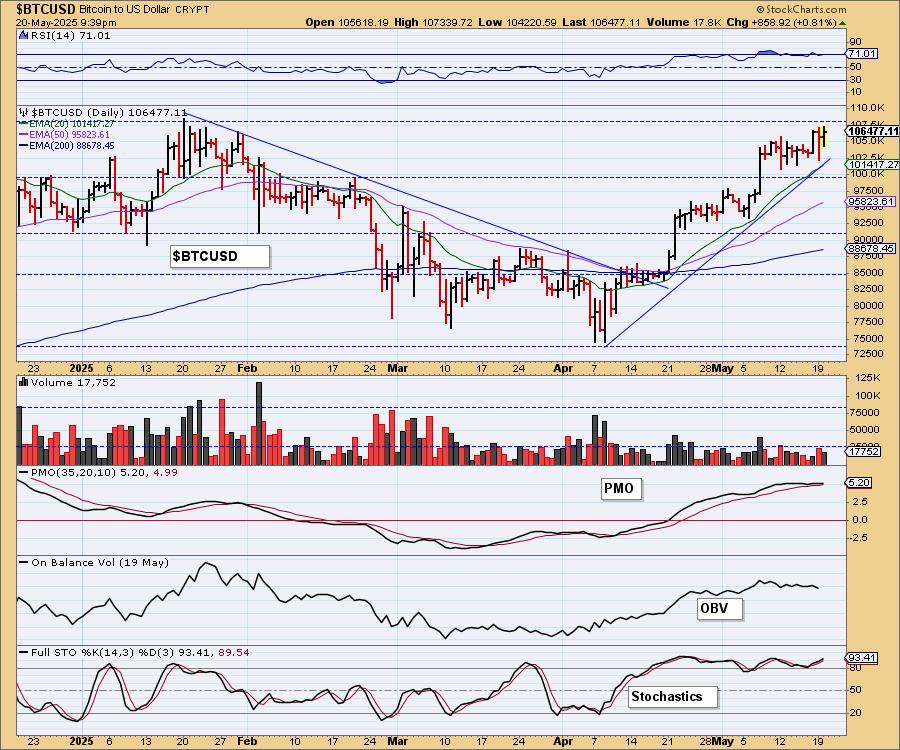
Bitcoin looks very bullish right now on its rising trend. Price appears to be bouncing off that rising bottoms trendline right now. The PMO has flattened, but hasn't topped yet. Stochastics look very bullish as they hold above 80. We're looking for all-time highs to be met.
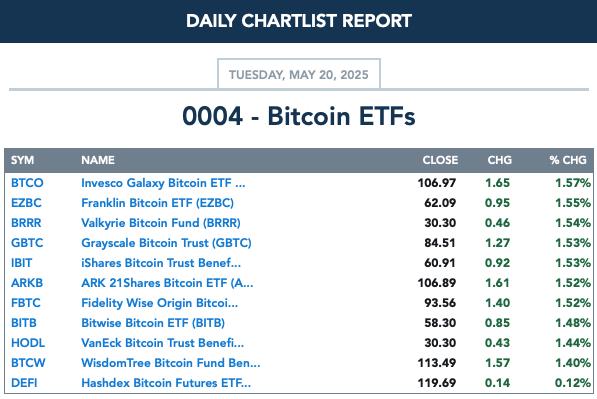
BITCOIN ETFs
INTEREST RATES
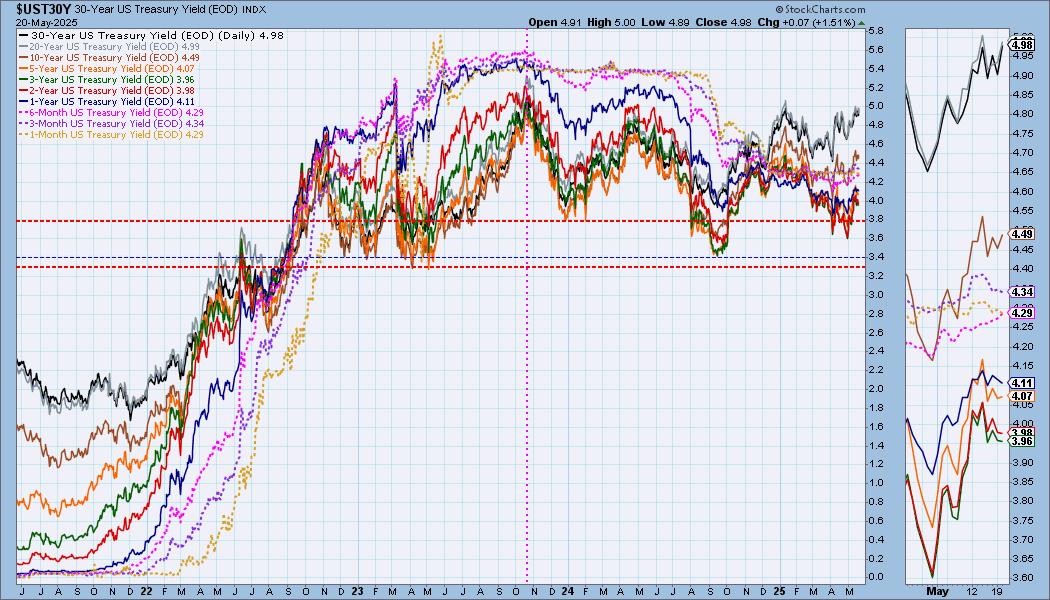
Yields were mixed on the day. At this point we are bullish on yields in general. They are getting close to overhead resistance and that could be a problem, but for now the rising trends are what we're watching.
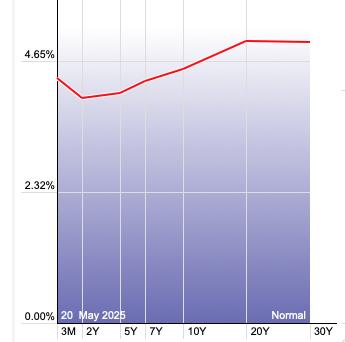
The Yield Curve Chart from StockCharts.com shows us the inversions taking place. The red line should move higher from left to right. Inversions are occurring where it moves downward.
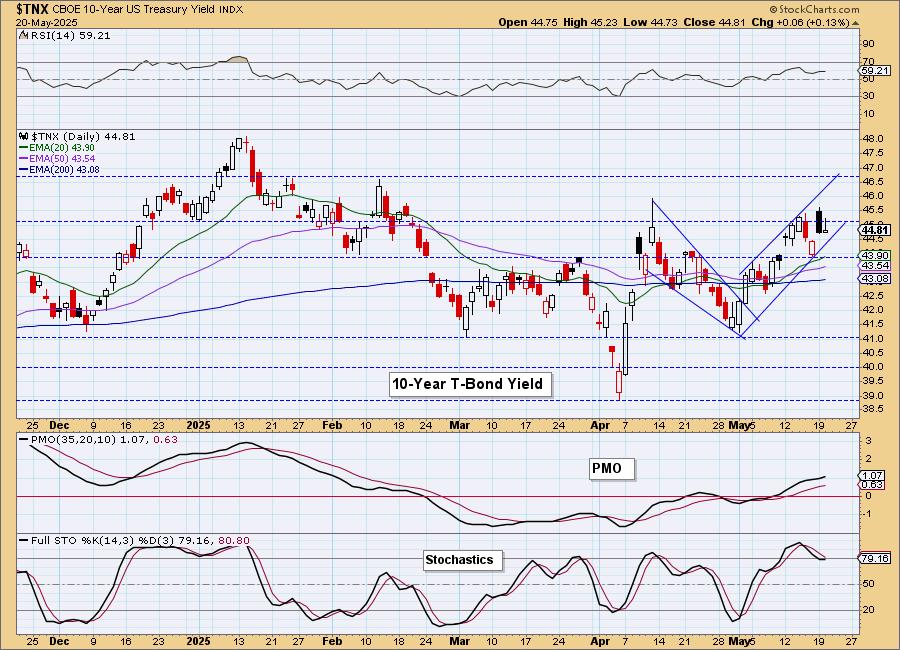
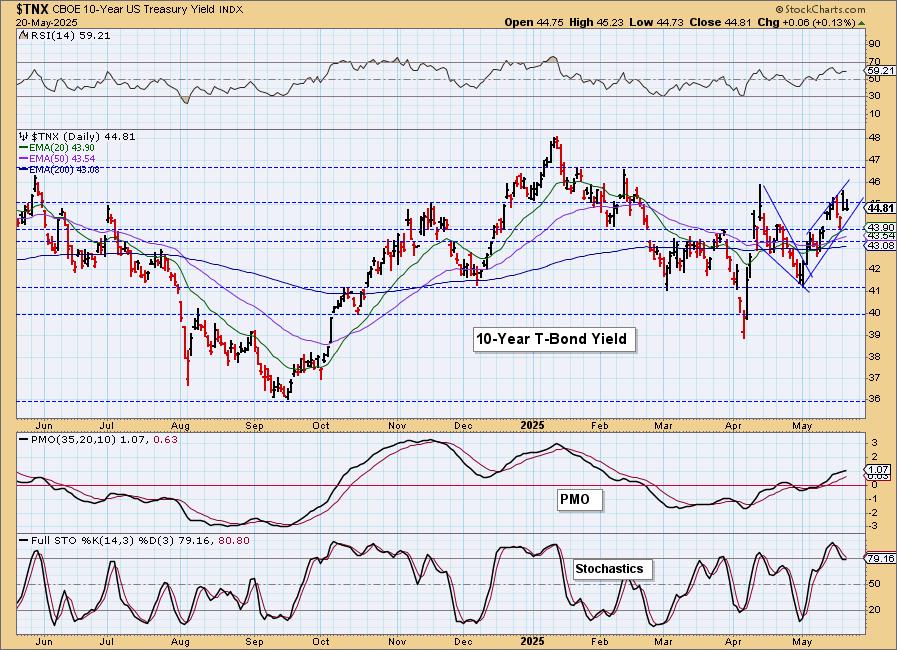
10-YEAR T-BOND YIELD
It actually turns out that we have a bearish rising wedge, but it is almost a rising trend channel. Still this does make us a bit bearish on $TNX as the pattern does call for a breakdown. Stochastics are turning up so maybe it will avoid the breakdown after all.
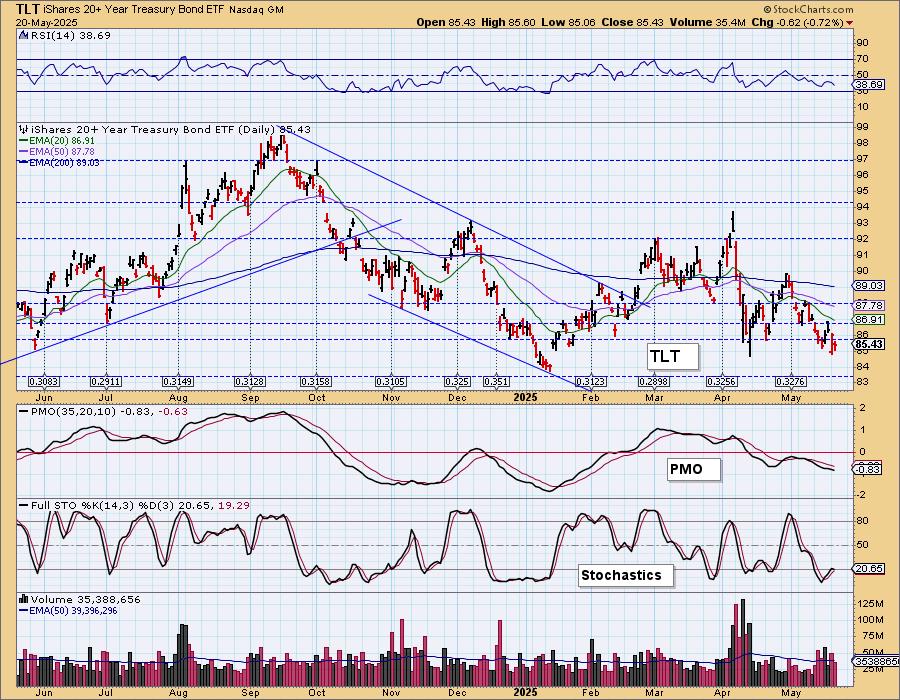
BONDS (TLT)
IT Trend Model: SELL as of 4/14/2025
LT Trend Model: SELL as of 12/13/2024
TLT Daily Chart: Bonds are testing support right now. We suspect it will hold here, but ultimately we are looking for yields to move higher so this support zone is quite vulnerable right now. The PMO is in decline and the RSI is negative. Stochastics have also topped so we should look for a breakdown not a bounce off this support level.
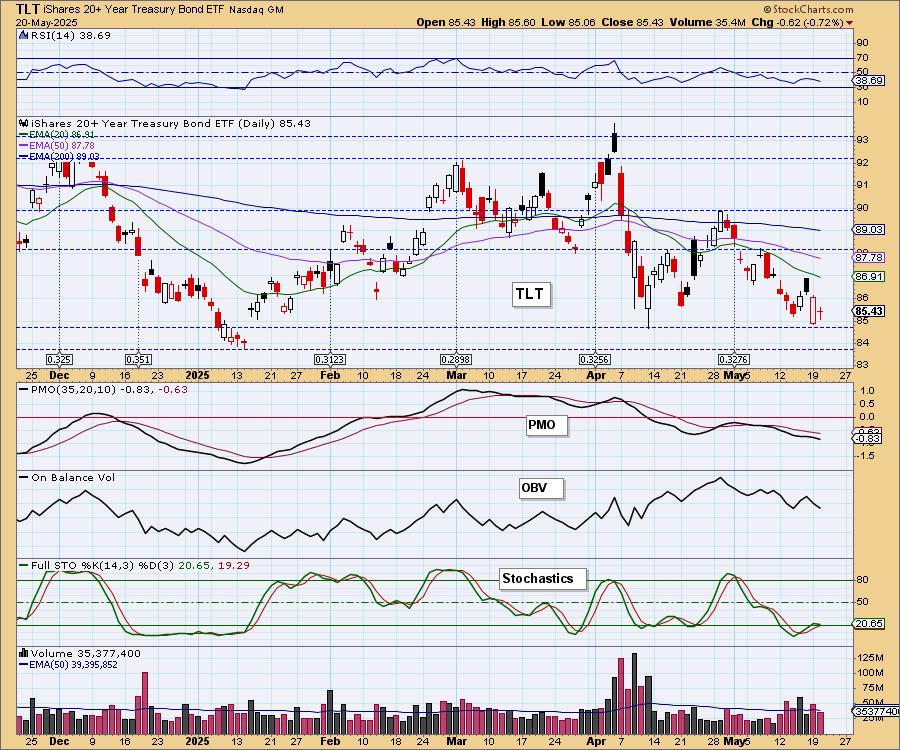
The strongest level of support lies close to 83.
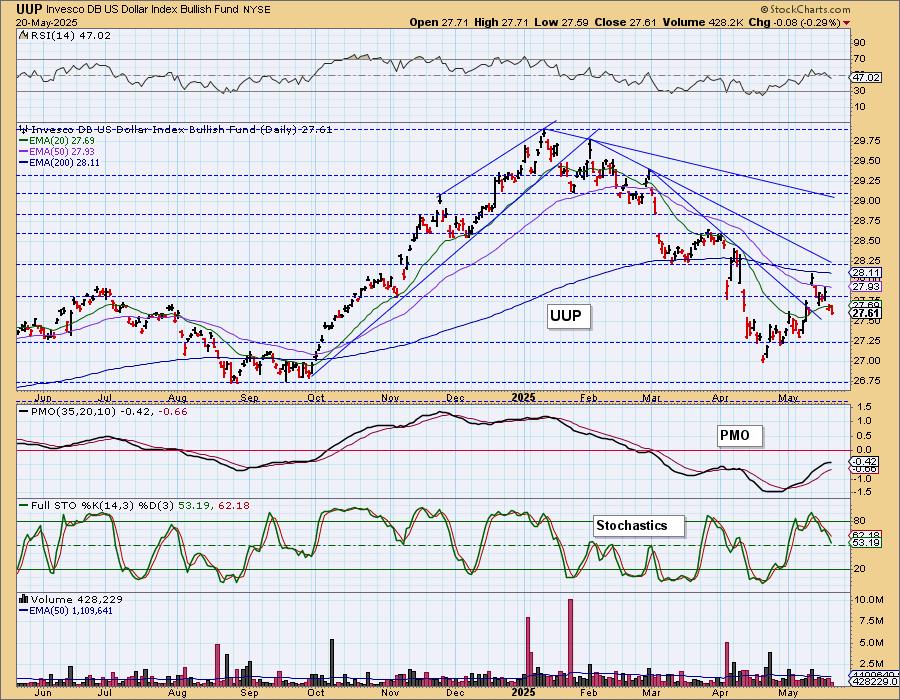
DOLLAR (UUP)
IT Trend Model: NEUTRAL as of 3/5/2025
LT Trend Model: SELL as of 4/25/2025
UUP Daily Chart: The Dollar hasn't lost its rising trend, but it sure is acting like it will break down further. Support has been reached and it could hold here given the PMO is still technically rising. However, the RSI and Stochastics look very bearish. We think this level of support will be broken.
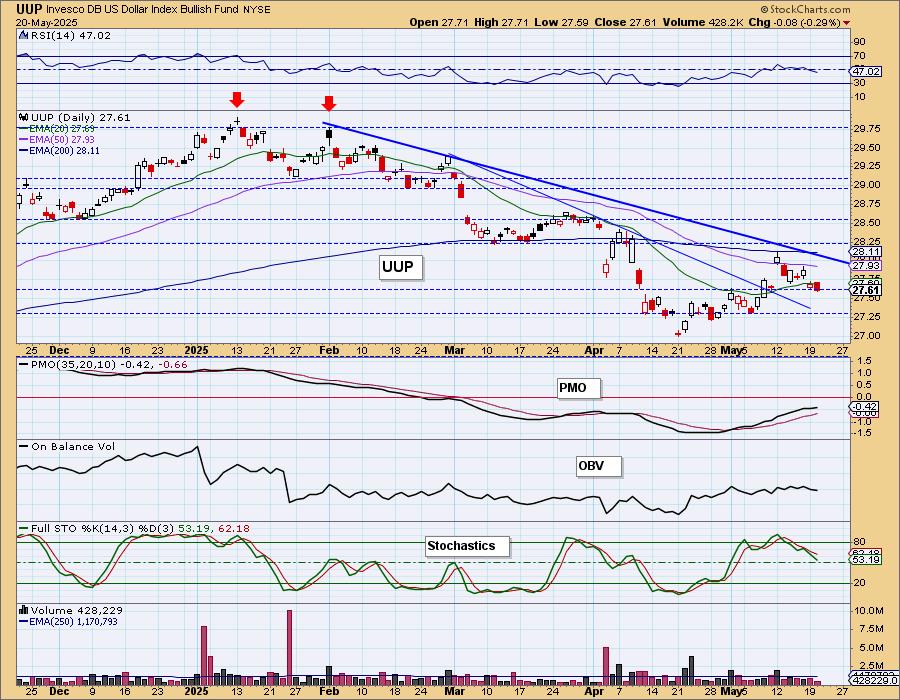
Price failed at the 200-day EMA and retreated. The rising trend is very vulnerable.
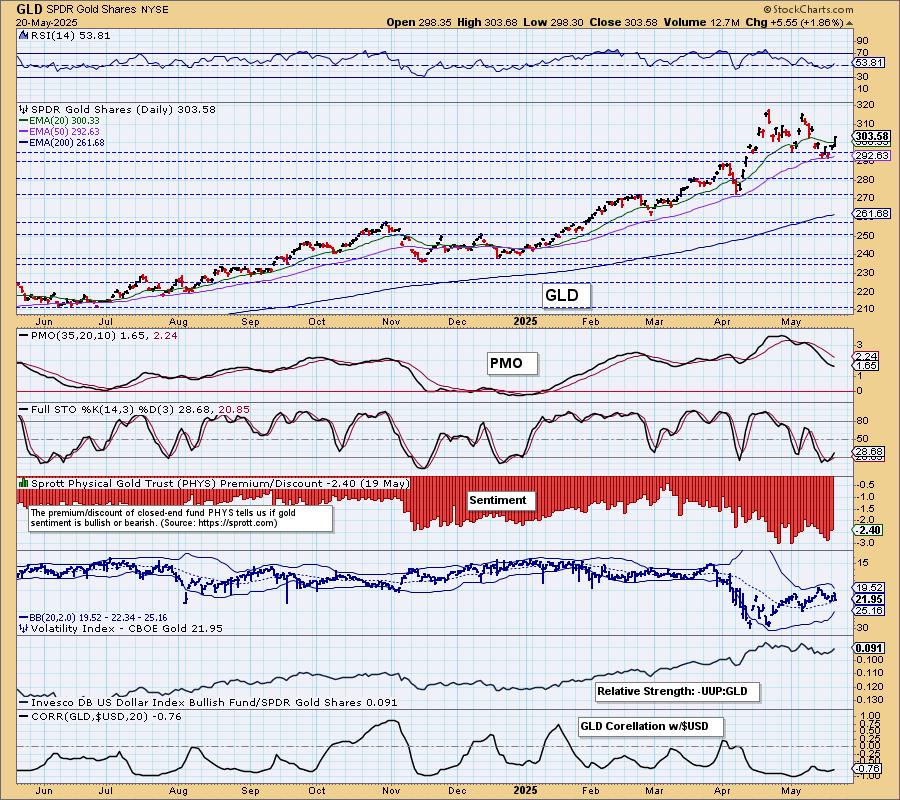
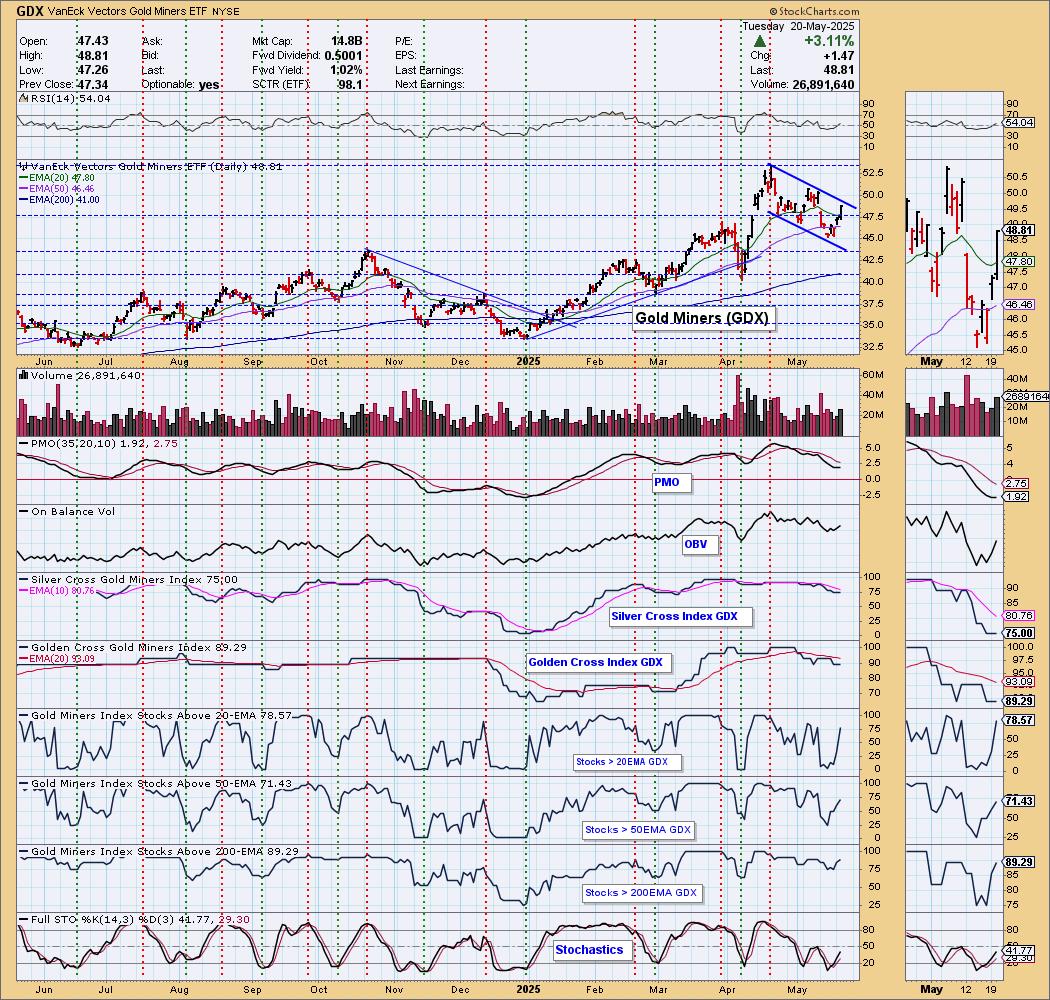
GOLD
IT Trend Model: BUY as of 1/10/2025
LT Trend Model: BUY as of 10/20/2023
GLD Daily Chart: Gold is taking advantage of weakness in the Dollar. It is in a bearish declining trend channel, but we think it will make its way back to the top. We are actually thinking we could get a breakout there. Since it technically is in a declining trend, we don't want to get too bullish, but this is a good sign especially given Stochastics are rising again.
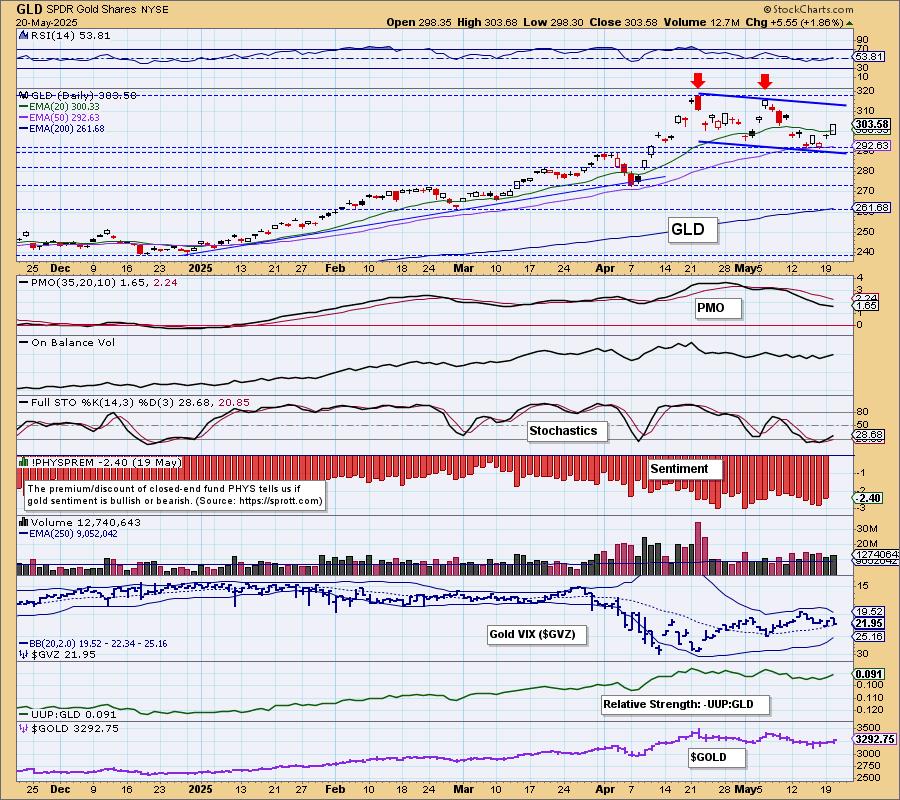
Discounts have hit extreme levels and that often times is good for Gold as it means we have very bearish investors. The correlation between Gold and the Dollar is very negative so a weak Dollar will be good for Gold. The Dollar hasn't broken down yet, so we don't want to get too bullish here.
GOLD MINERS (GDX) Daily Chart: Gold Miners are also in a declining trend channel. They've hit the top so the expectation will be a decline back to the bottom of the channel. The PMO hasn't turned up yet, but we do see that participation has healed immensely. Stochastics are rising again. Gold is mildly bullish right now so there is a chance we'll get a breakout here.
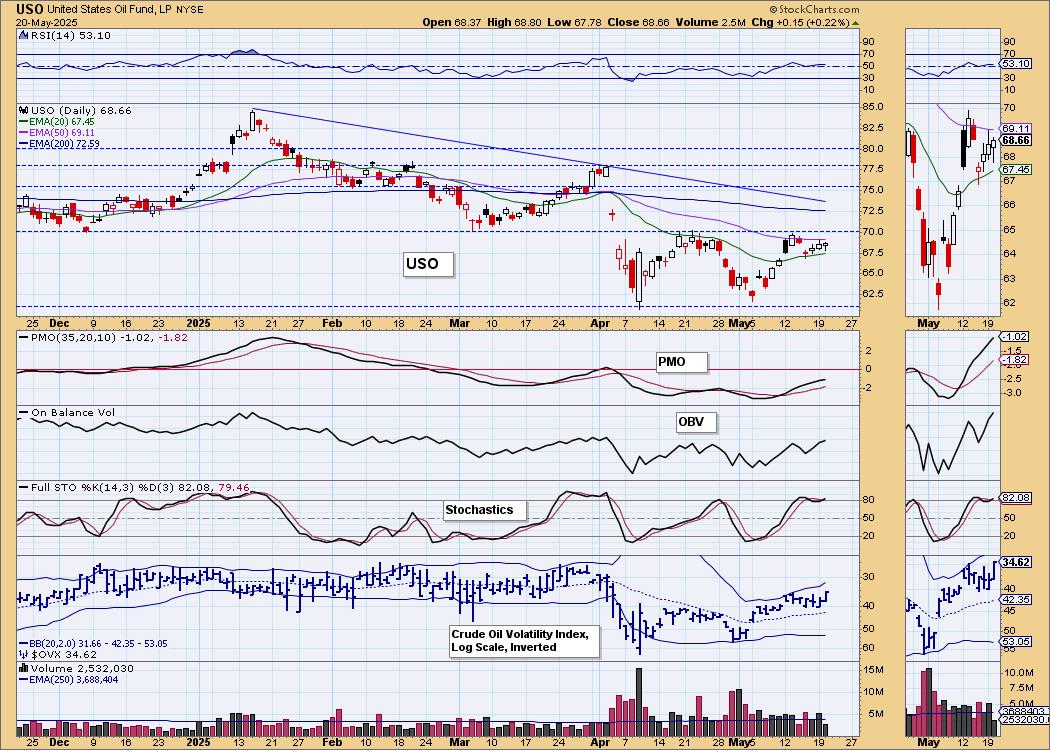
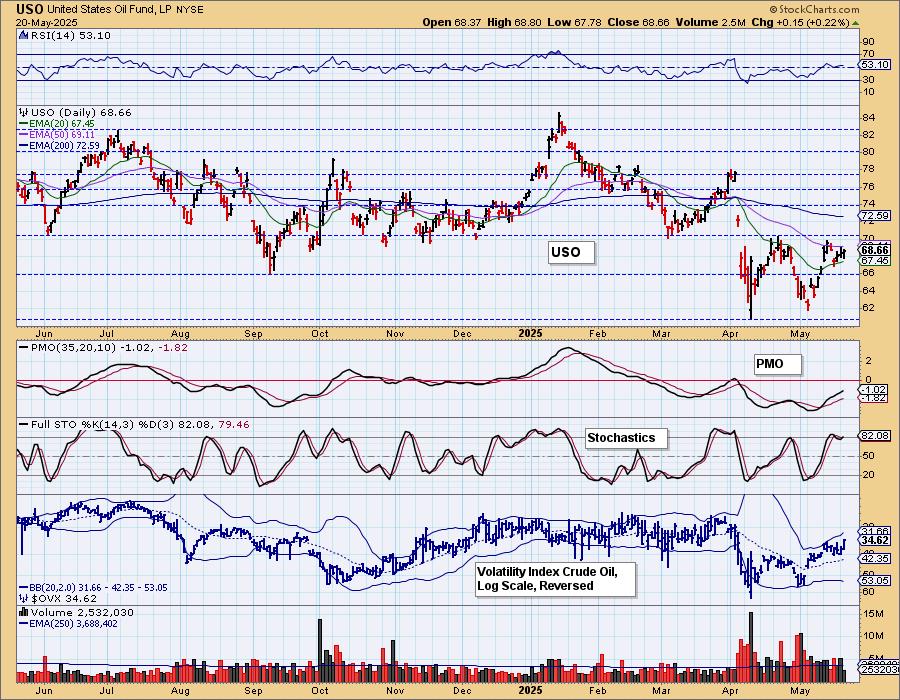
CRUDE OIL (USO)
IT Trend Model: NEUTRAL as of 2/27/2025
LT Trend Model: SELL as of 3/18/2025
USO Daily Chart: Yesterday's comments still apply:
"Crude is making another run at overhead resistance. The RSI and PMO are positive and Stochastics are turning up already. Fundamentally with production levels staying high, price should stay beneath resistance. If we do get a breakout, it will confirm the bullish double bottom. For now we think it will continue to struggle beneath resistance."
Good Luck & Good Trading!
Erin Swenlin and Carl Swenlin
Technical Analysis is a windsock, not a crystal ball. --Carl Swenlin
(c) Copyright 2025 DecisionPoint.com
Disclaimer: This blog is for educational purposes only and should not be construed as financial advice. The ideas and strategies should never be used without first assessing your own personal and financial situation, or without consulting a financial professional. Any opinions expressed herein are solely those of the author, and do not in any way represent the views or opinions of any other person or entity.
DecisionPoint is not a registered investment advisor. Investment and trading decisions are solely your responsibility. DecisionPoint newsletters, blogs or website materials should NOT be interpreted as a recommendation or solicitation to buy or sell any security or to take any specific action.
NOTE: The signal status reported herein is based upon mechanical trading model signals, specifically, the DecisionPoint Trend Model. They define the implied bias of the price index based upon moving average relationships, but they do not necessarily call for a specific action. They are information flags that should prompt chart review. Further, they do not call for continuous buying or selling during the life of the signal. For example, a BUY signal will probably (but not necessarily) return the best results if action is taken soon after the signal is generated. Additional opportunities for buying may be found as price zigzags higher, but the trader must look for optimum entry points. Conversely, exit points to preserve gains (or minimize losses) may be evident before the model mechanically closes the signal.
Helpful DecisionPoint Links:
DecisionPoint Alert Chart List
DecisionPoint Golden Cross/Silver Cross Index Chart List
DecisionPoint Sector Chart List
Price Momentum Oscillator (PMO)