
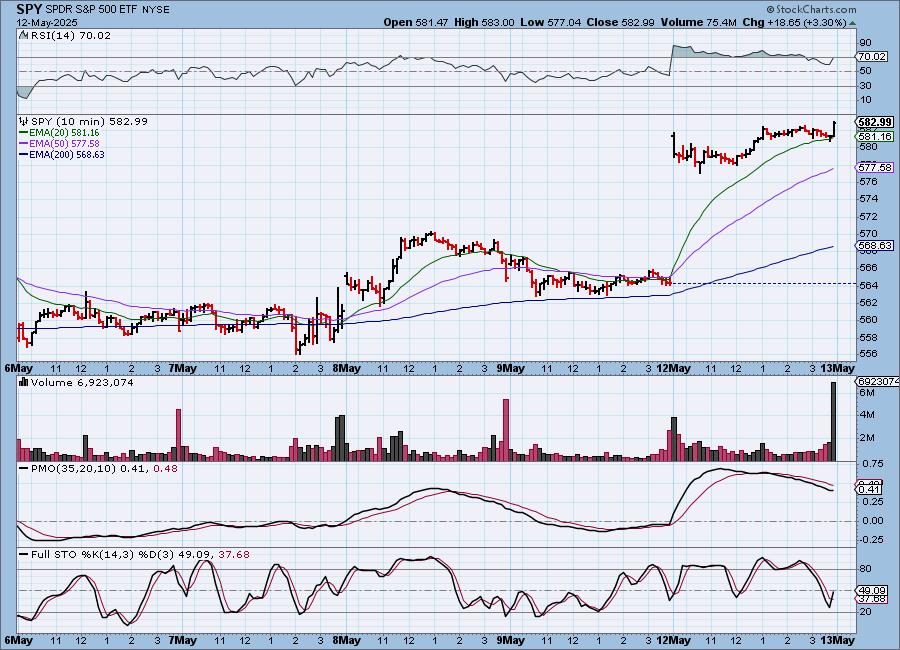
Over the weekend, the Trump administration made good progress in trade negotiations with China, increasing investor confidence that an agreement will ultimately be reached. This resulted in today being an explosive up day. We should, however, keep in mind that a final agreement is far off, and that news of inevitable difficulties in the negotiations will probably result in some down days of similar magnitude. Nevertheless, at this point we are looking for a favorable resolution sometime later this year.
SPY 10-Minute Chart:
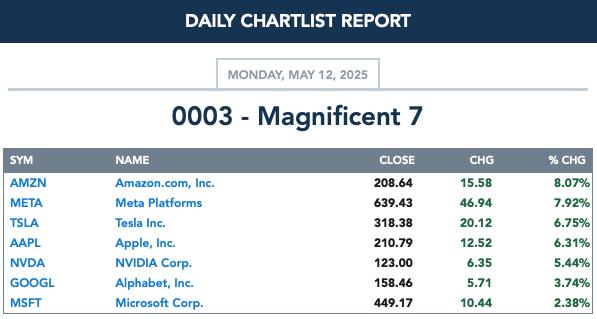
Of course, the Mag 7 had a lot to do with today's blast-off.
The DecisionPoint Alert Weekly Wrap presents an end-of-week assessment of the trend and condition of the Stock Market, the U.S. Dollar, Gold, Crude Oil, and Bonds. The DecisionPoint Alert daily report (Monday through Thursday) is abbreviated and gives updates on the Weekly Wrap assessments.
MARKET/INDUSTRY GROUP/SECTOR INDEXES
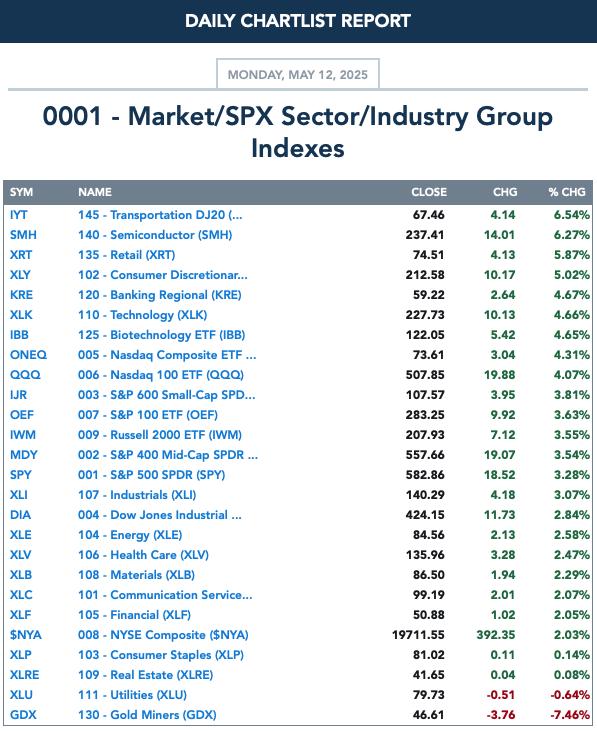
CLICK HERE for Carl's annotated Market Index, Sector, and Industry Group charts.
THE MARKET (S&P 500)
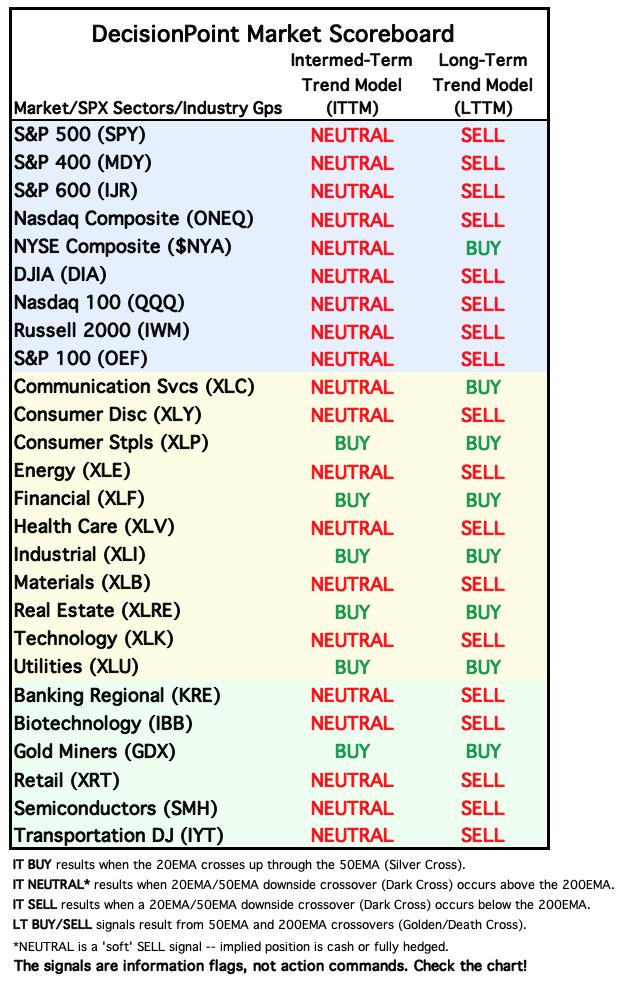
IT Trend Model: NEUTRAL as of 3/4/2025
LT Trend Model: SELL as of 4/16/2025
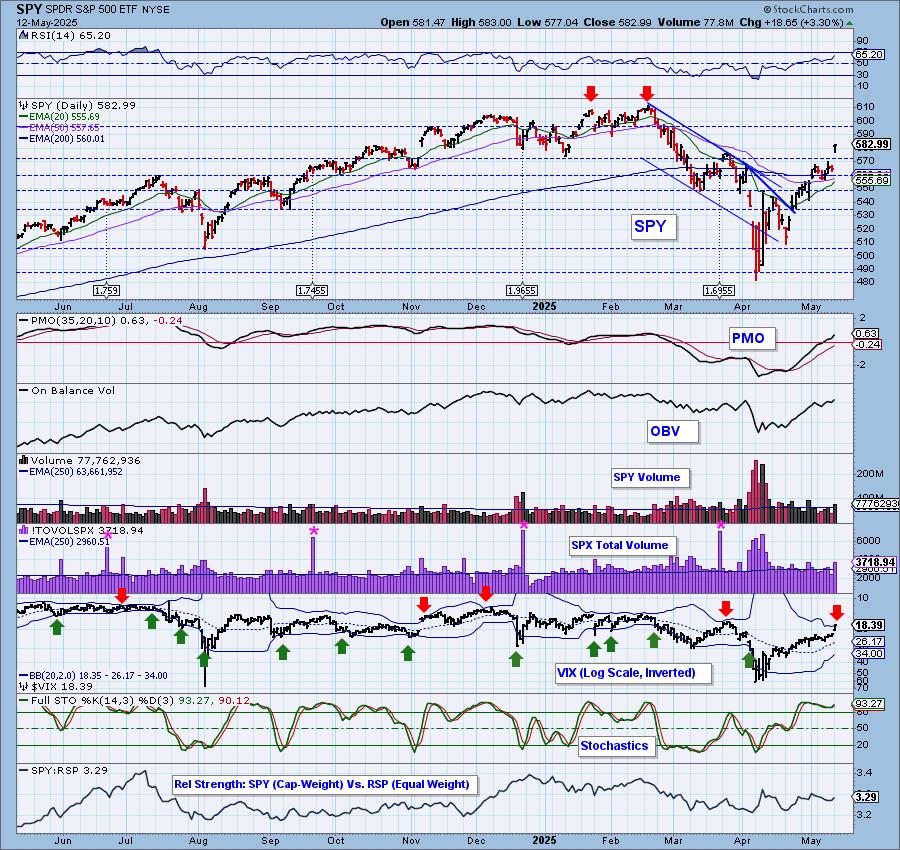
SPY Daily Chart: The gap up took price to the center of a resistance zone, leaving last week's consolidation in the dust. The RSI is not yet overbought so we could certainly see more upside from here. The PMO is accelerating higher.
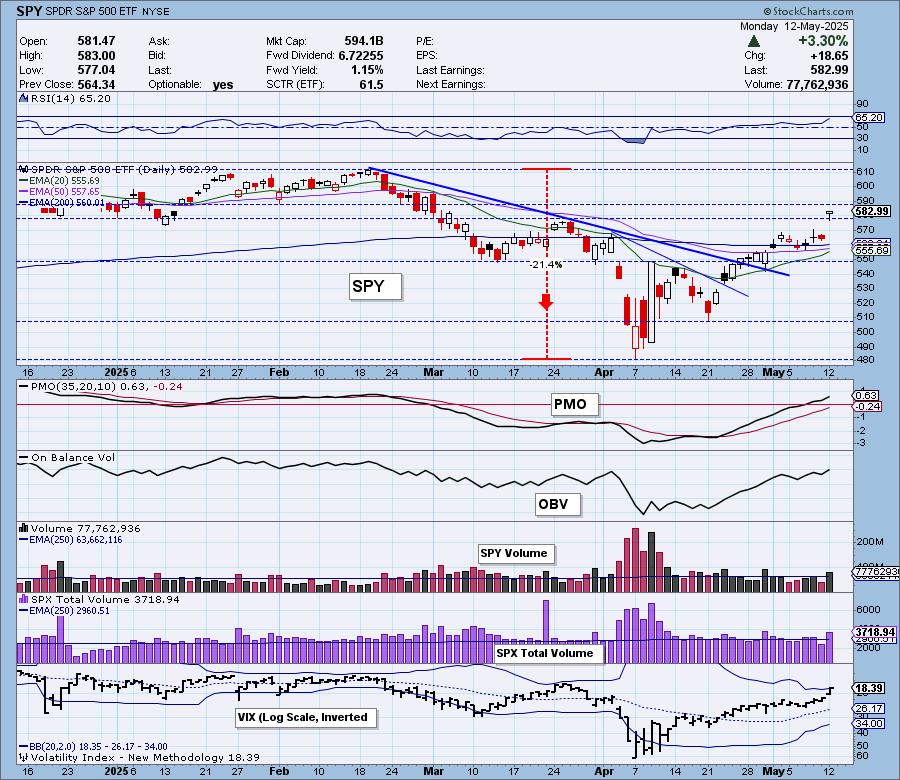
The VIX penetrated the upper Bollinger Band and this will often times lead to a downside reversal so we should apply caution. Stochastics are very bullish above 80.
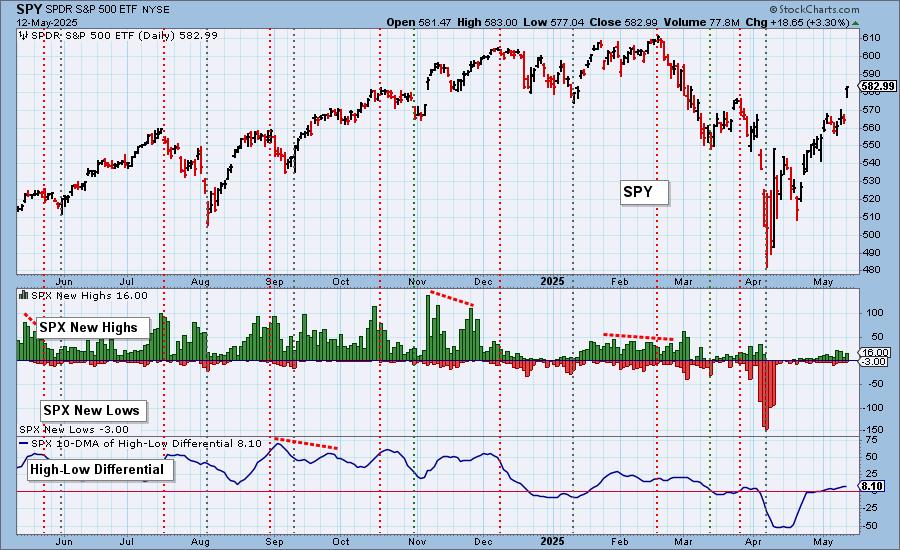
S&P 500 New 52-Week Highs/Lows: We didn't see as many New Highs as we would expect on such a forceful rally, but this is likely due to the giant correction that led into this rally. We saw a few New Lows. The High-Low Differential is rising gently above the zero line.
Climax* Analysis: Today there were unanimous climax readings on the four relevant indicators, giving us another upside exhaustion climax. SPX Total Volume was only 126% of the one-year daily average volume, which is solid but not blowoff volume.
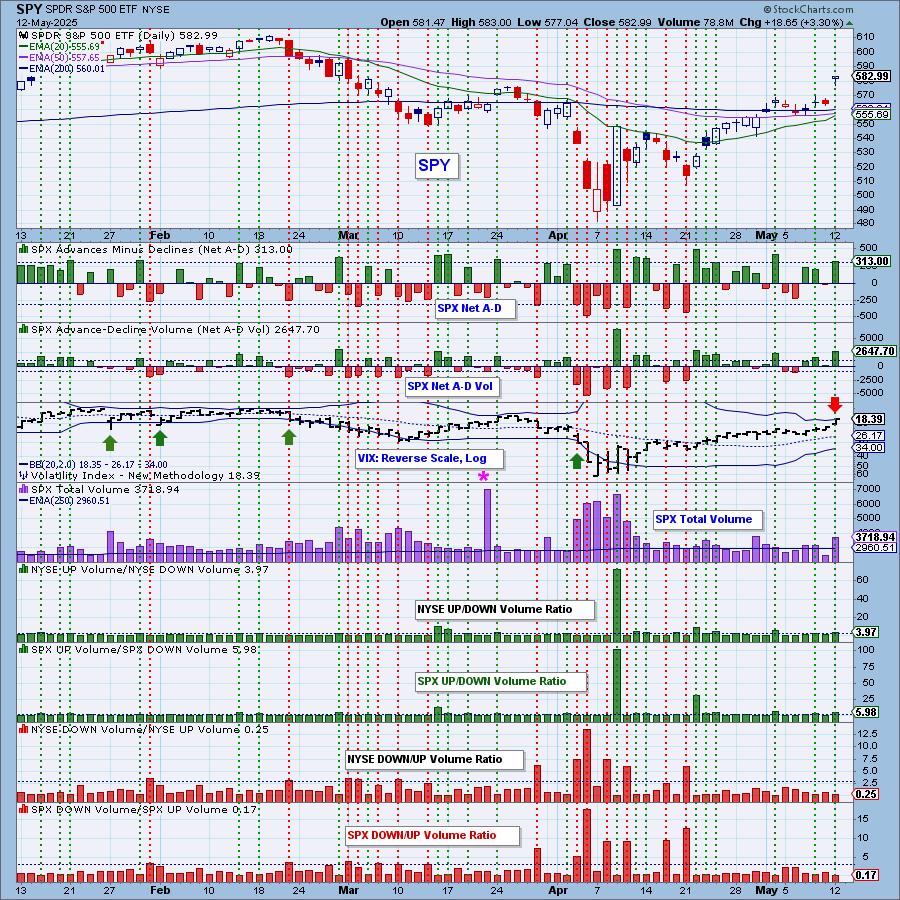
*A climax is a one-day event when market action generates very high readings in, primarily, breadth and volume indicators. We also include the VIX, watching for it to penetrate outside the Bollinger Band envelope. The vertical dotted lines mark climax days -- red for downside climaxes, and green for upside. Climaxes are at their core exhaustion events; however, at price pivots they may be initiating a change of trend.
Short-Term Market Indicators: The short-term market trend is UP and the condition is NEUTRAL.
After turning down on Friday, both the Swenlin Trading Oscillators (STOs) turned back up forcefully. Participation of stocks above their 20-day EMAs is now getting overbought so is %PMOs Rising.
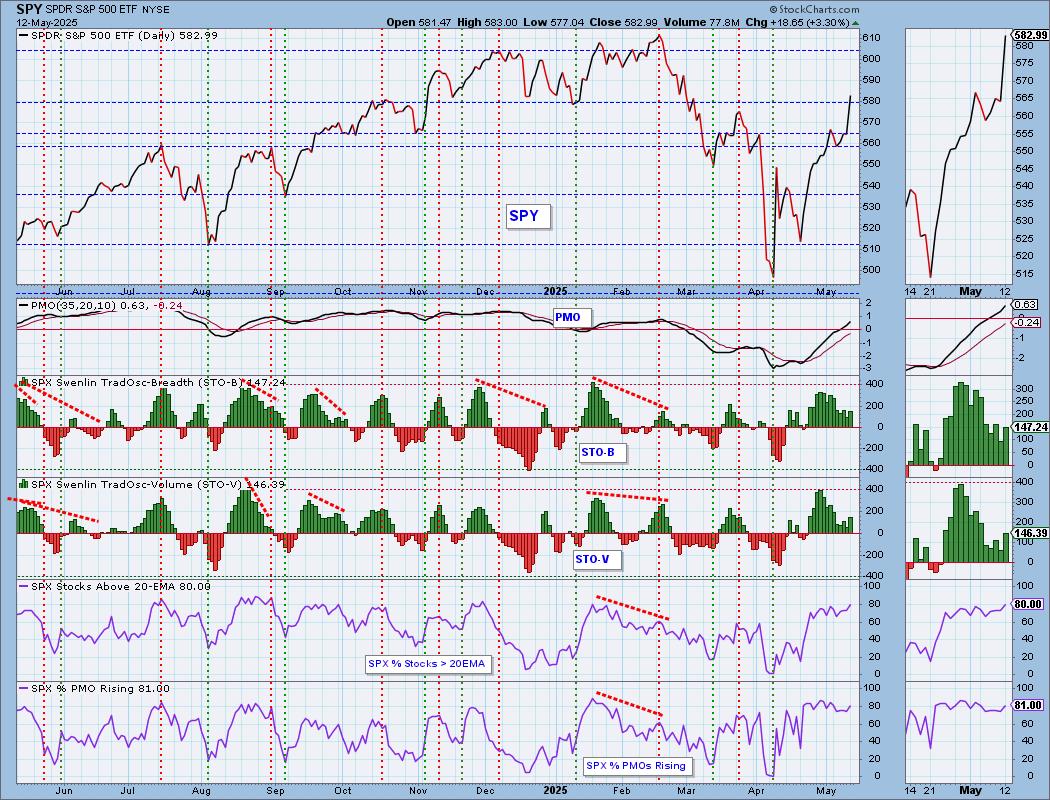
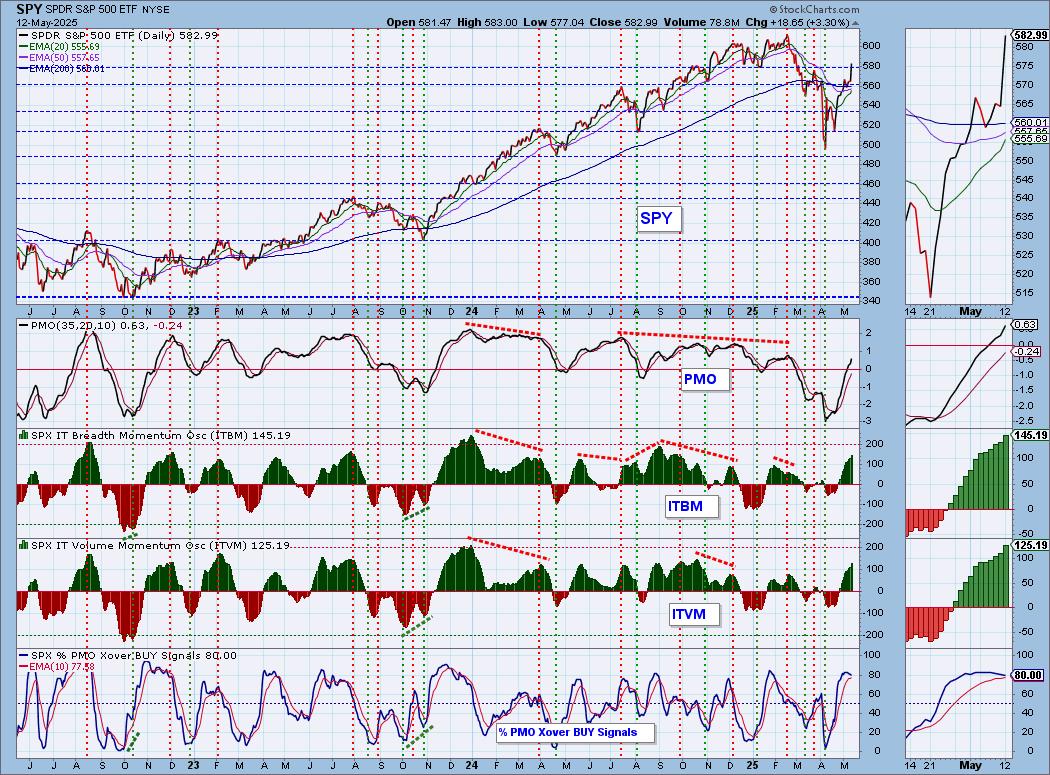
Intermediate-Term Market Indicators: The intermediate-term market trend is UP and the condition is OVERBOUGHT.
The ITBM and ITVM look solid on their rise but they have gotten overbought. We also lost a few PMO BUY Signals on today's strong rally.
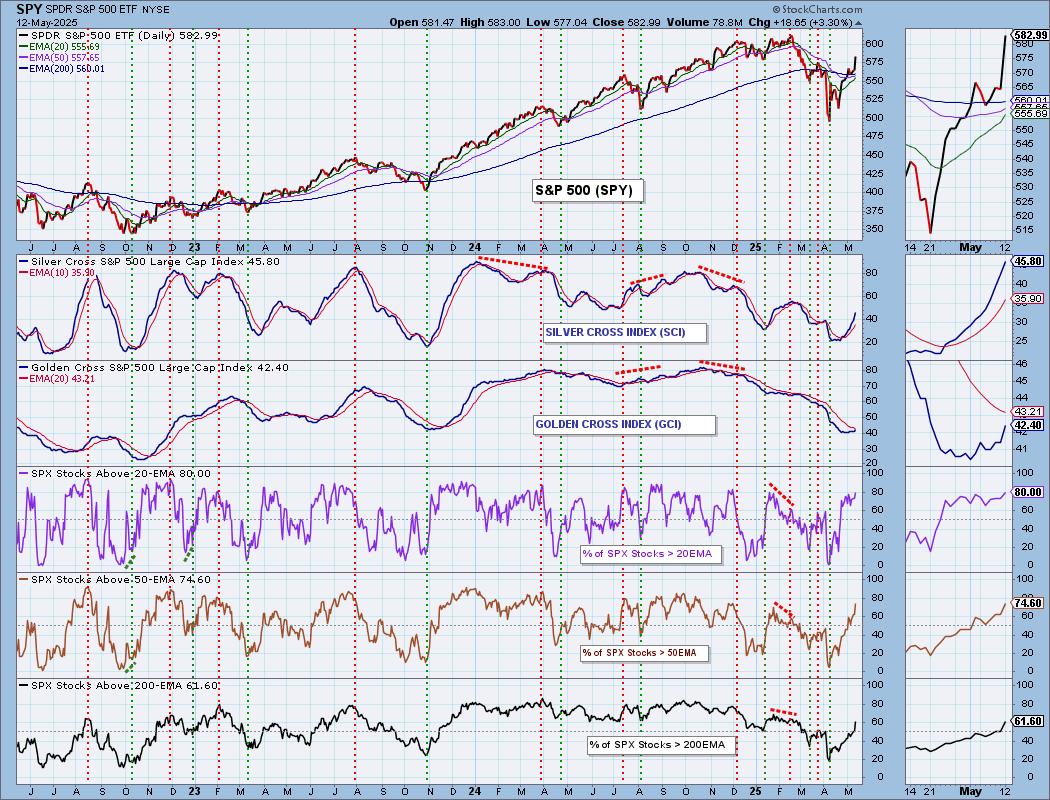
PARTICIPATION CHART (S&P 500): The following chart objectively shows the depth and trend of participation for the SPX in two time frames.
- Intermediate-Term - the Silver Cross Index (SCI) shows the percentage of SPX stocks on IT Trend Model BUY signals (20-EMA > 50-EMA). The opposite of the Silver Cross is a "Dark Cross" -- those stocks are, at the very least, in a correction.
- Long-Term - the Golden Cross Index (GCI) shows the percentage of SPX stocks on LT Trend Model BUY signals (50-EMA > 200-EMA). The opposite of a Golden Cross is the "Death Cross" -- those stocks are in a bear market.
The market bias is BULLISH in the intermediate term.
The market bias is BEARISH in the long term.
We have very good participation readings, all above our bullish 50% threshold. This can keep this rally cooking. The Silver Cross Index is rising strongly above its signal line so the IT Bias is BULLISH. The Golden Cross Index is now picking up speed to the upside and could get above its signal line very soon. For now, it is below its signal line so the LT Bias is BEARISH.
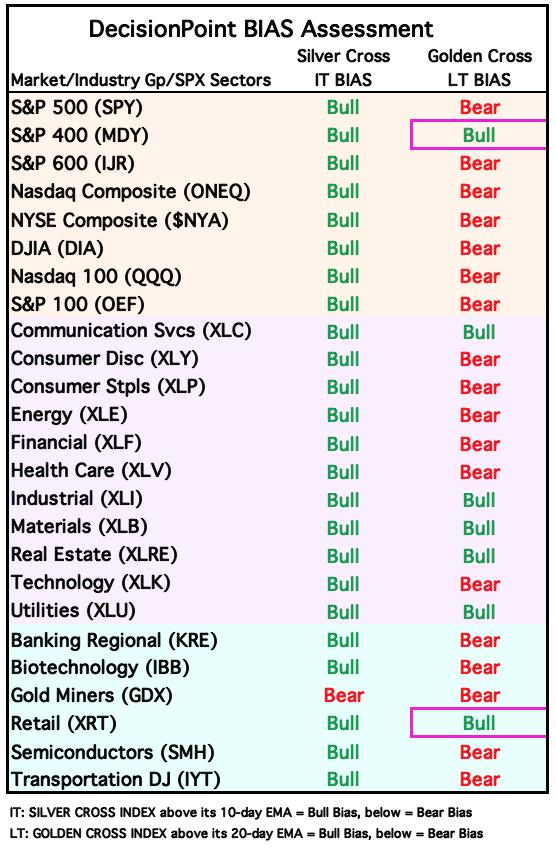
BIAS Assessment: The following table expresses the current BIAS of various price indexes based upon the relationship of the Silver Cross Index to its 10-day EMA (intermediate-term), and of the Golden Cross Index to its 20-day EMA (long-term). When the Index is above the EMA it is bullish, and it is bearish when the Index is below the EMA. The BIAS does not imply that any particular action should be taken. It is information to be used in the decision process.
The items with highlighted borders indicate that the BIAS changed today.
*****************************************************************************************************
CONCLUSION: This is a headline driven market right now. Friday's upside exhaustion climax obviously did not pan out today. We did get another upside exhaustion climax today and with the news over, the SPY could come back to earth. The VIX also punctured its upper Bollinger Band and that often times leads to a downside reversal. At this point, we don't expect a heavy decline as participation is very robust and STOs/ITBM/ITVM are all rising. The Bias Table above is also very bullish. We do have the Consumer Price Index coming in tomorrow and if that shows problems for the economy, a pullback would likely result. If it's good news, the market will see follow-through. We are cautiously bullish.
Erin is 10% long, 0% short. (This is intended as information, not a recommendation.)
*****************************************************************************************************
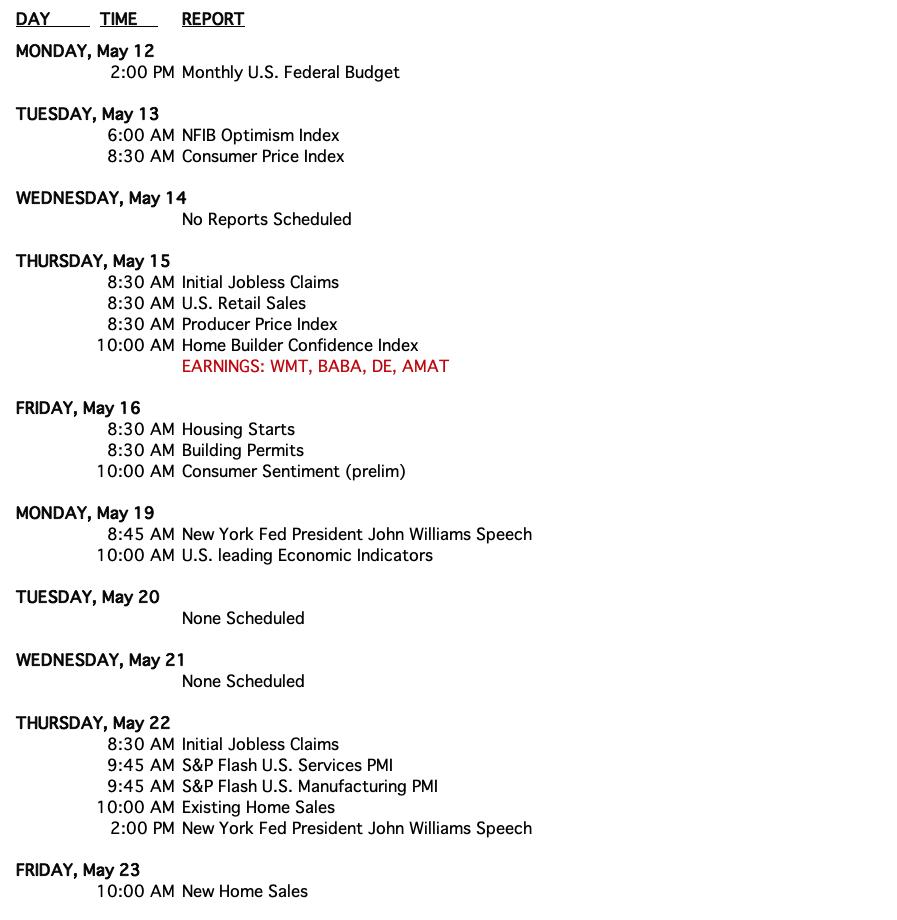
CALENDAR
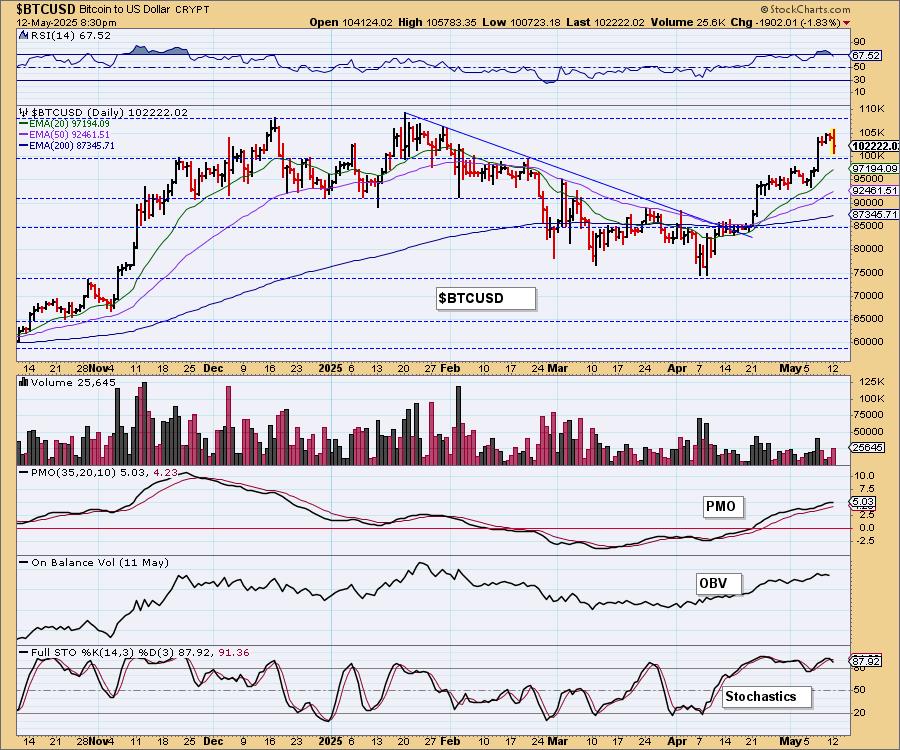
BITCOIN
Bitcoin had a bad day after a so-so weekend. This decline was needed as it has now brought the RSI out of overbought territory. This rising trend looks very bullish, but we do note the PMO is looking toppy. At this point we expect the short-term rising trend to hold up.
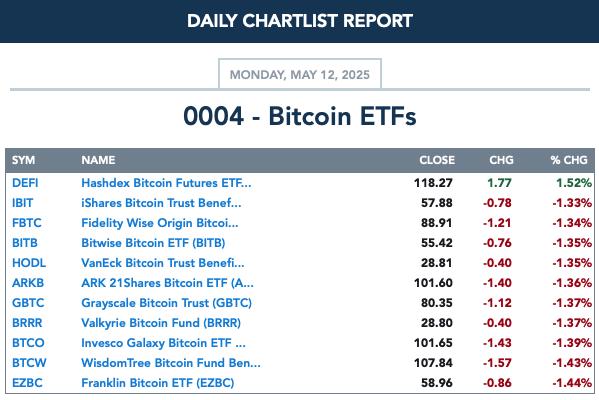
BITCOIN ETFs
INTEREST RATES
As we suspected, yields are back on the rise and look very bullish. Expect more upside.
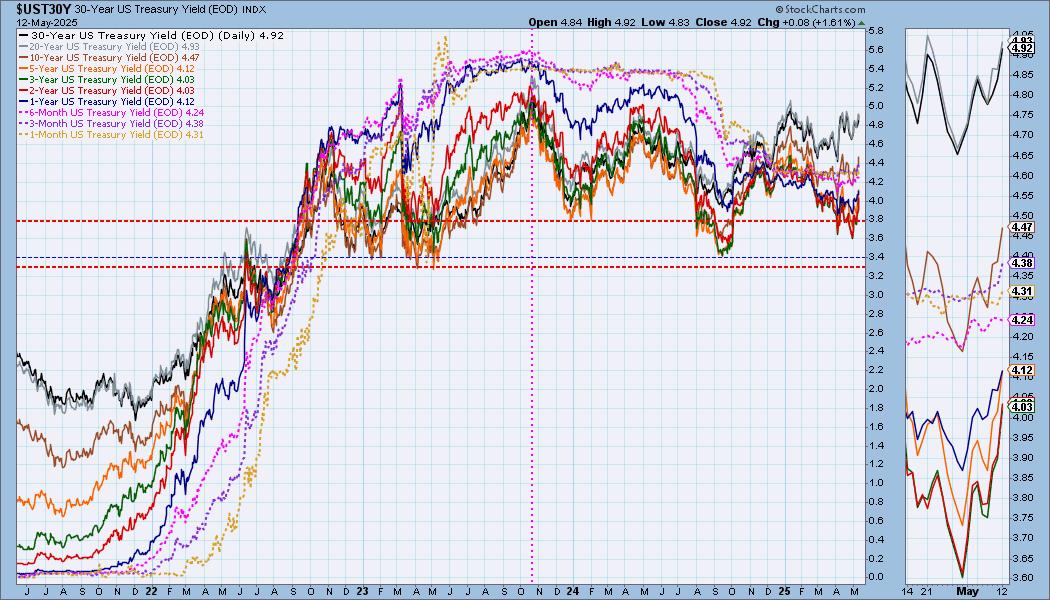
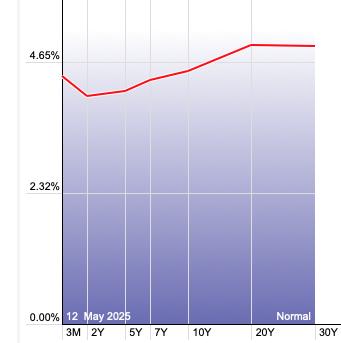
The Yield Curve Chart from StockCharts.com shows us the inversions taking place. The red line should move higher from left to right. Inversions are occurring where it moves downward.
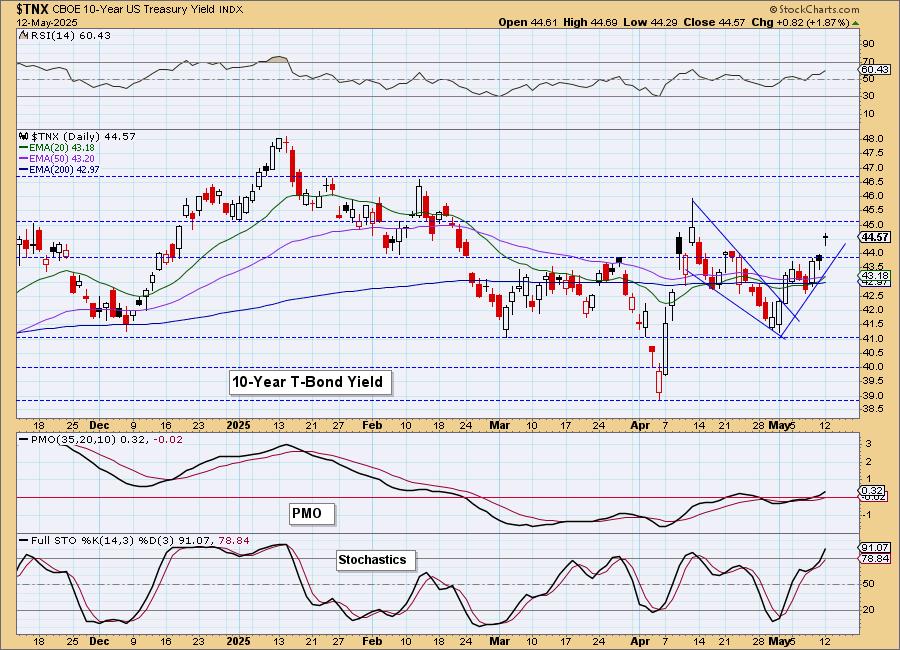
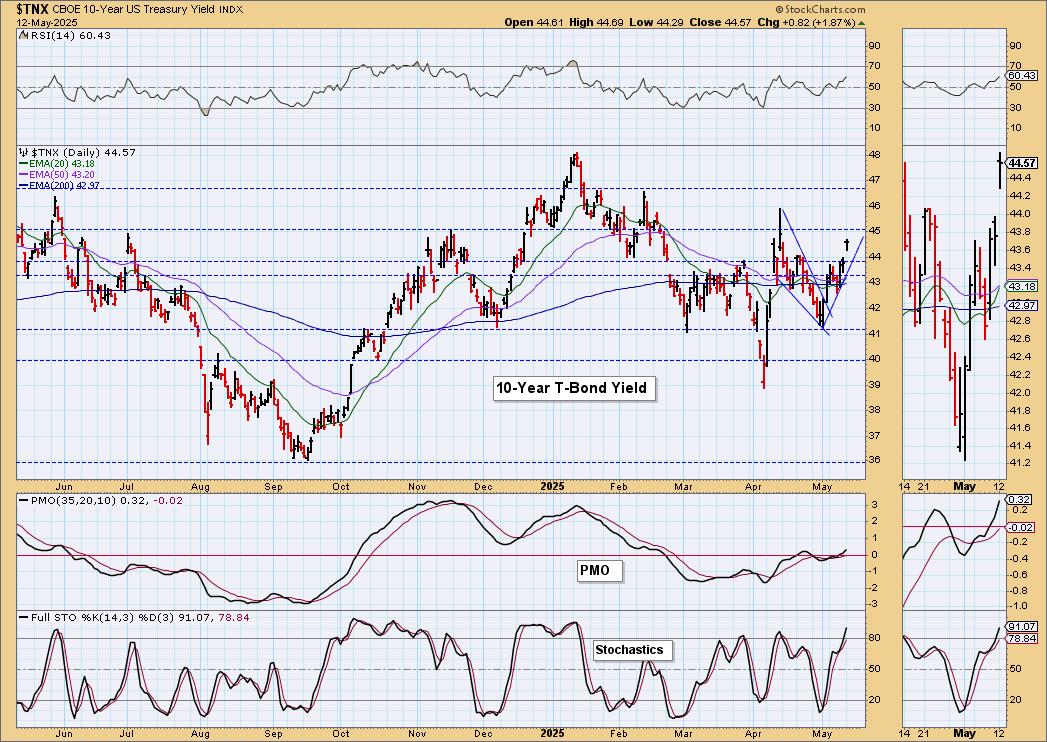
10-YEAR T-BOND YIELD
$TNX gapped up today. It rallied out of a bullish falling wedge and has established a new rising trend. Resistance is quite close, but given the bullish PMO and vertically rising Stochastics, we would expect resistance to be broken.
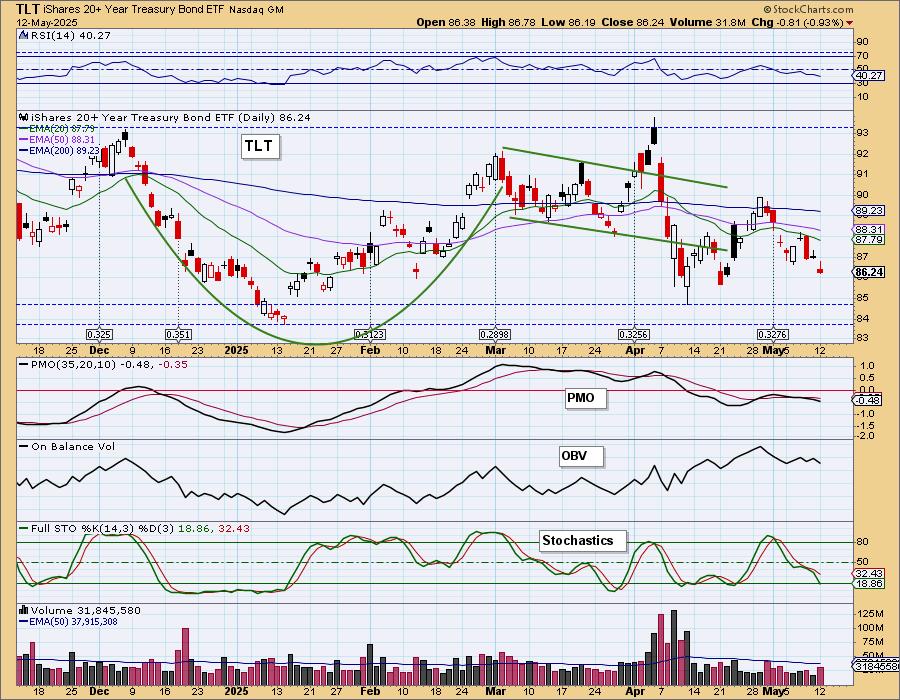
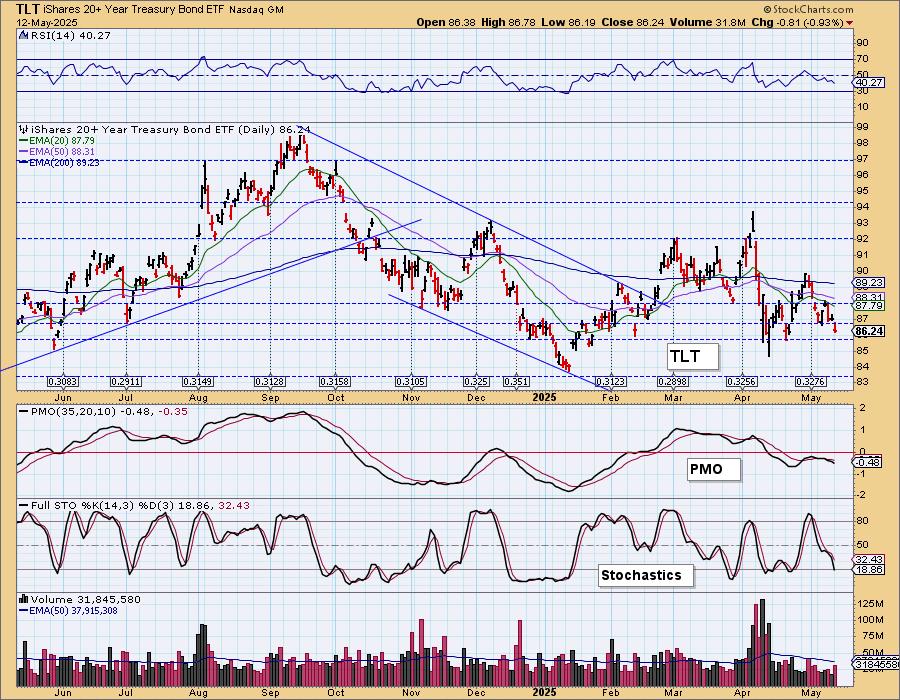
BONDS (TLT)
IT Trend Model: SELL as of 4/14/2025
LT Trend Model: SELL as of 12/13/2024
TLT Daily Chart: Yields are at it again and that is applying downside pressure on Bond funds. TLT is in a short-term declining trend. The PMO is falling after a Crossover SELL Signal below the zero line. That is especially bearish. Look for support to be tested.
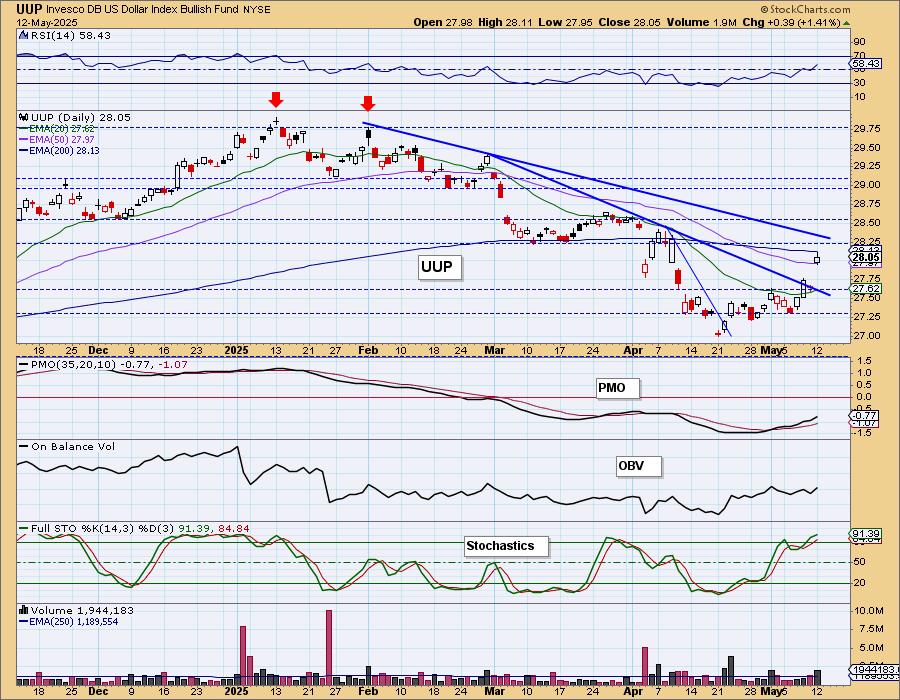
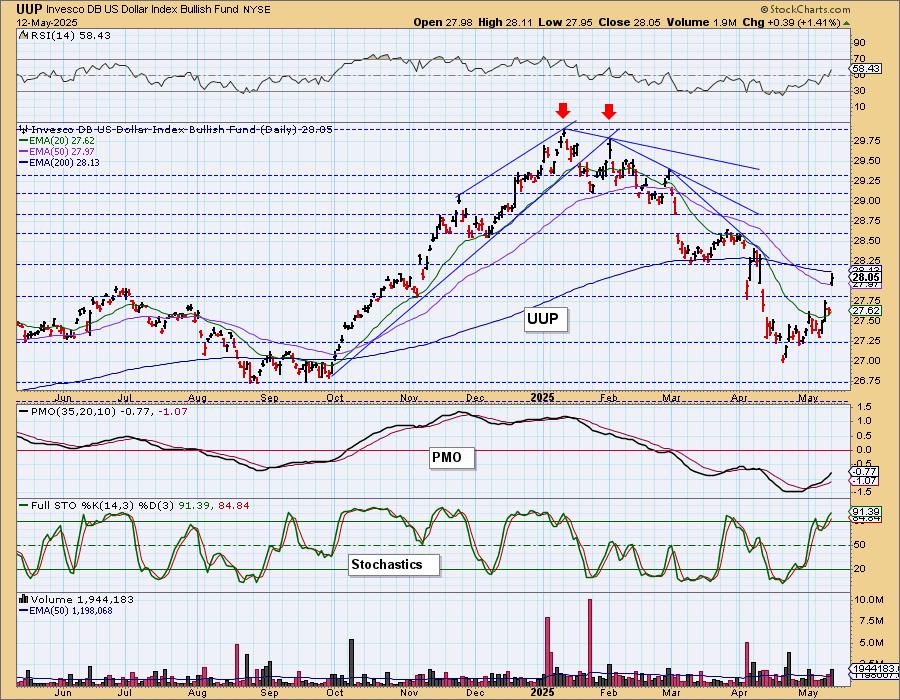
DOLLAR (UUP)
IT Trend Model: NEUTRAL as of 3/5/2025
LT Trend Model: SELL as of 4/25/2025
UUP Daily Chart: The Dollar leapt higher today on the tariff news. The near-term declining tops trendline was broken and it is now going to make a move toward the next declining tops trendline. It looks like the Dollar has been reignited and will like be making a run up toward resistance at 29.00. The RSI is not overbought despite the strong rally so more upside can be accommodated.
GOLD
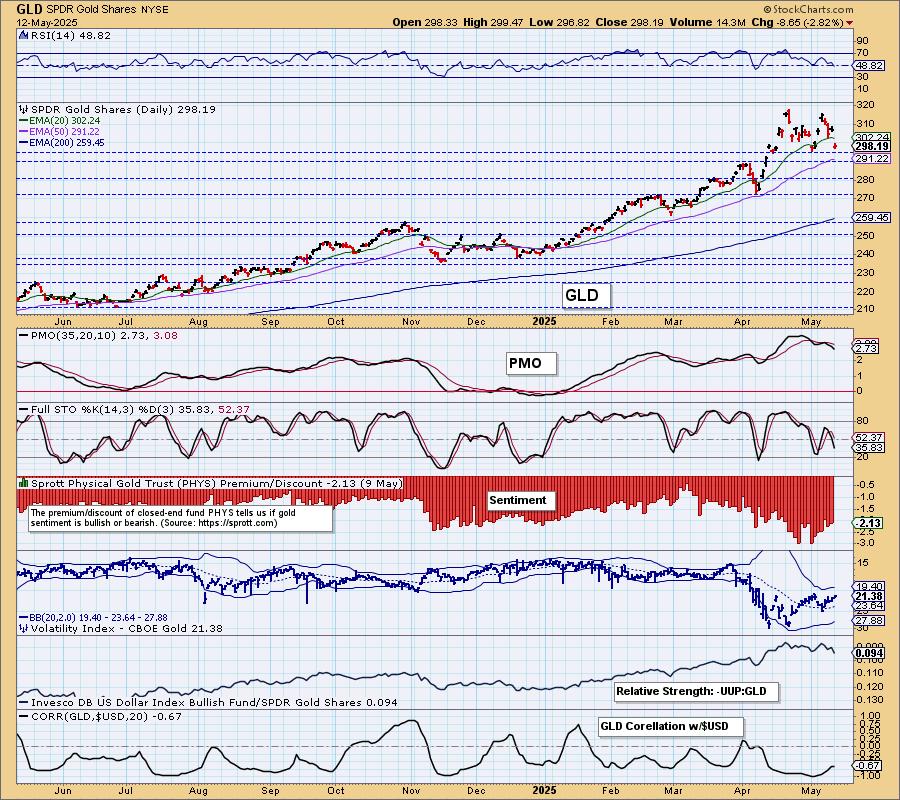
IT Trend Model: BUY as of 1/10/2025
LT Trend Model: BUY as of 10/20/2023
GLD Daily Chart: We now have a bearish double top on Gold and we do expect more downside with the Dollar gearing up for more rally. The pattern won't be confirmed until a drop below the May low. That seems very likely given the now negative RSI, falling PMO and dropping Stochastics.
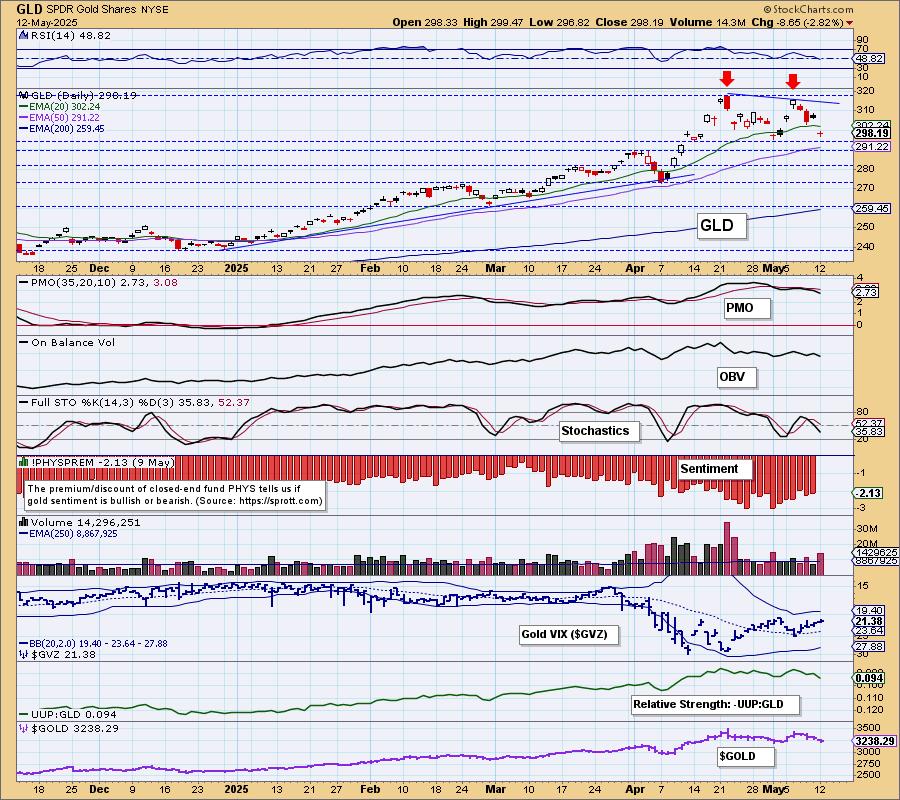
You'll notice that Gold's relative strength to the Dollar is faltering as well. Discounts have pared back so we have bearish sentiment that will likely pull Gold down further. Remember we want extremely high discounts to get those upside reversals. They are no longer at extremes.
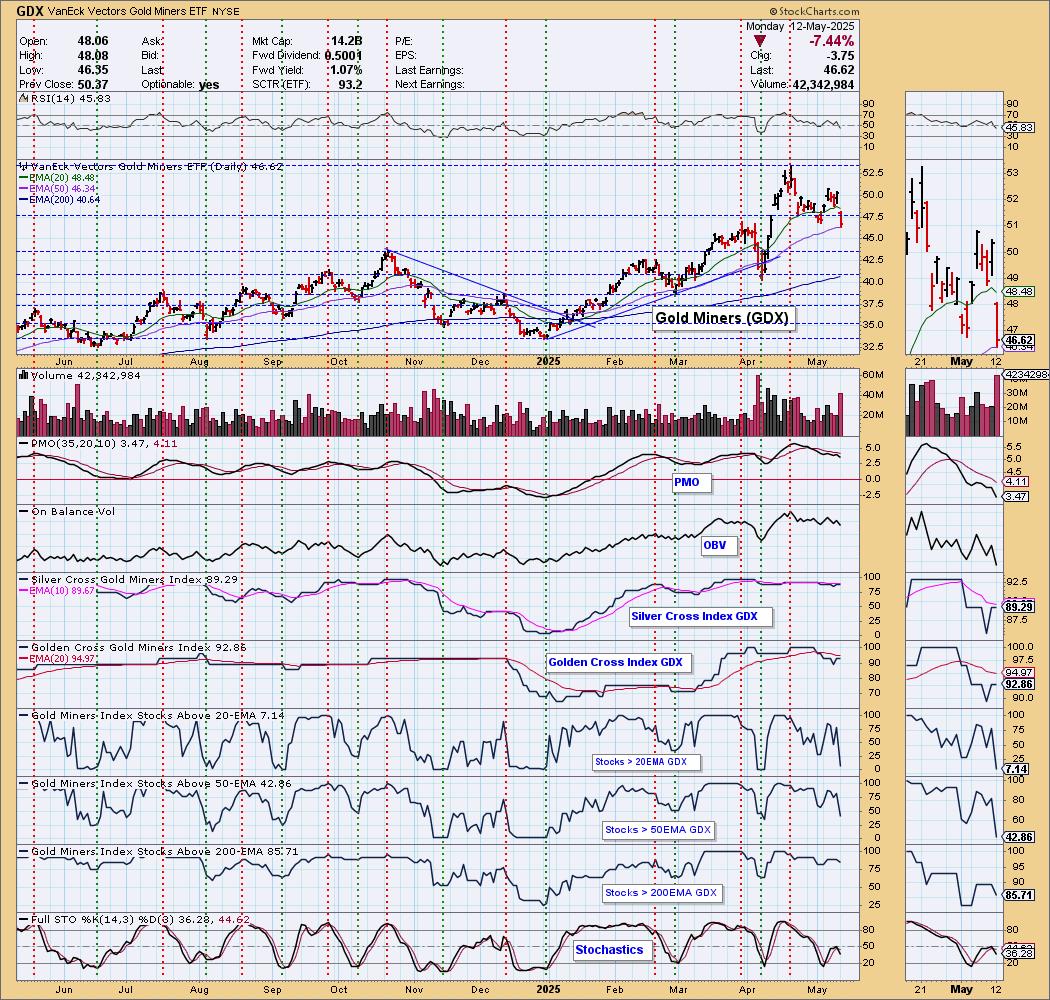
GOLD MINERS (GDX) Daily Chart: Gold Miners unsurprisingly crashed on the Gold decline. Horizontal support at the May low was broken, but it is clinging to the 50-day EMA. Given how bearish Gold looks right now, we would be staying away from this industry group. Participation has dived lower and the PMO is accelerating to the downside. Time to look toward support at the October high.
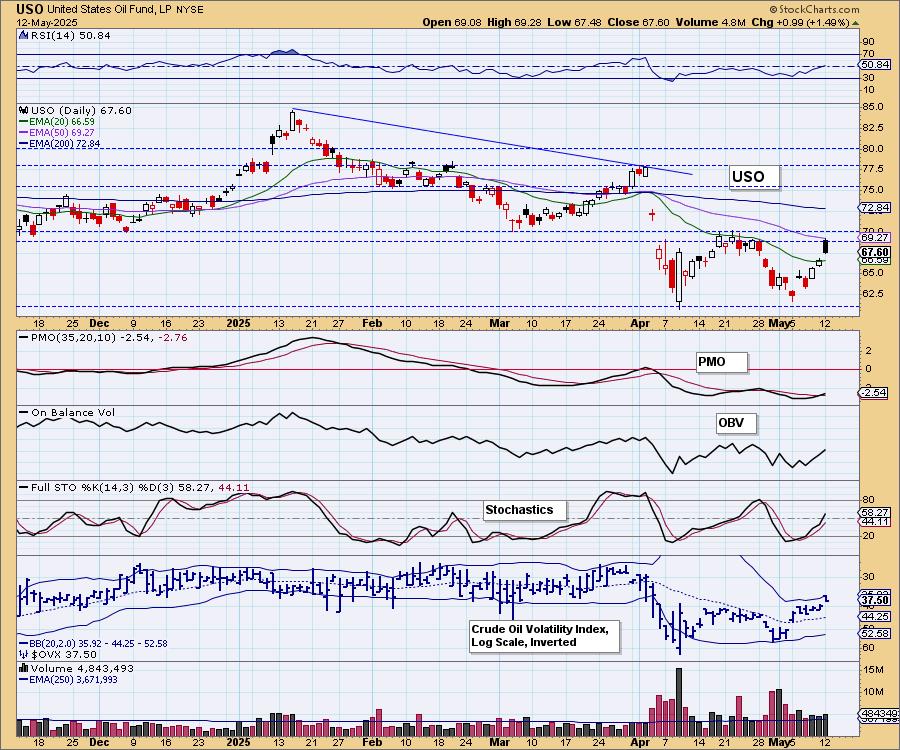
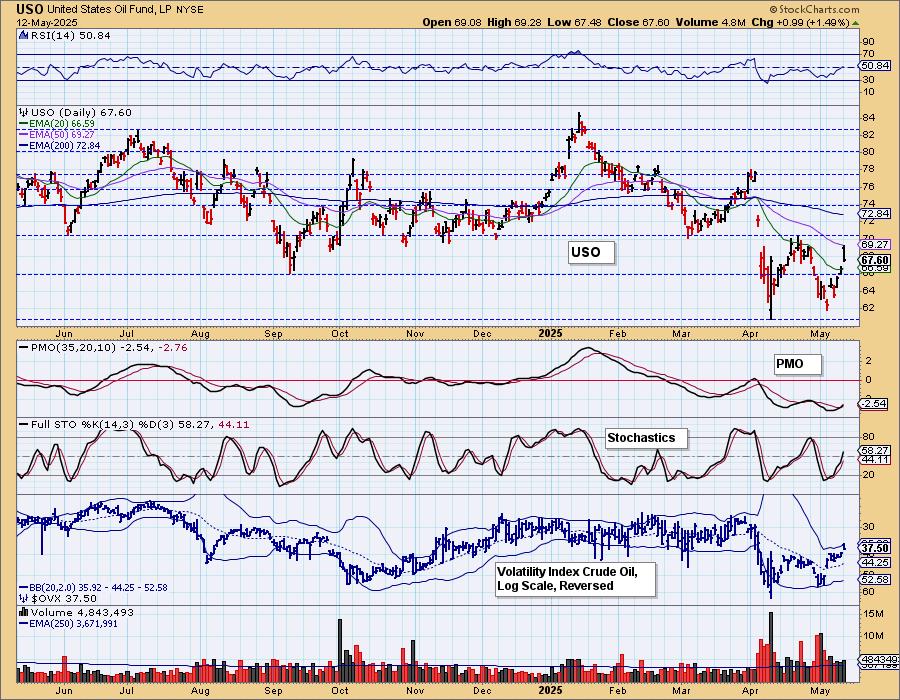
CRUDE OIL (USO)
IT Trend Model: NEUTRAL as of 2/27/2025
LT Trend Model: SELL as of 3/18/2025
USO Daily Chart: Crude is about to confirm the double bottom pattern. It will need to break through the current resistance zone for that confirmation. The indicators do look bullish, but today's candlestick was filled and black. Those candlesticks often precede declines. Production is still high, but demand may begin to pick up as we get closer to summer. For now we do expect it to get hung up inside this resistance zone. Rather than a decline, indicators are positive enough to look for consolidation here. A breakout would be very bullish as the upside target of the double bottom pattern would take price to the early April high.
Good Luck & Good Trading!
Erin Swenlin and Carl Swenlin
Technical Analysis is a windsock, not a crystal ball. --Carl Swenlin
(c) Copyright 2025 DecisionPoint.com
Disclaimer: This blog is for educational purposes only and should not be construed as financial advice. The ideas and strategies should never be used without first assessing your own personal and financial situation, or without consulting a financial professional. Any opinions expressed herein are solely those of the author, and do not in any way represent the views or opinions of any other person or entity.
DecisionPoint is not a registered investment advisor. Investment and trading decisions are solely your responsibility. DecisionPoint newsletters, blogs or website materials should NOT be interpreted as a recommendation or solicitation to buy or sell any security or to take any specific action.
NOTE: The signal status reported herein is based upon mechanical trading model signals, specifically, the DecisionPoint Trend Model. They define the implied bias of the price index based upon moving average relationships, but they do not necessarily call for a specific action. They are information flags that should prompt chart review. Further, they do not call for continuous buying or selling during the life of the signal. For example, a BUY signal will probably (but not necessarily) return the best results if action is taken soon after the signal is generated. Additional opportunities for buying may be found as price zigzags higher, but the trader must look for optimum entry points. Conversely, exit points to preserve gains (or minimize losses) may be evident before the model mechanically closes the signal.
Helpful DecisionPoint Links:
DecisionPoint Alert Chart List
DecisionPoint Golden Cross/Silver Cross Index Chart List
DecisionPoint Sector Chart List
Price Momentum Oscillator (PMO)