
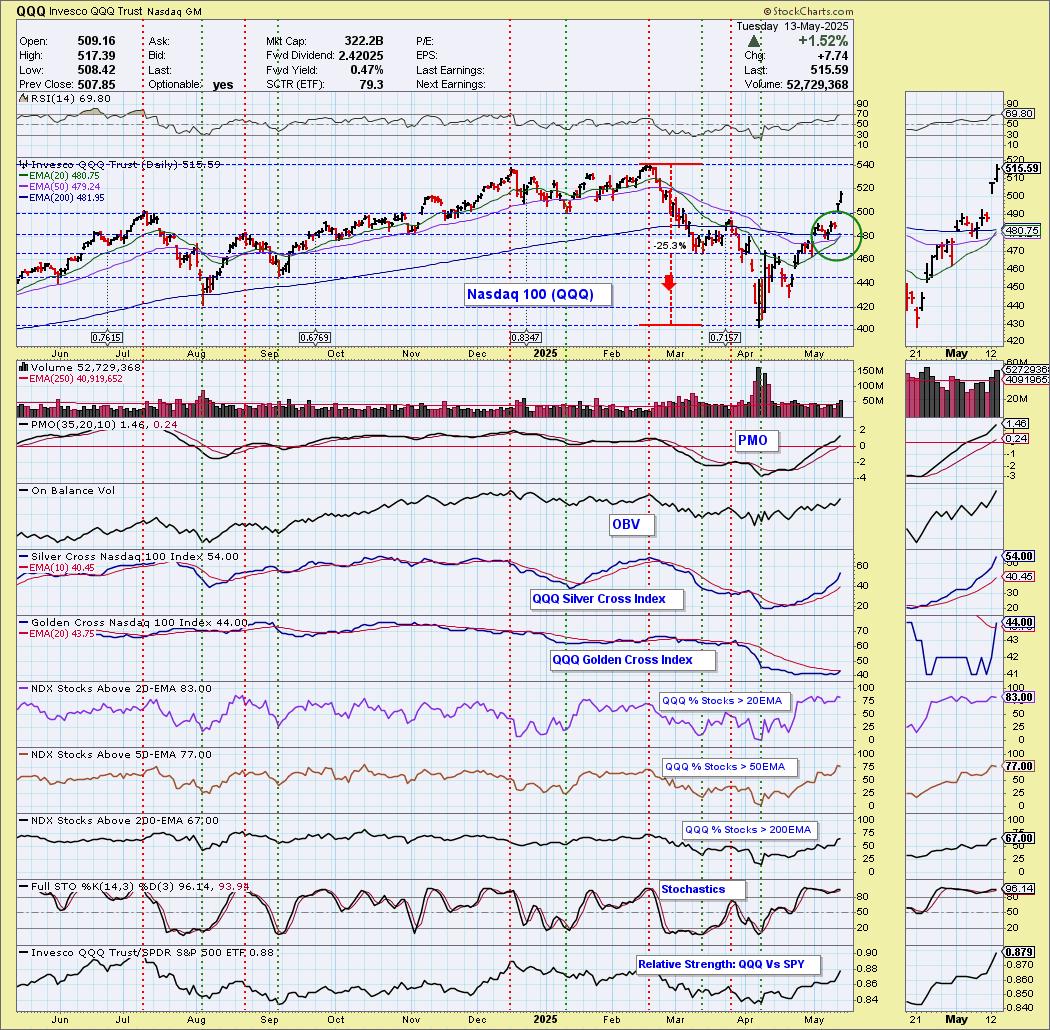
Today the Nasdaq 100 ETF (QQQ) 20-day EMA crossed up through the 50-day EMA (Silver Cross) generating an IT Trend Model BUY Signal. The rally has been strong out of the bottom. The RSI is nearly overbought so it may be time for at least some consolidation to bring it down. The PMO is accelerating higher so follow-through could continue despite overbought conditions. Participation is very strong but we do note that it contracted on today's rally. Stochastics are very strong above 80. This looks good but we worry about overbought conditions.
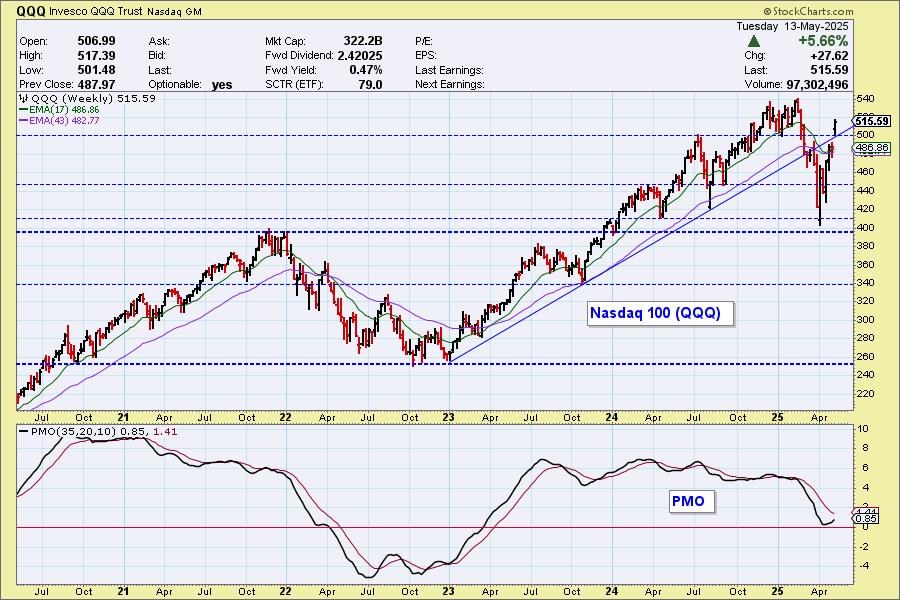
We have a nice gap up move that took price back into its prior rising trend. The weekly PMO is very positive as it rises above the zero line.
__________
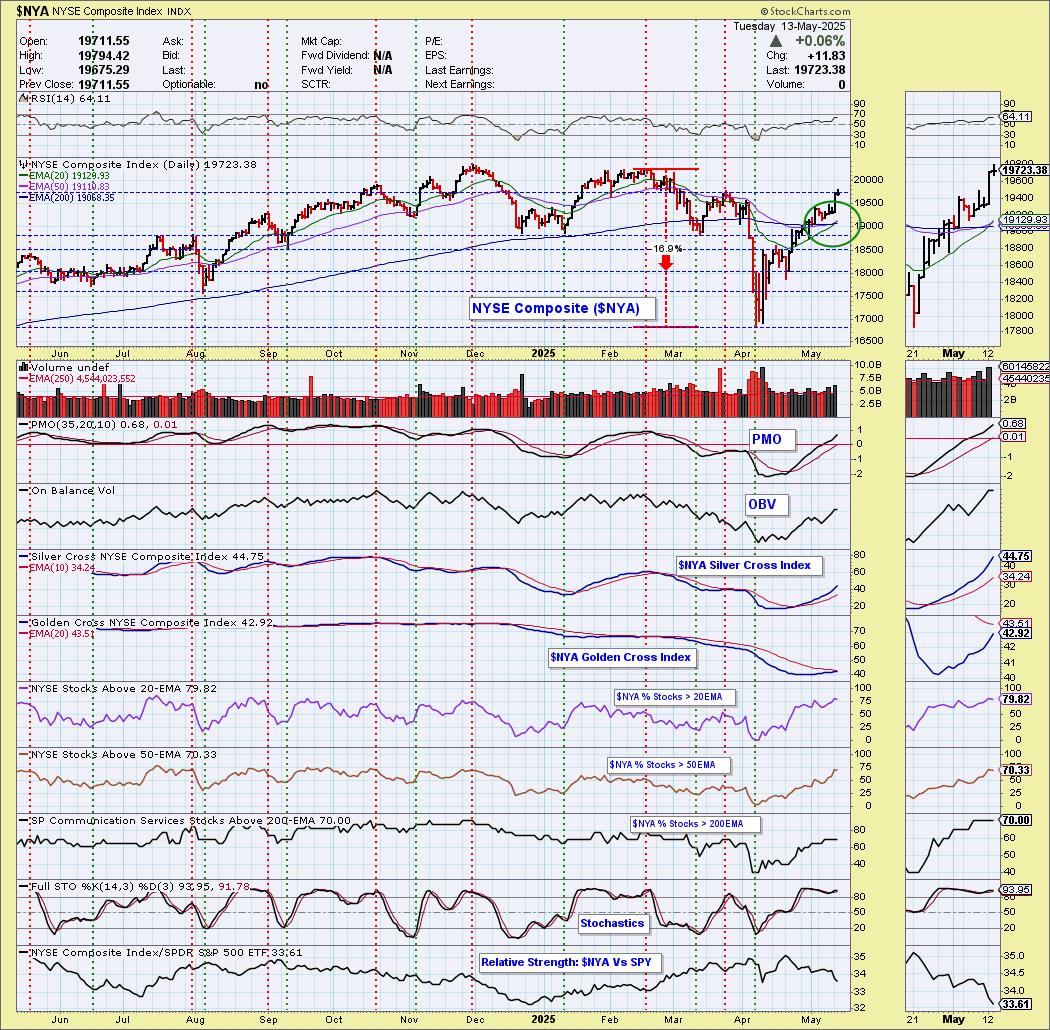
Also today, the NYSE Composite Index ($NYA) 20-day EMA crossed up through the 50-day EMA (Silver Cross) generating an IT Trend Model BUY Signal. $NYA isn't as overbought as the QQQ. Price is up against resistance but given strong participation readings and rising Silver Cross Index, we could see more upside. Relative strength isn't holding up to the SPY so the broad market overall is underperforming.
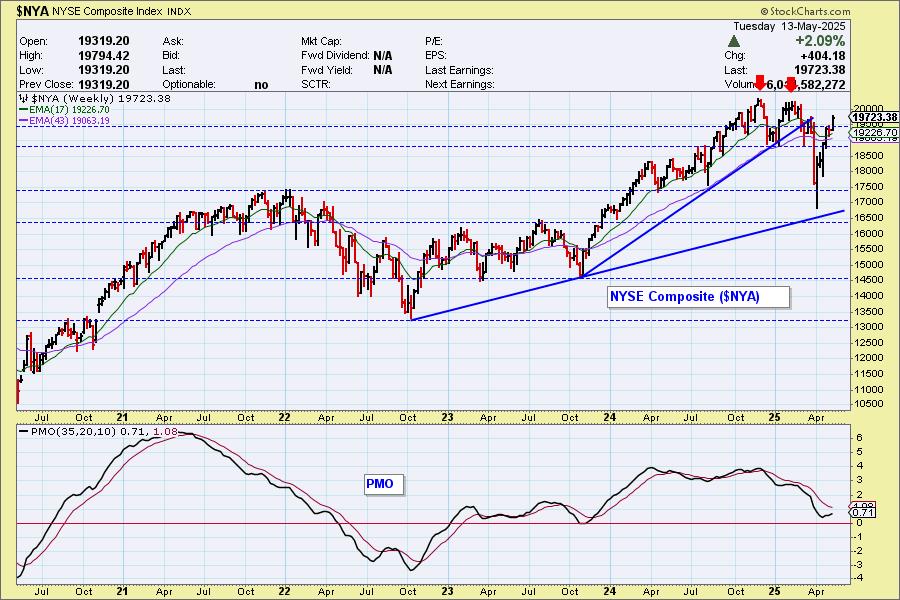
Price reversed before testing the rising bottoms trendline which is bullish. The bearish double top fulfilled on the bear market decline. The weekly PMO is rising above the zero line so we could see more upside ahead.
__________
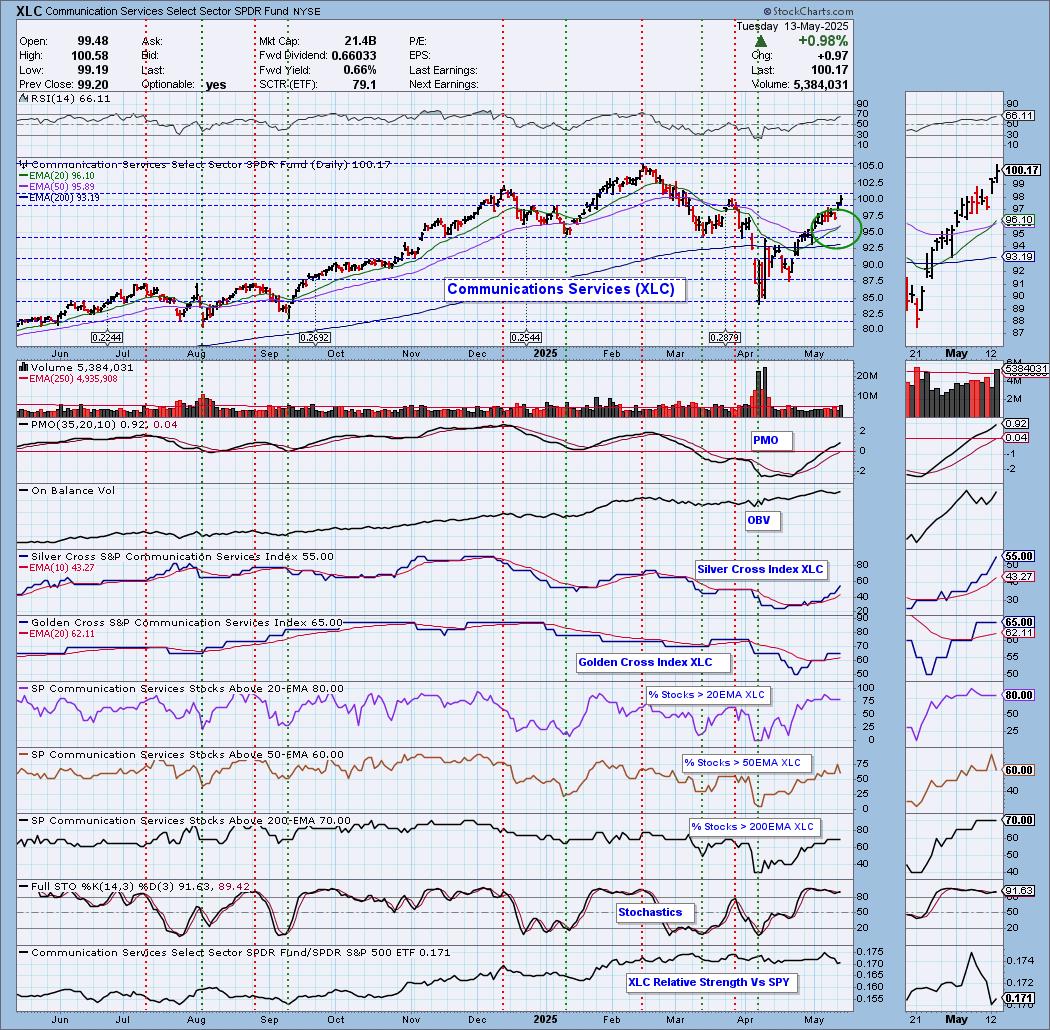
Also today, the Communications Sector ETF (XLC) 20-day EMA crossed up through the 50-day EMA (Silver Cross) generating an IT Trend Model BUY Signal. Participation did contract on today's rally, but remains at very strong levels. The Silver Cross Index is very bullish and Stochastics are rising above 80. It appears we will get more upside.
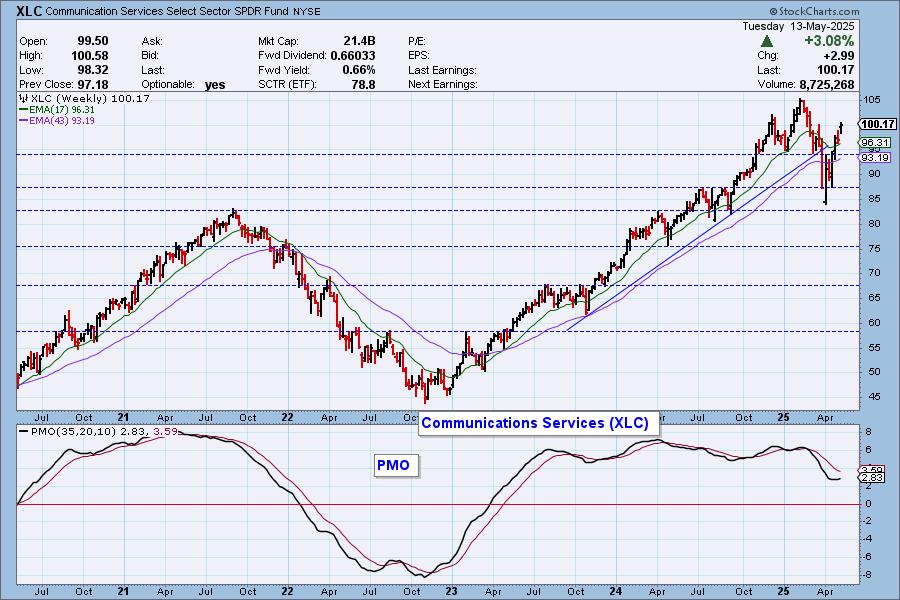
The reversal has been strong on the weekly chart and it has turned the weekly PMO back up. It appears we'll get more upside from this sector.
__________
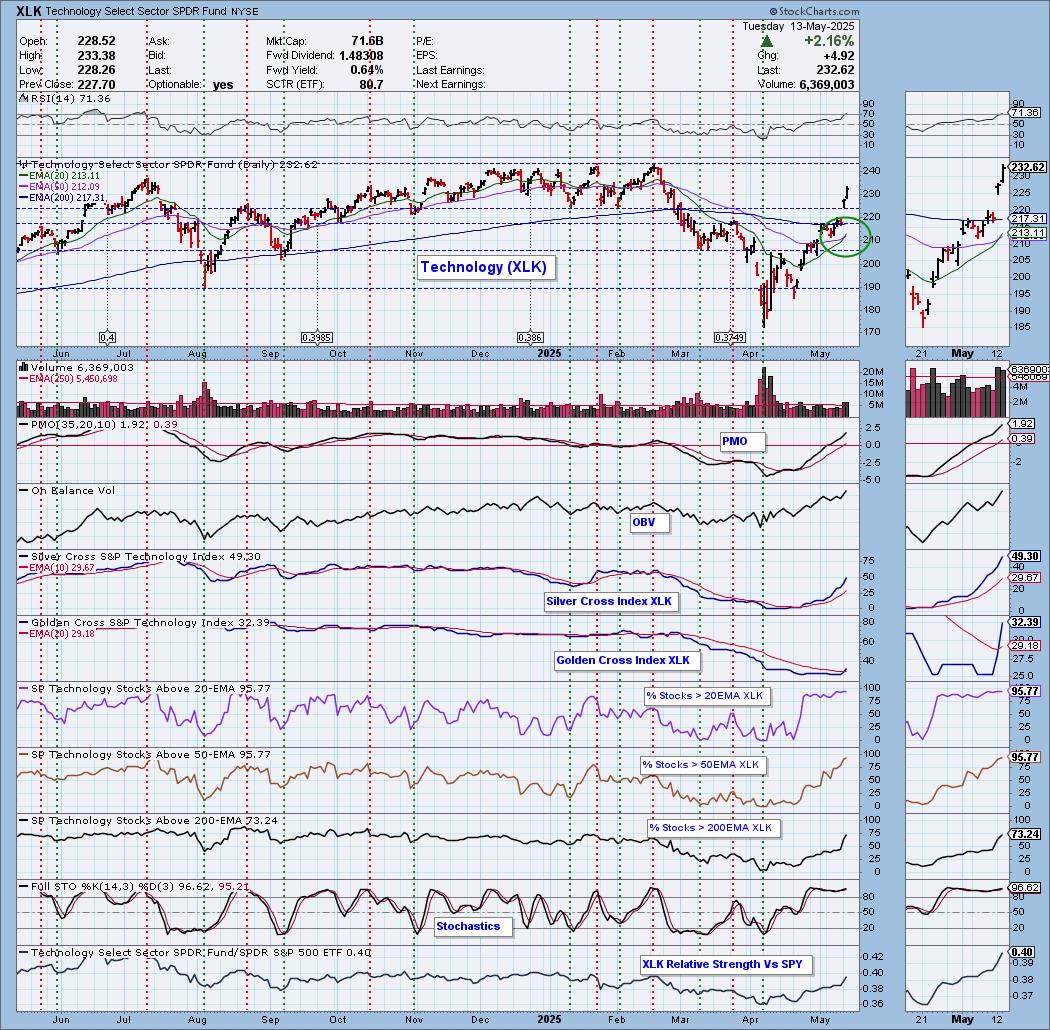
Finally, the Technology Sector ETF (XLK) 20-day EMA crossed up through the 50-day EMA (Silver Cross) generating an IT Trend Model BUY Signal. Tech is on fire and we don't see any real problems except that participation is now overbought on %Stocks > 20/50EMAs. The Silver Cross Index is very bullish and the Golden Cross Index has crept above its signal line giving us a bullish LT Bias. All-time highs are likely to be met.
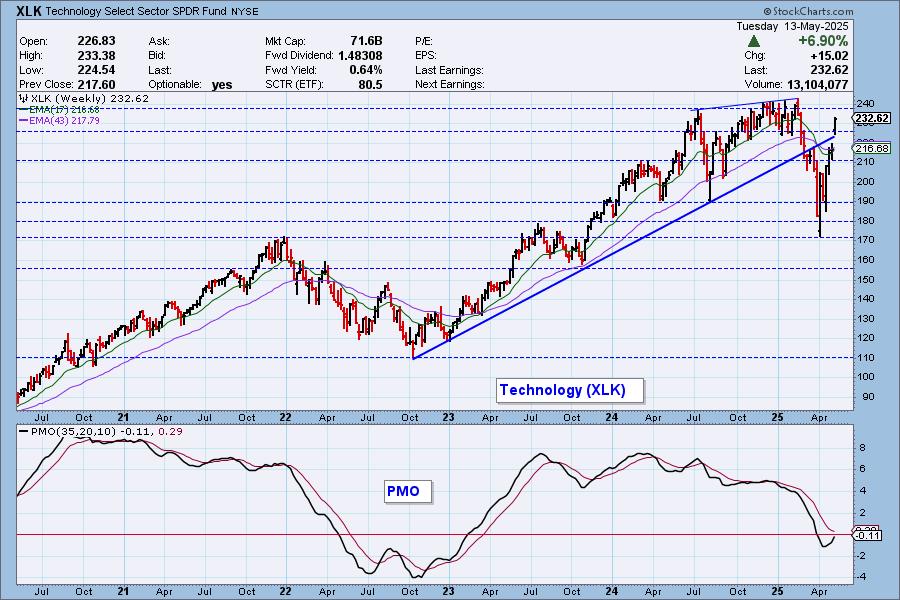
Price has now recaptured the rising trend after breaking down from the bearish rising wedge. The weekly PMO is very bullish right now so more upside seems likely.
The DecisionPoint Alert Weekly Wrap presents an end-of-week assessment of the trend and condition of the Stock Market, the U.S. Dollar, Gold, Crude Oil, and Bonds. The DecisionPoint Alert daily report (Monday through Thursday) is abbreviated and gives updates on the Weekly Wrap assessments.
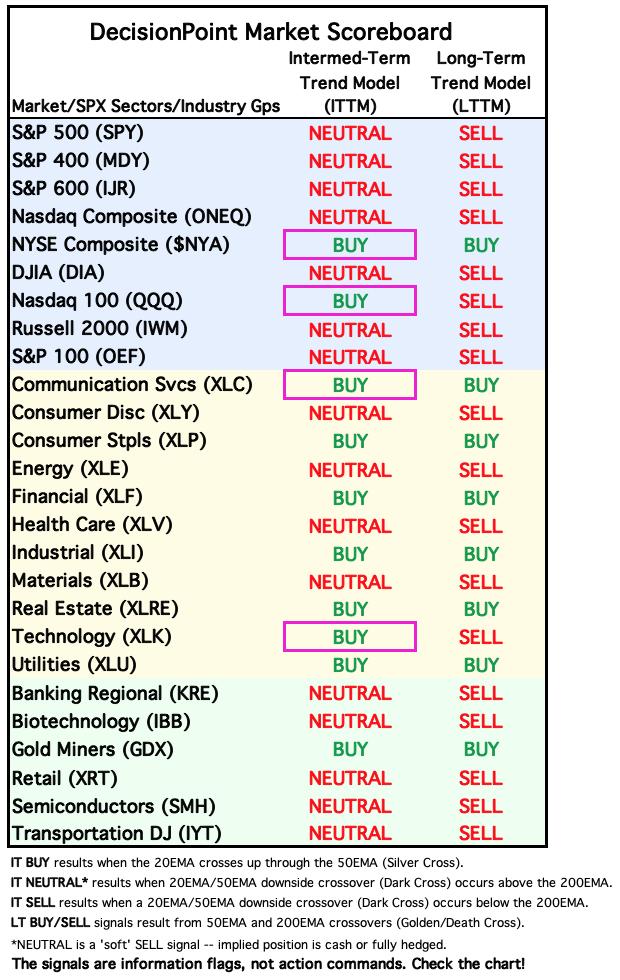
MARKET/INDUSTRY GROUP/SECTOR INDEXES
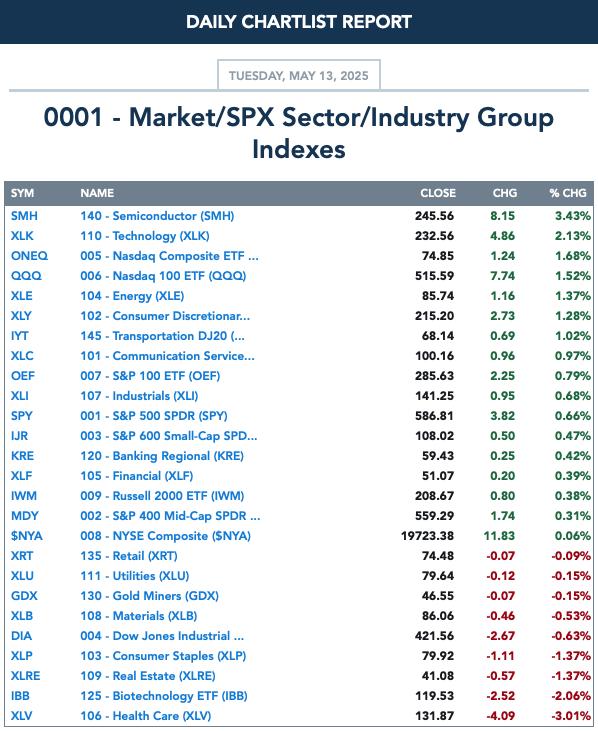
CLICK HERE for Carl's annotated Market Index, Sector, and Industry Group charts.
THE MARKET (S&P 500)
IT Trend Model: NEUTRAL as of 3/4/2025
LT Trend Model: SELL as of 4/16/2025
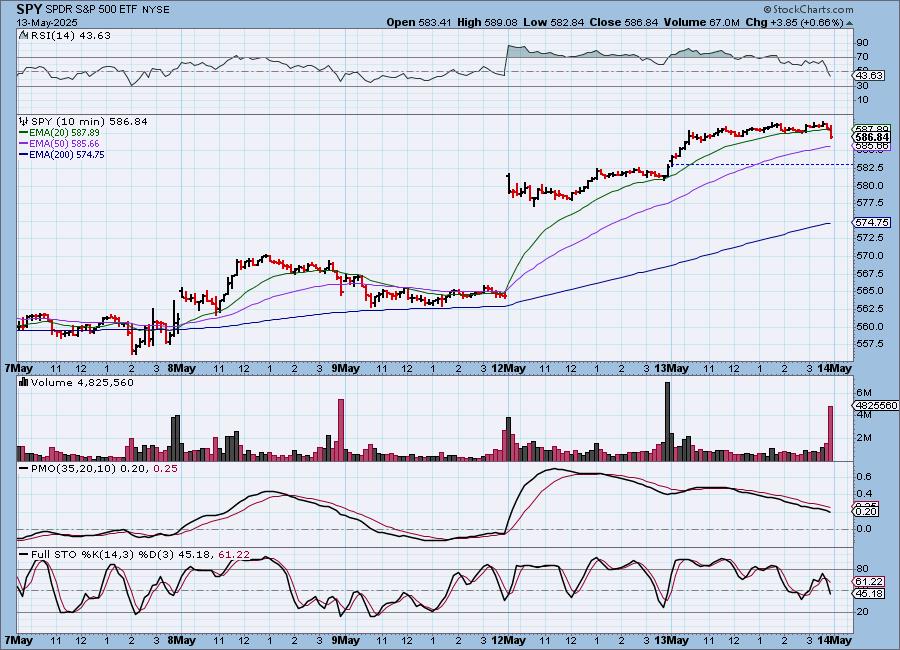
SPY 10-Minute Chart: Price rallied right on the open and stayed elevated all day with a slight rising trend. The 10-minute PMO is in decline but that is due to the consolidation we saw today, not necessarily a sign of weakness. Stochastics did top however, so maybe we'll see the market stumble on the open.
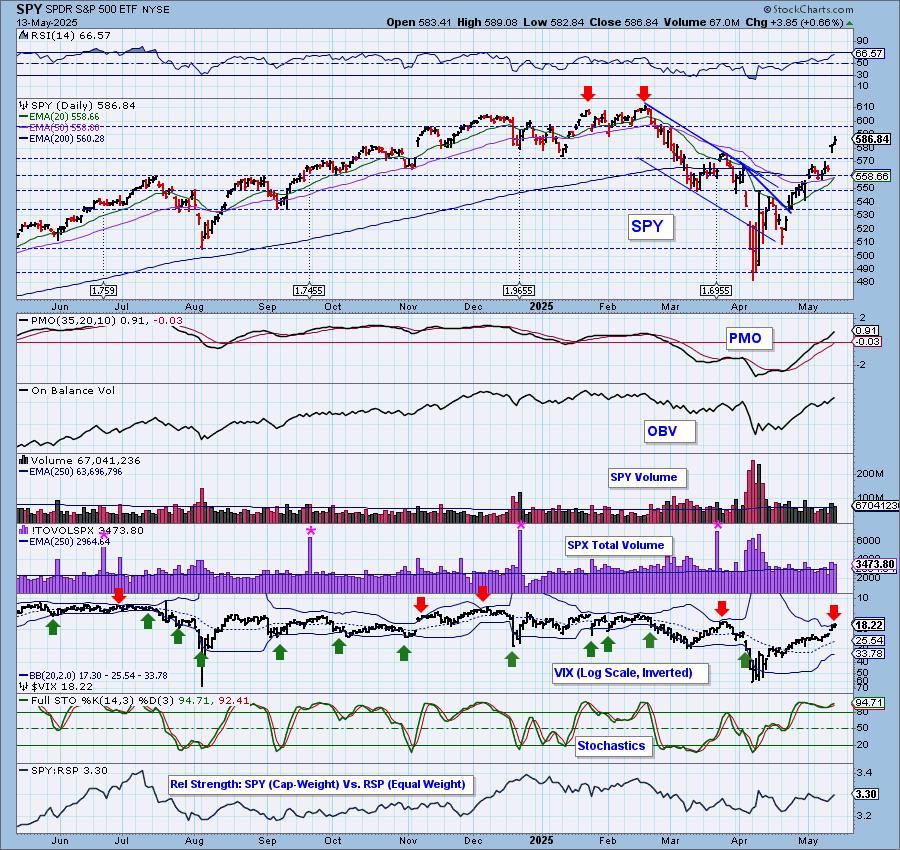
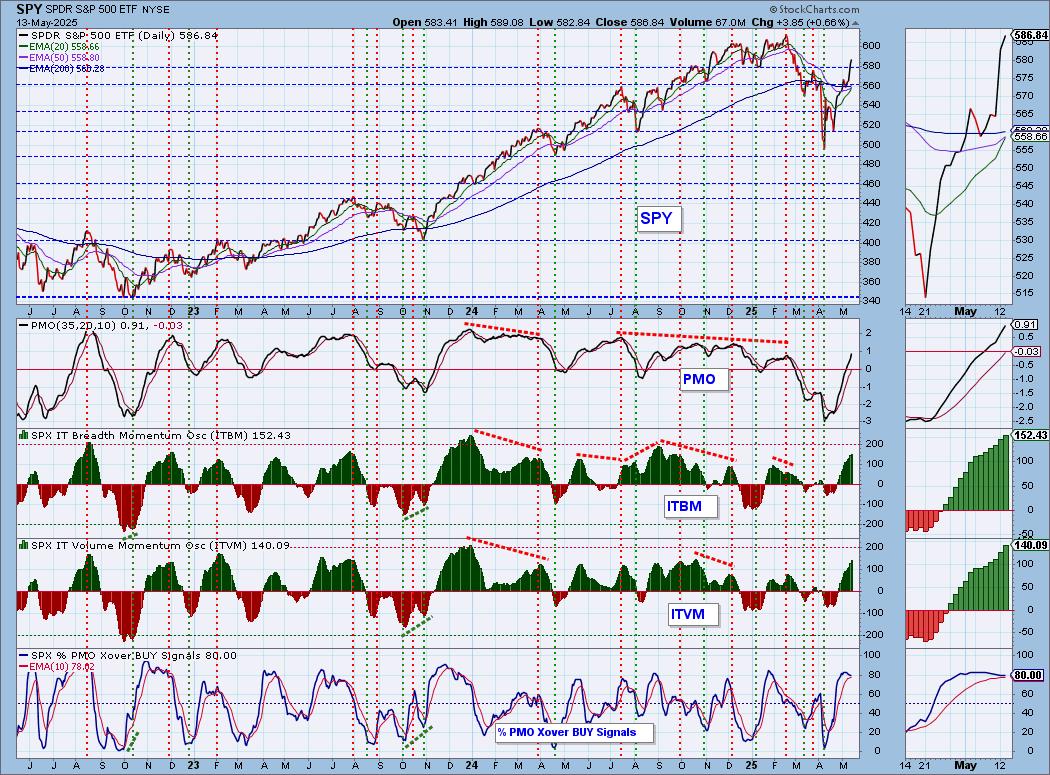
SPY Daily Chart: Given this rally it is interesting that the RSI isn't overbought yet. It tells us we can accommodate more upside. The PMO is rising nicely above the zero line.
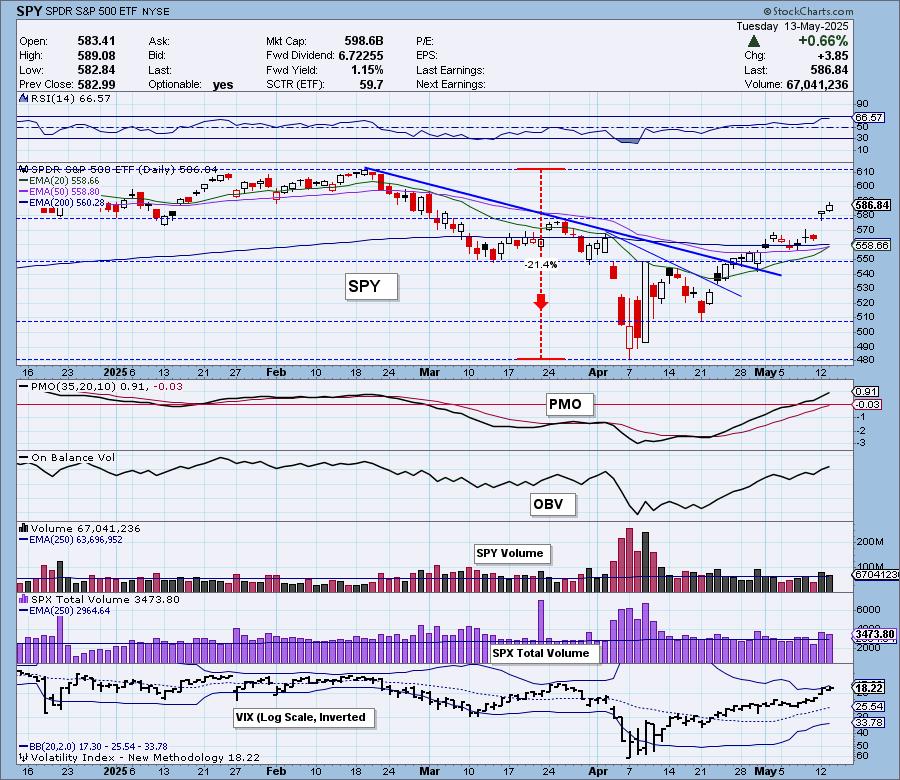
The VIX is vulnerable as it sits right up against the upper Bollinger Band on our inverted scale. Fear has definitely been left behind with the rally, but it may be getting too bullish now. Stochastics look very strong above 80.
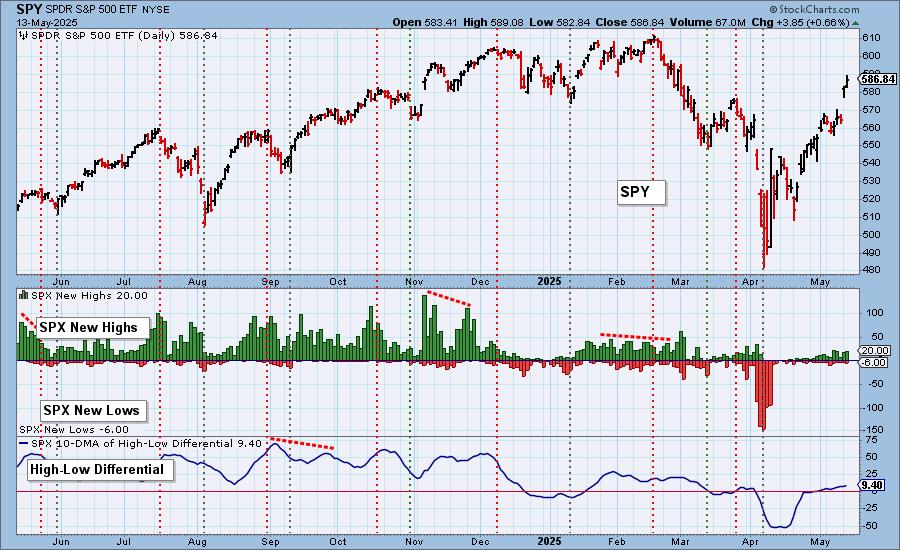
S&P 500 New 52-Week Highs/Lows: There was a small gain on New Highs, but New Lows were still visible. Overall we don't see any confirmations or negative divergences. The High-Low Differential is gently rising still.
Climax* Analysis: Today there was only one climax reading, so today is not a climax day. SPX Total Volume was only 117% of the one-year daily average volume, which is solid but not blowoff volume.
*A climax is a one-day event when market action generates very high readings in, primarily, breadth and volume indicators. We also include the VIX, watching for it to penetrate outside the Bollinger Band envelope. The vertical dotted lines mark climax days -- red for downside climaxes, and green for upside. Climaxes are at their core exhaustion events; however, at price pivots they may be initiating a change of trend.
Short-Term Market Indicators: The short-term market trend is UP and the condition is NEUTRAL.
Swenlin Trading Oscillators (STOs) are rising strongly right now and that bodes well for this rally. We did see a contraction in participation and we also lost a few rising PMOs which shouldn't occur on a good rally day. Still both indicators remain at bullish levels.
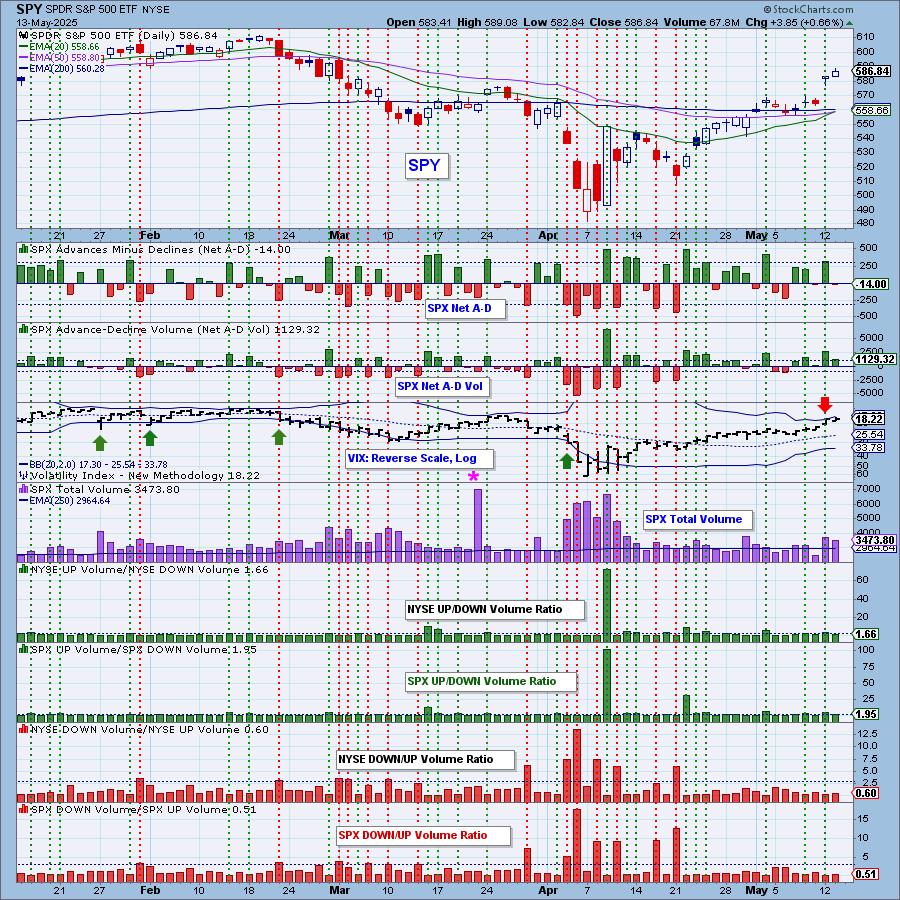
Intermediate-Term Market Indicators: The intermediate-term market trend is UP and the condition is OVERBOUGHT.
The ITBM and ITVM are definitely in overbought territory now, but we also see that in a strong rally recovery we can see even higher readings. We suspect that is what will occur. We didn't lose any PMO BUY Signals, but we also didn't see an expansion on a rally day.
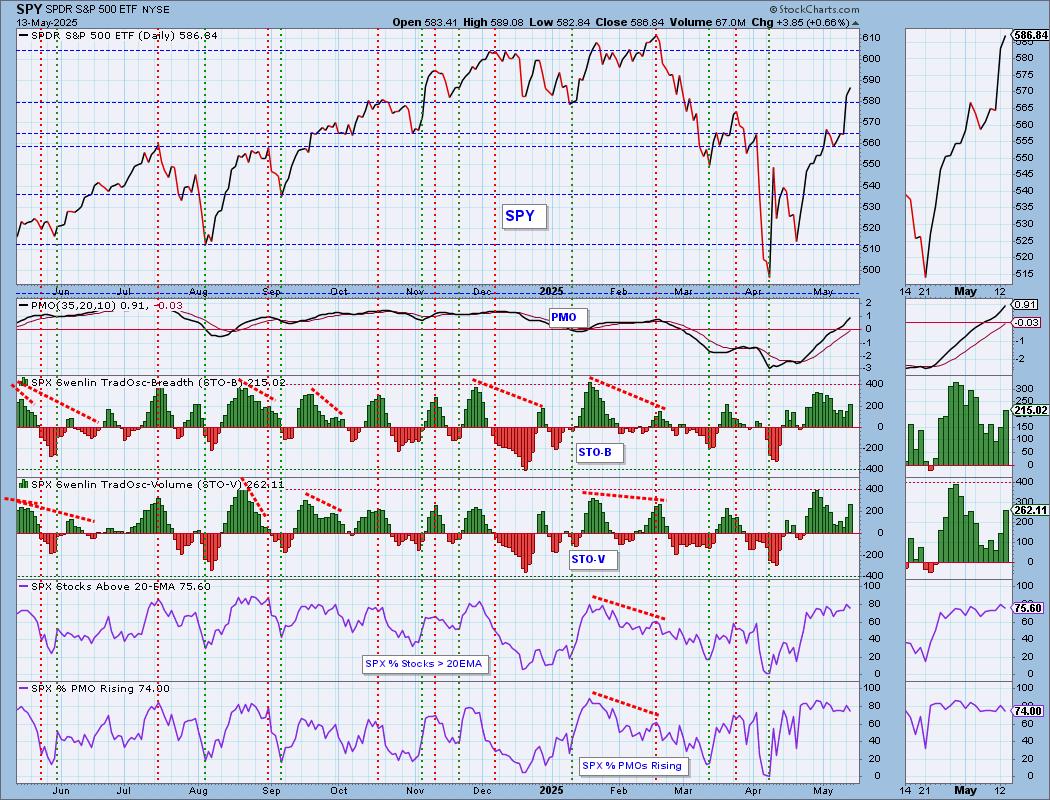
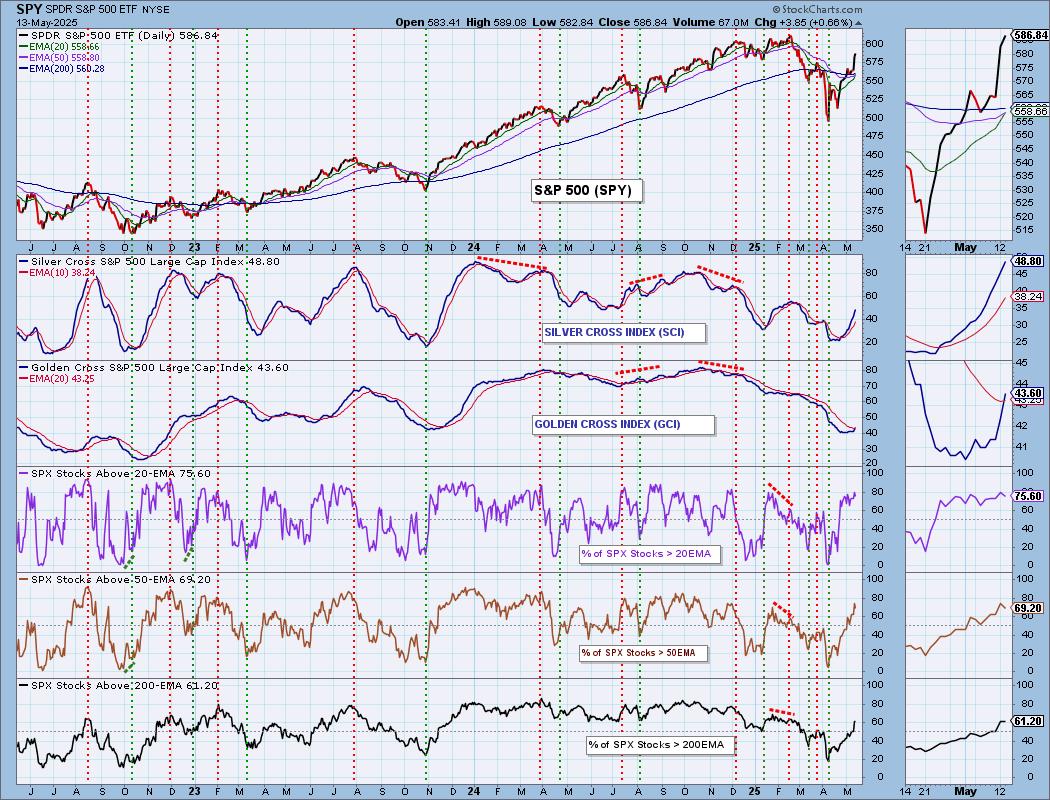
PARTICIPATION CHART (S&P 500): The following chart objectively shows the depth and trend of participation for the SPX in two time frames.
- Intermediate-Term - the Silver Cross Index (SCI) shows the percentage of SPX stocks on IT Trend Model BUY signals (20-EMA > 50-EMA). The opposite of the Silver Cross is a "Dark Cross" -- those stocks are, at the very least, in a correction.
- Long-Term - the Golden Cross Index (GCI) shows the percentage of SPX stocks on LT Trend Model BUY signals (50-EMA > 200-EMA). The opposite of a Golden Cross is the "Death Cross" -- those stocks are in a bear market.
The market bias is BULLISH in the intermediate term and long term.
The big news today is that the Golden Cross Index had a Bullish Shift across the signal line. This has moved the LT Bias to BULLISH. Participation did top out on today's rally which is not good, but the indicators didn't fall that far. Still, we would like to see expansion on a rally. Participation levels aren't quite overbought yet. The Silver Cross Index is rising strongly above its signal line so the IT Bias is BULLISH.
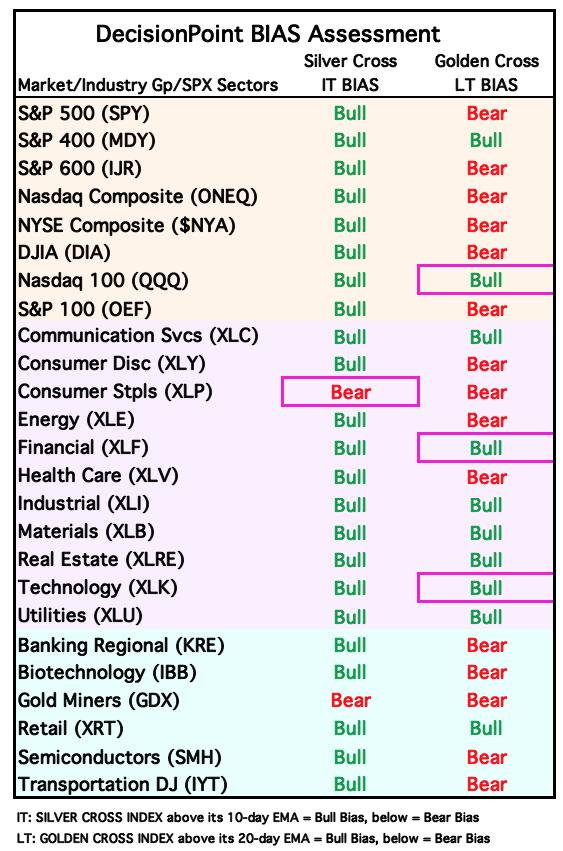
BIAS Assessment: The following table expresses the current BIAS of various price indexes based upon the relationship of the Silver Cross Index to its 10-day EMA (intermediate-term), and of the Golden Cross Index to its 20-day EMA (long-term). When the Index is above the EMA it is bullish, and it is bearish when the Index is below the EMA. The BIAS does not imply that any particular action should be taken. It is information to be used in the decision process.
The items with highlighted borders indicate that the BIAS changed today.
*****************************************************************************************************
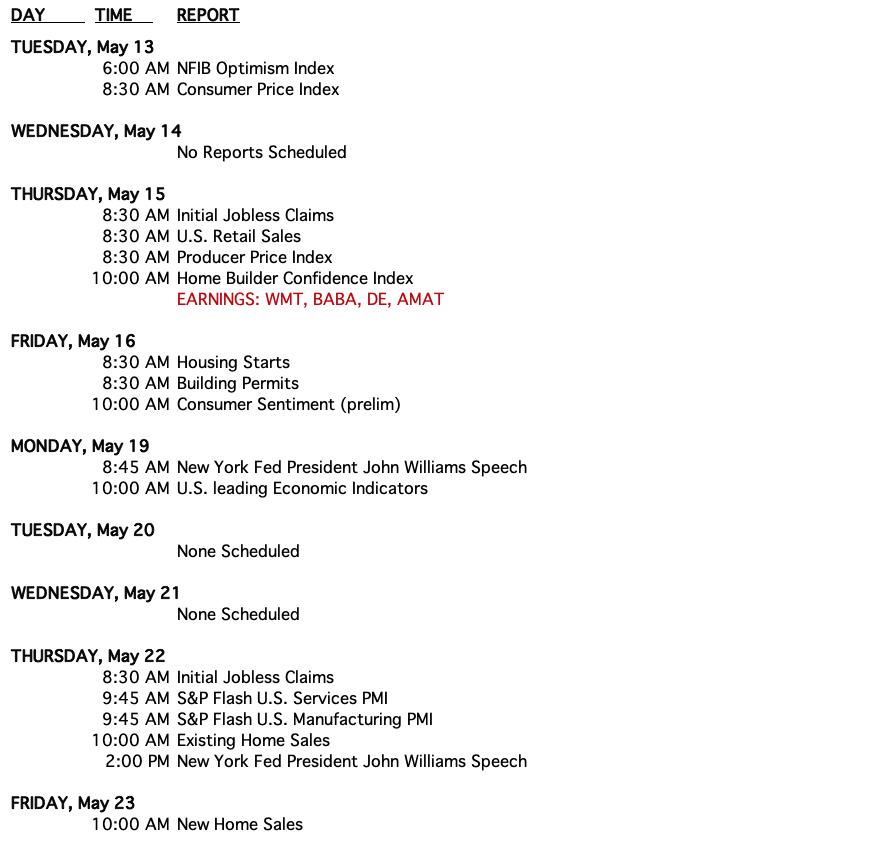
CONCLUSION: We've had two upside exhaustion climaxes and neither panned out. This is sign of a very robust market. The VIX is still worrisome as it clings to its upper Bollinger Band. We also know that the NYSE is not performing as well as the SPY and that suggests mega-caps and not the broad market are the main beneficiaries of this market. That will keep it moving higher. STOs/ITBM/ITVM and other indicators are rising and look bullish. We are due for an exhale so we still need to exercise some caution, but overall it looks good for the near term. Headlines are still a big driver for this market so we do need to be nimble. There are no economic reports tomorrow so we don't have to worry about that volatility.
Erin is 10% long, 0% short. (This is intended as information, not a recommendation.)
*****************************************************************************************************
CALENDAR
BITCOIN
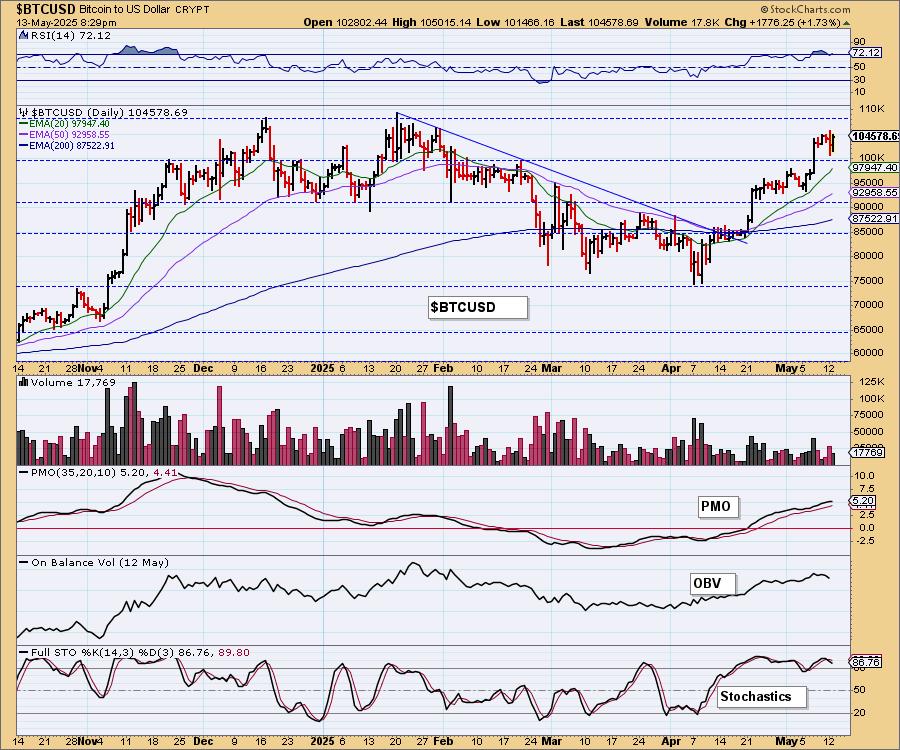
Bitcoin is holding up and with this new rising trend, we think there is more upside ahead, likely to new all-time highs. The RSI is overbought, but that generally isn't a problem for Bitcoin. The PMO looks very bullish but Stochastics did turn down so we could see some more sideways movement.
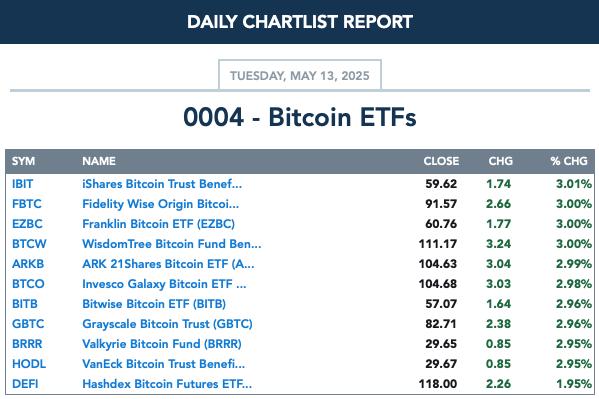
BITCOIN ETFs
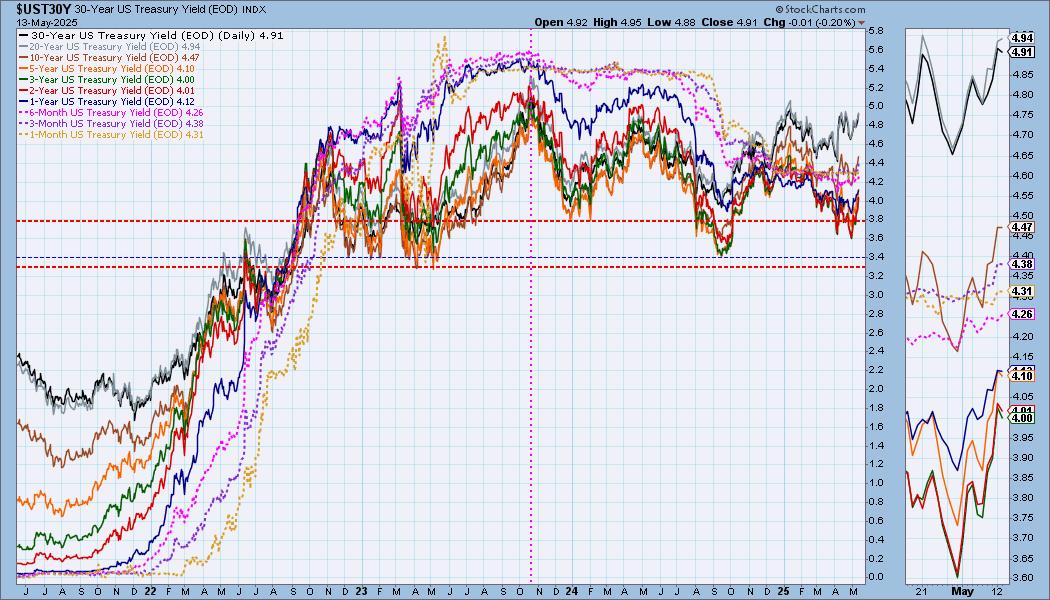
INTEREST RATES
Yields paused today, but we do expect them to resume their rise very soon.
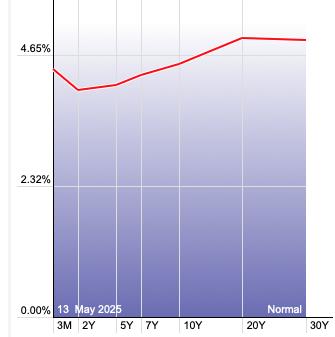
The Yield Curve Chart from StockCharts.com shows us the inversions taking place. The red line should move higher from left to right. Inversions are occurring where it moves downward.
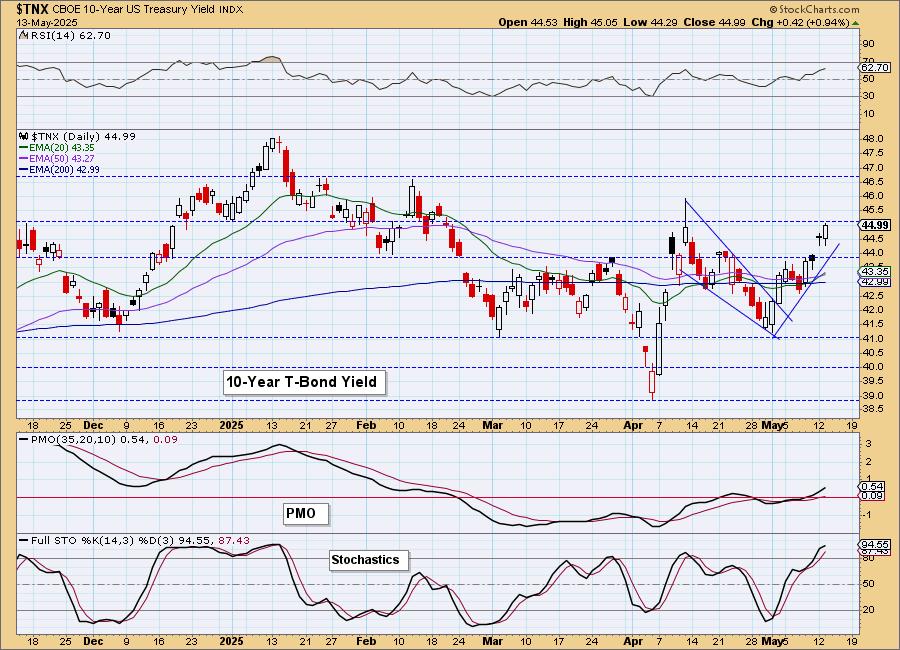
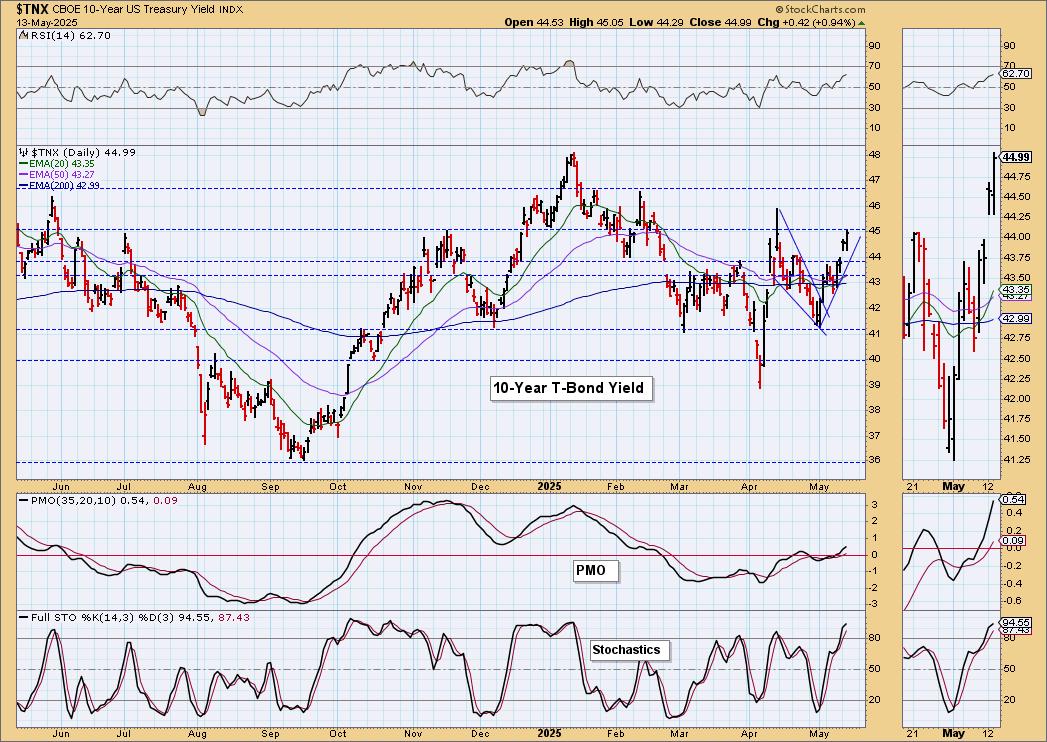
10-YEAR T-BOND YIELD
$TNX is moving higher and has established a strong rising trend. It is near overhead resistance, but given the positive indicators, we are expecting a breakout.
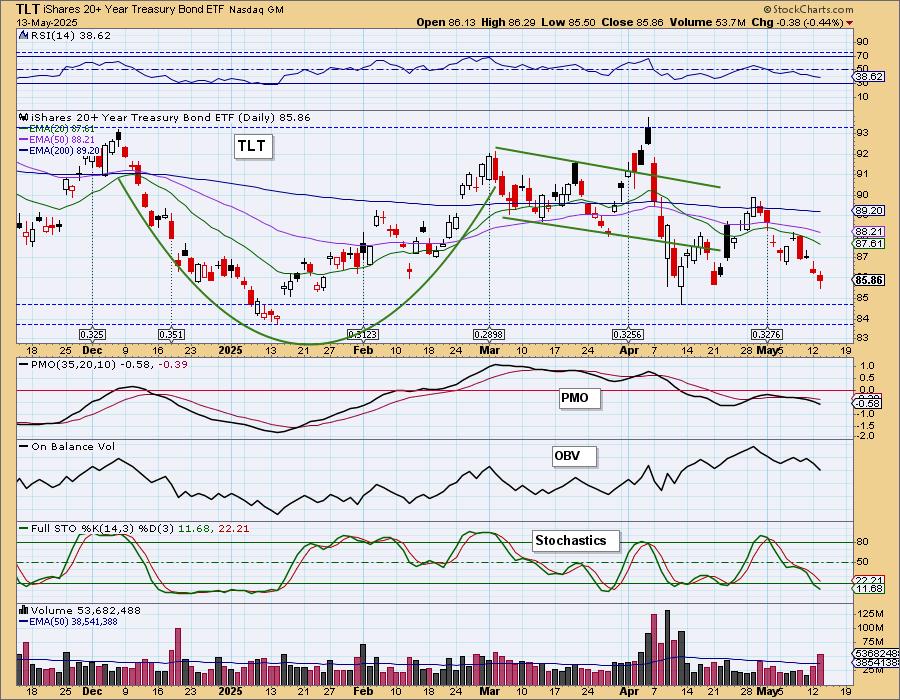
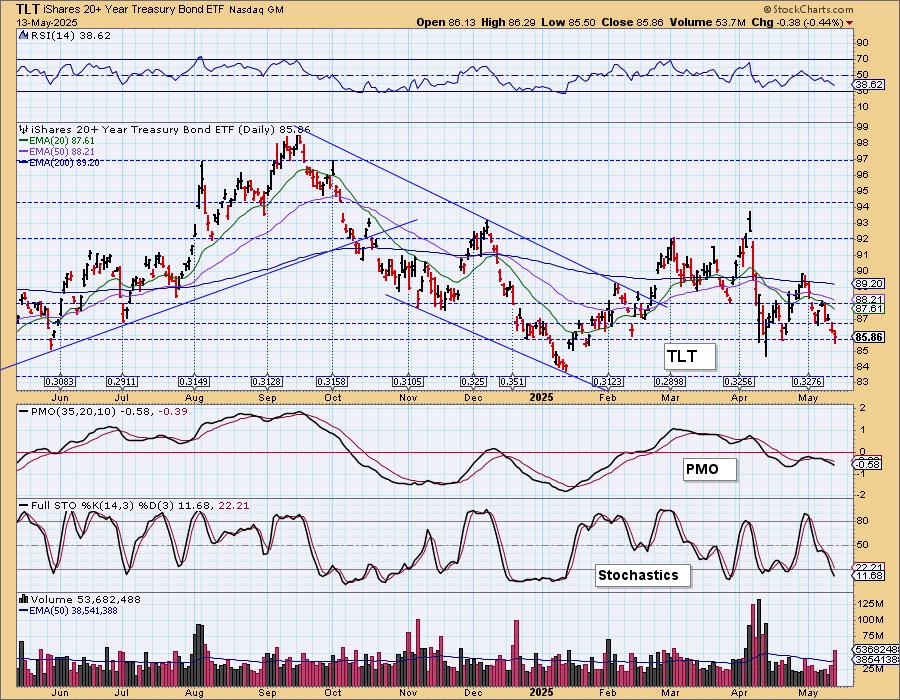
BONDS (TLT)
IT Trend Model: SELL as of 4/14/2025
LT Trend Model: SELL as of 12/13/2024
TLT Daily Chart: Bonds are struggling as yields continue to push higher. TLT is likely to hit support soon. The RSI is negative and the PMO is dropping below the zero line. Stochastics are extremely weak below 20.
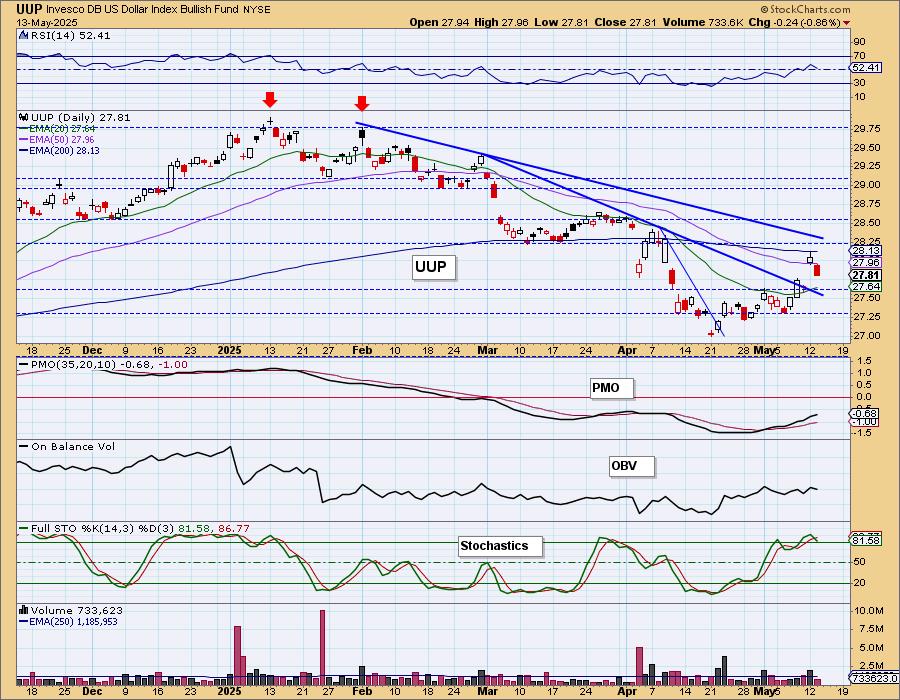
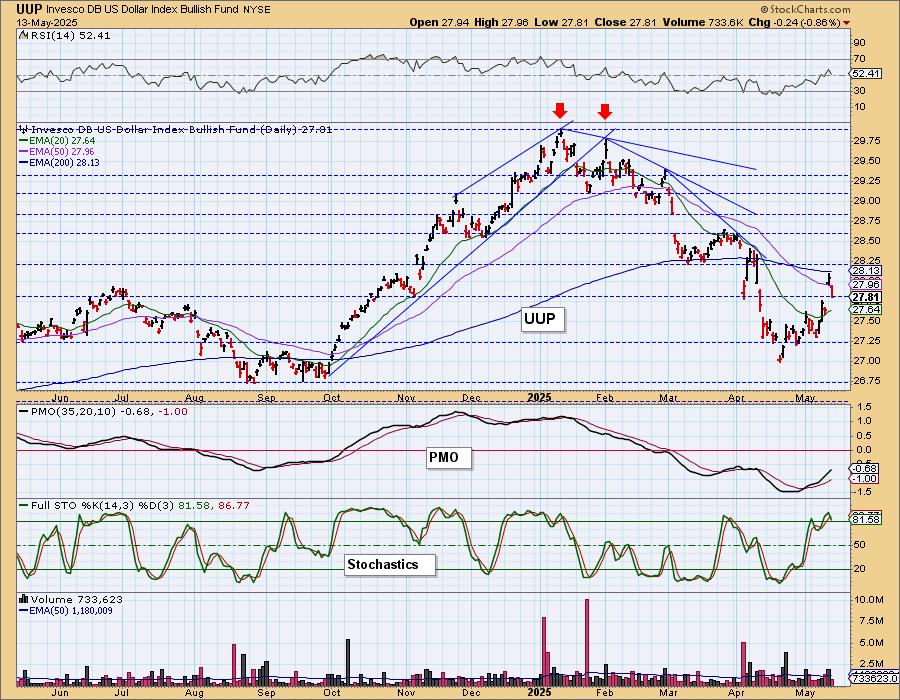
DOLLAR (UUP)
IT Trend Model: NEUTRAL as of 3/5/2025
LT Trend Model: SELL as of 4/25/2025
UUP Daily Chart: The Dollar pulled back today at the 200-day EMA. Resistance is still a problem, but we do expect this rally will continue given the rising PMO. Stochastics don't look very encouraging as they are in decline, but ultimately they are still above 80 and the signals strength.
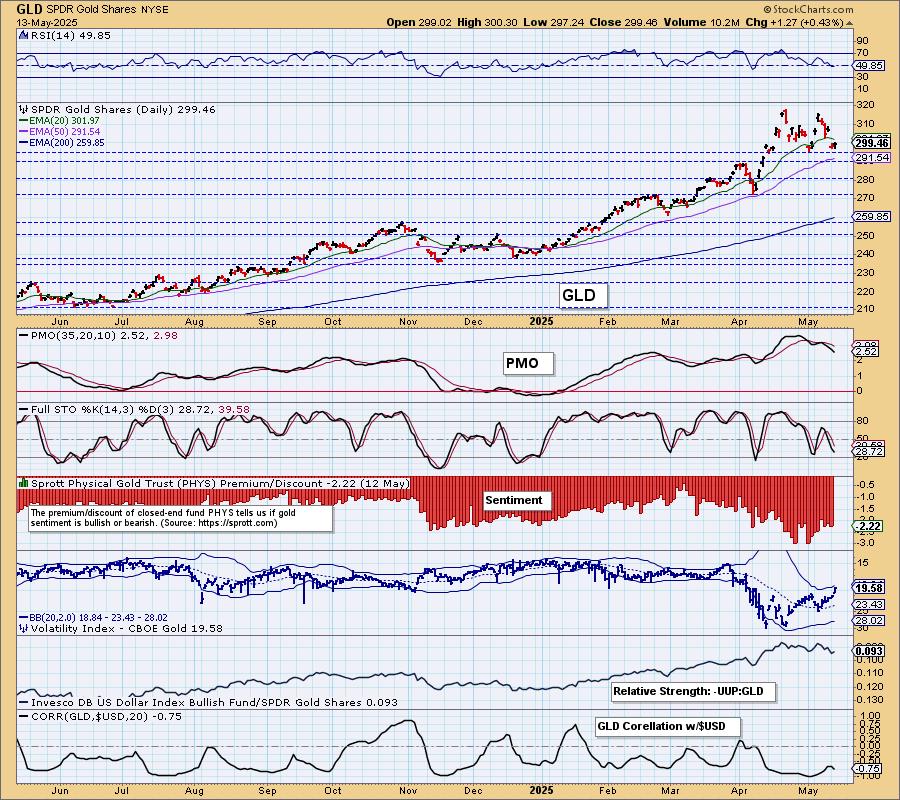
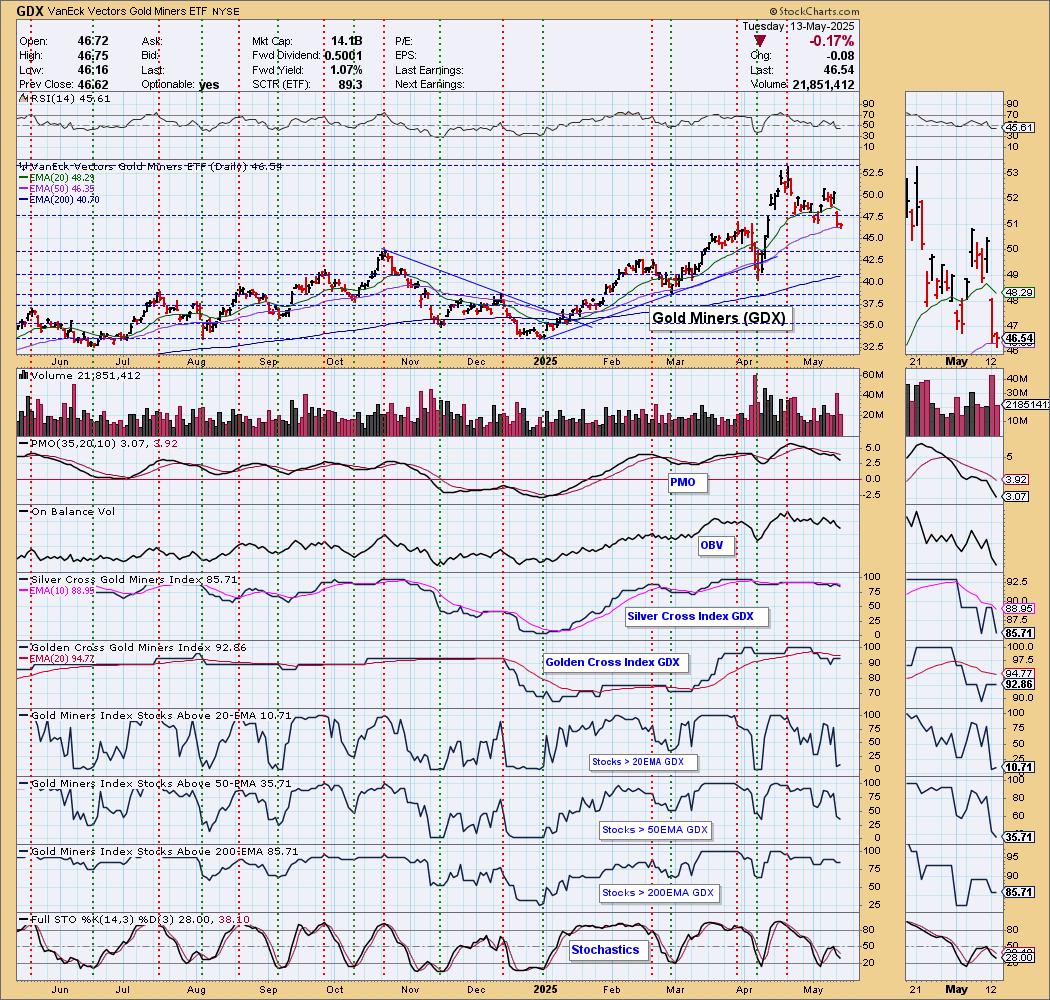
GOLD
IT Trend Model: BUY as of 1/10/2025
LT Trend Model: BUY as of 10/20/2023
GLD Daily Chart: Gold took advantage of the falling Dollar, but it was not up as high as the Dollar dropped. Given they are inversely correlated we should expect somewhat equal divergences from each other. This means that Gold showed weakness today. The double top suggests that Gold is likely to test support at the April low. This seems reasonable given the indicators.
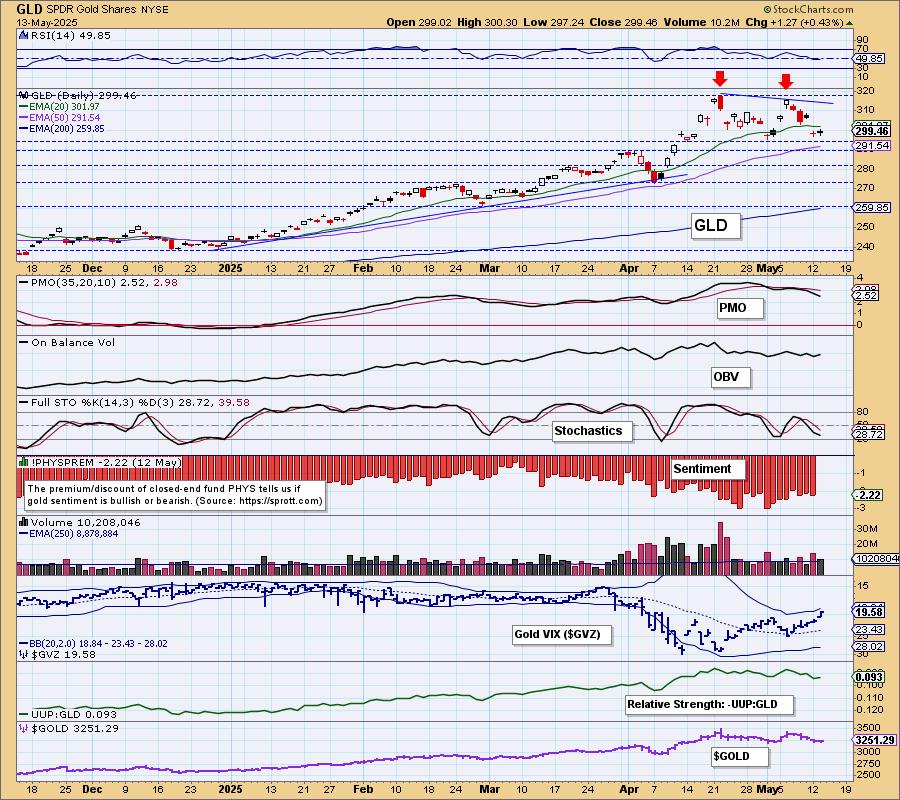
Gold is clearly showing relative weakness against the Dollar. The Dollar looks bullish and with the inverse correlation so strong, this will weigh heavy on Gold.
GOLD MINERS (GDX) Daily Chart: Gold Miners are in pullback mode and with Gold showing weakness, this is likely to continue. Support has been broken. GDX is still holding above the 50-day EMA, but barely. The PMO is accelerating downward so we should look for more downside. Participation is weak in the shorter term and Stochastics are falling alongside the PMO.
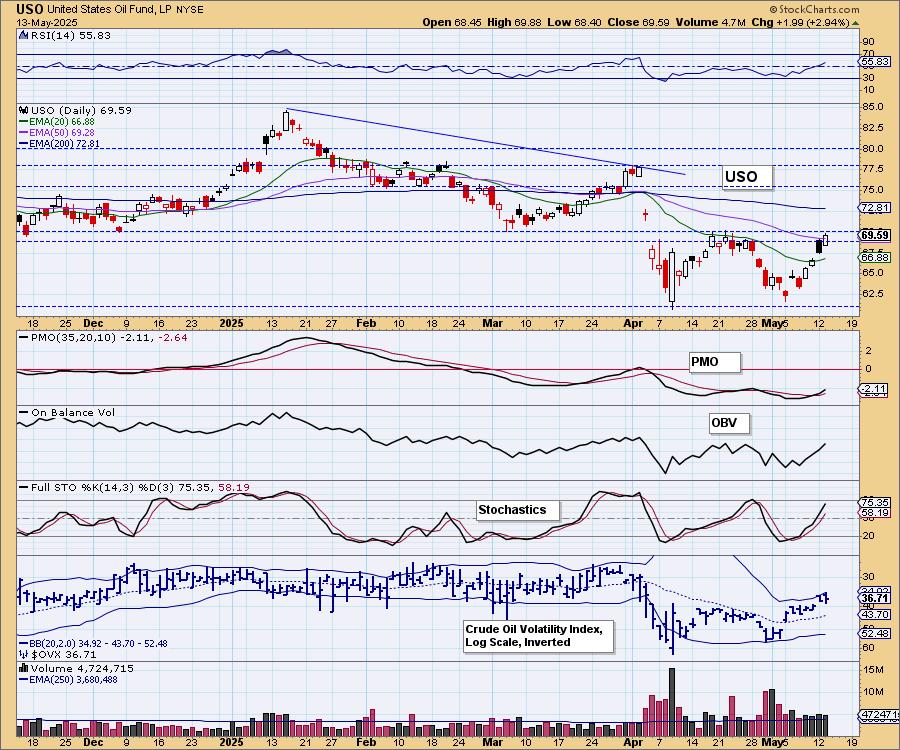
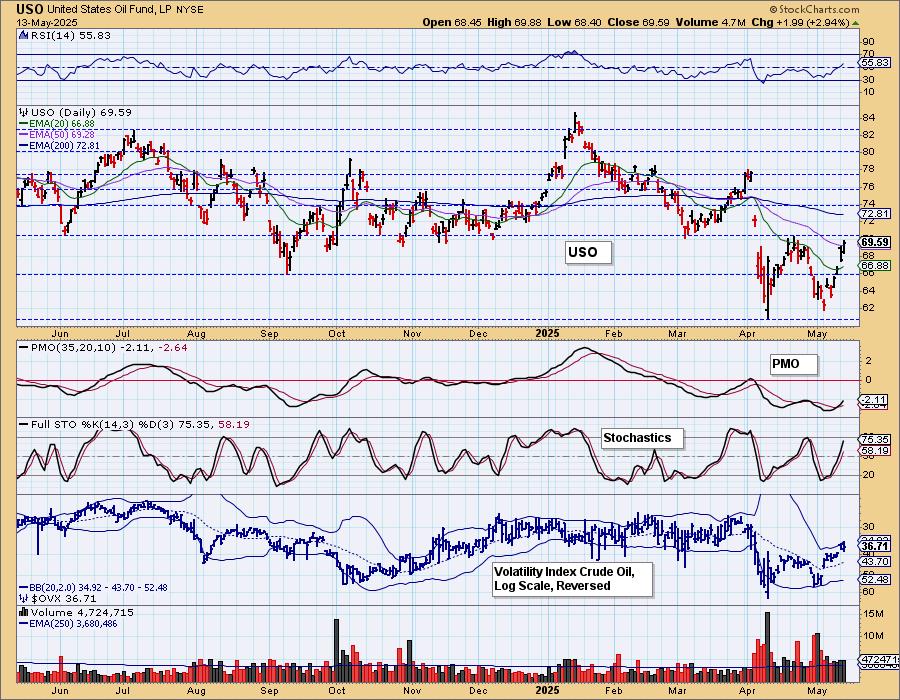
CRUDE OIL (USO)
IT Trend Model: NEUTRAL as of 2/27/2025
LT Trend Model: SELL as of 3/18/2025
USO Daily Chart: Crude has now hit overhead resistance and we believe it will likely pull back at this level. The indicators do look bullish, although the Crude Volatility Index ($OVX) is penetrating the upper Bollinger Band on the inverted scale and that does bolster our opinion that Crude is due to move down here.
Good Luck & Good Trading!
Erin Swenlin and Carl Swenlin
Technical Analysis is a windsock, not a crystal ball. --Carl Swenlin
(c) Copyright 2025 DecisionPoint.com
Disclaimer: This blog is for educational purposes only and should not be construed as financial advice. The ideas and strategies should never be used without first assessing your own personal and financial situation, or without consulting a financial professional. Any opinions expressed herein are solely those of the author, and do not in any way represent the views or opinions of any other person or entity.
DecisionPoint is not a registered investment advisor. Investment and trading decisions are solely your responsibility. DecisionPoint newsletters, blogs or website materials should NOT be interpreted as a recommendation or solicitation to buy or sell any security or to take any specific action.
NOTE: The signal status reported herein is based upon mechanical trading model signals, specifically, the DecisionPoint Trend Model. They define the implied bias of the price index based upon moving average relationships, but they do not necessarily call for a specific action. They are information flags that should prompt chart review. Further, they do not call for continuous buying or selling during the life of the signal. For example, a BUY signal will probably (but not necessarily) return the best results if action is taken soon after the signal is generated. Additional opportunities for buying may be found as price zigzags higher, but the trader must look for optimum entry points. Conversely, exit points to preserve gains (or minimize losses) may be evident before the model mechanically closes the signal.
Helpful DecisionPoint Links:
DecisionPoint Alert Chart List
DecisionPoint Golden Cross/Silver Cross Index Chart List
DecisionPoint Sector Chart List
Price Momentum Oscillator (PMO)