
With the market turning down today, ETF Scans didn't really produce. I found one of today's selections through the scans, but the other two come from the ETF Tracker. I suspect these should do well even with a market turn over, but set some stops to be safe.
Two of today's selections didn't need deep stops in my opinion so it does offer you a possible investment without quite as much risk as a deep stop holds.
Good Luck & Good Trading,
Erin
Today's "Diamonds in the Rough": GDX, MOO and SIVR.

Diamond Mine Trading Room:
RECORDING & DOWNLOAD LINK (5/16/2025):
Topic: DecisionPoint Diamond Mine (5/16/2025) LIVE Trading Room
Download & Recording Link
Passcode: May#16th
REGISTRATION for 5/23/2025:
When: May 23, 2025 09:00 AM Pacific Time (US and Canada)
Topic: DecisionPoint Diamond Mine LIVE Trading Room
Register in advance for this webinar HERE
After registering, you will receive a confirmation email containing information about joining the webinar.
Welcome to DecisionPoint Diamonds, wherein I highlight ten "Diamonds in the Rough" per week. These are selected from the results of my DecisionPoint Scans which search for stocks that could benefit from the trend and condition of the market. Remember, these are not recommendations to buy or sell, but are the most interesting of the stocks that surfaced in my scans. My objective is to save you the work of the initial, tedious culling process, but you need to apply your own analysis to see if these stocks pique your interest as well. There are no guaranteed winners here!
"Predefined Scans Triggered" are taken from StockCharts.com using the "Symbol Summary" option instead of a "SharpChart" on the workbench.
Stop levels are all rounded down.
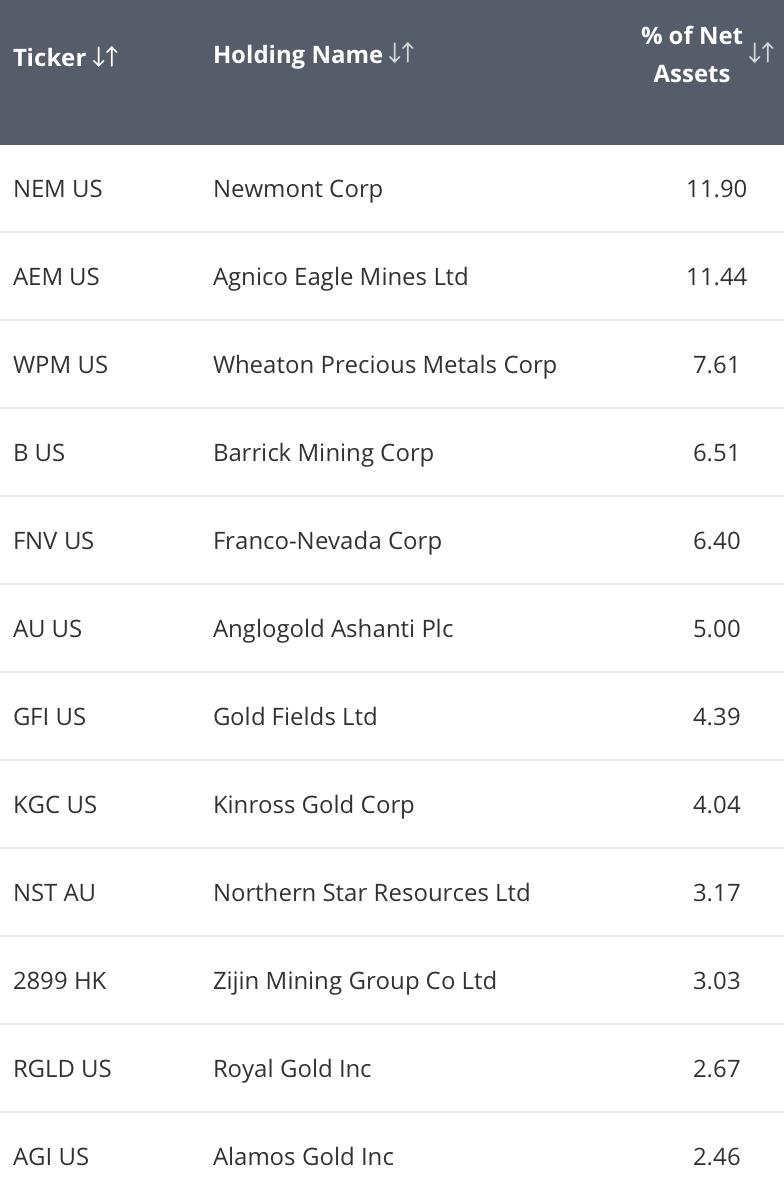
VanEck Vectors Gold Miners ETF (GDX)
EARNINGS: N/A
GDX tracks a market-cap-weighted index of global gold-mining firms. Click HERE for more information.
Predefined Scans Triggered: None.
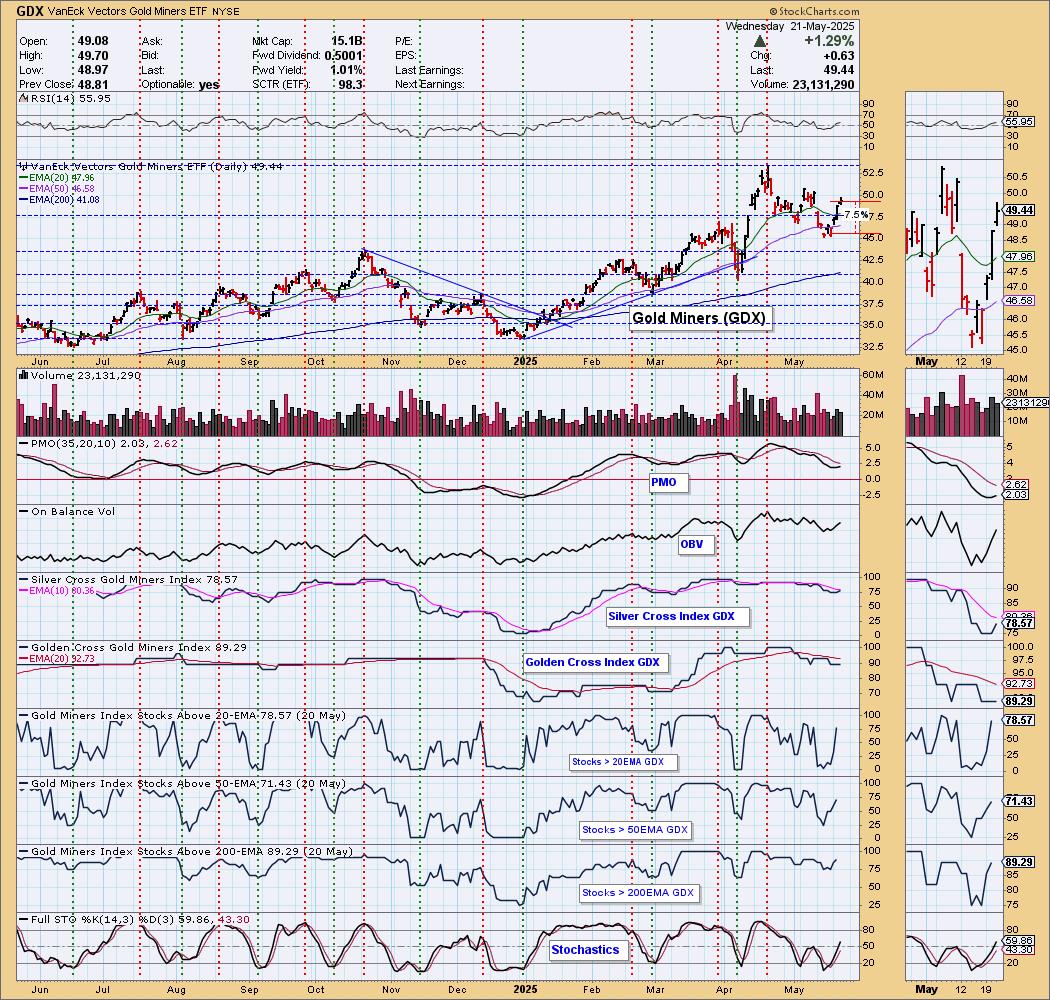
GDX is down -0.06% in after-hours trading. It is still in a declining trend, but the Dollar is wavering and that will mean good things for Gold and Miners. This also looks very much like a flag formation. The RSI is positive and the PMO has turned back up above the zero line. Participation has healed and should support more upside. The Silver Cross Index is back to rising again. Stochastics look very bullish. The stop needs to be a bit deep as these guys are volatile. I've opted to set it beneath the 50-day EMA at 7.5% or $45.73.
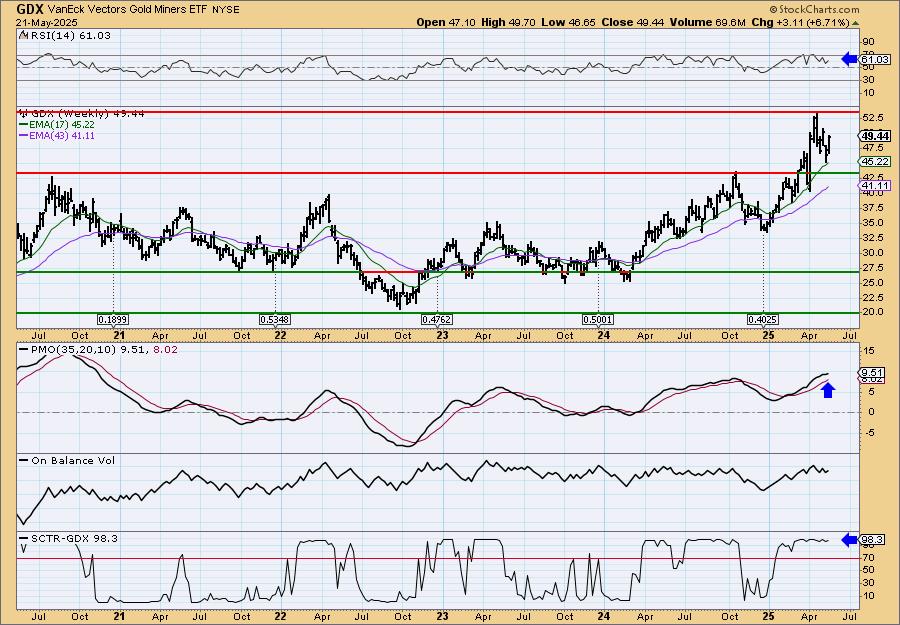
We have a strong breakout from a prior trading range. The weekly RSI is positive and not overbought despite the lengthy rally. The weekly PMO is still on the rise. The StockCharts Technical Rank (SCTR) is at the top of the hot zone*. Consider a 17% upside target to about $57.84.
*If a stock is in the "hot zone" above 70, it implies that it is stronger than 70% of its universe (large-, mid-, small-caps and ETFs) primarily in the intermediate to long terms.
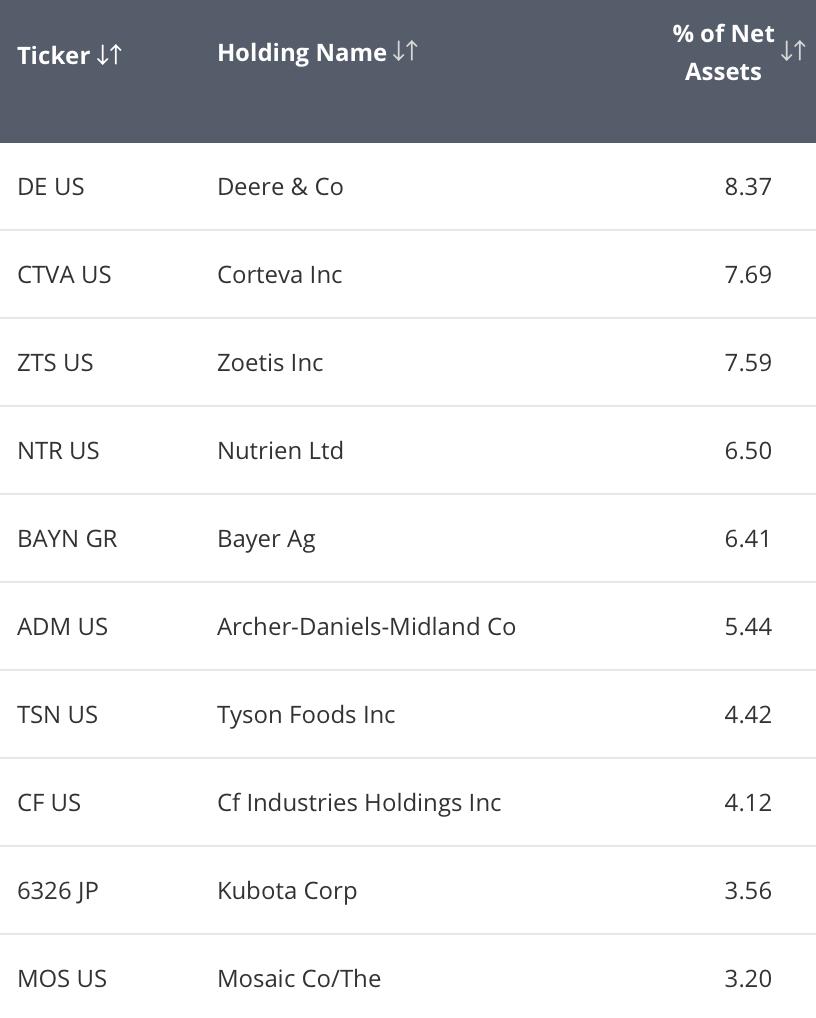
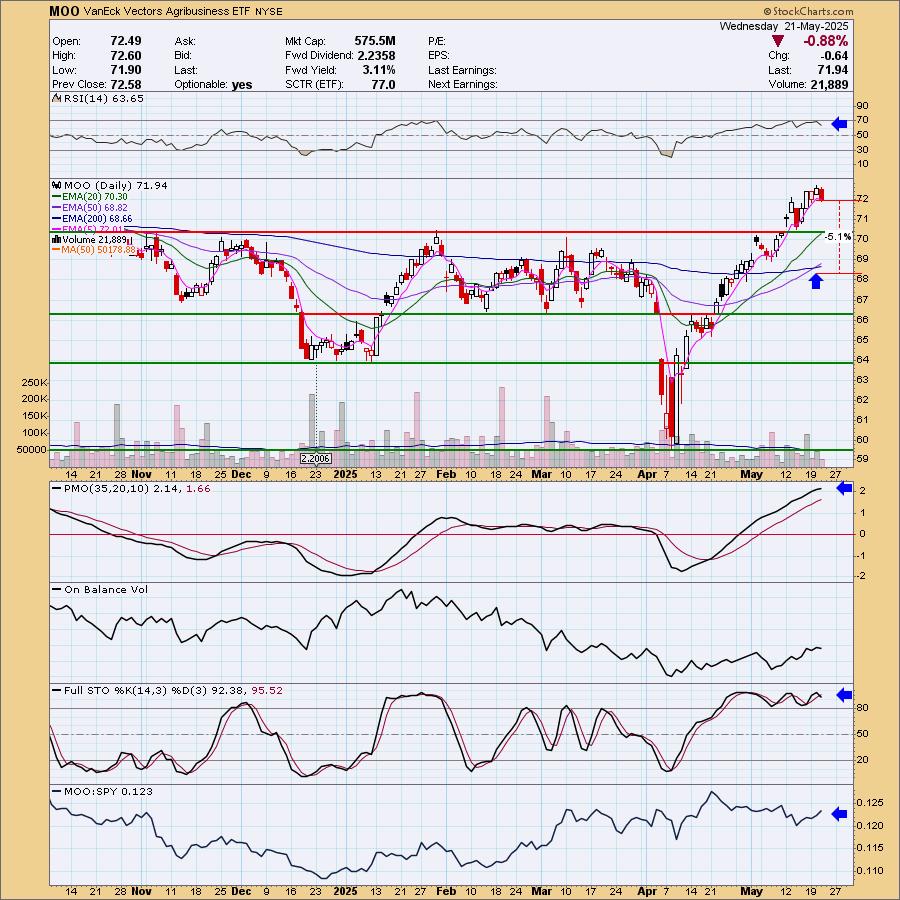
VanEck Vectors Agribusiness ETF (MOO)
EARNINGS: N/A
MOO tracks a market-cap-weighted index of companies that generate revenues from the agribusiness sector. Click HERE for more information.
Predefined Scans Triggered: P&F Triple Top Breakout, P&F Quadruple Top Breakout and P&F Double Top Breakout.
MOO is down -0.08% in after-hours trading. I like the breakout here and the strong rising trend. We also have a new Golden Cross of the 50/200-day EMAs. The RSI is not overbought despite this lengthy rally so more upside can be accommodated. The PMO is rising strongly well above the zero line. Stochastics did top, but they remain above 80 which is very bullish. We can see that MOO is beginning to outperform the SPY right now. The stop is set thinly below the 200-day EMA at 5.1% or $68.27.
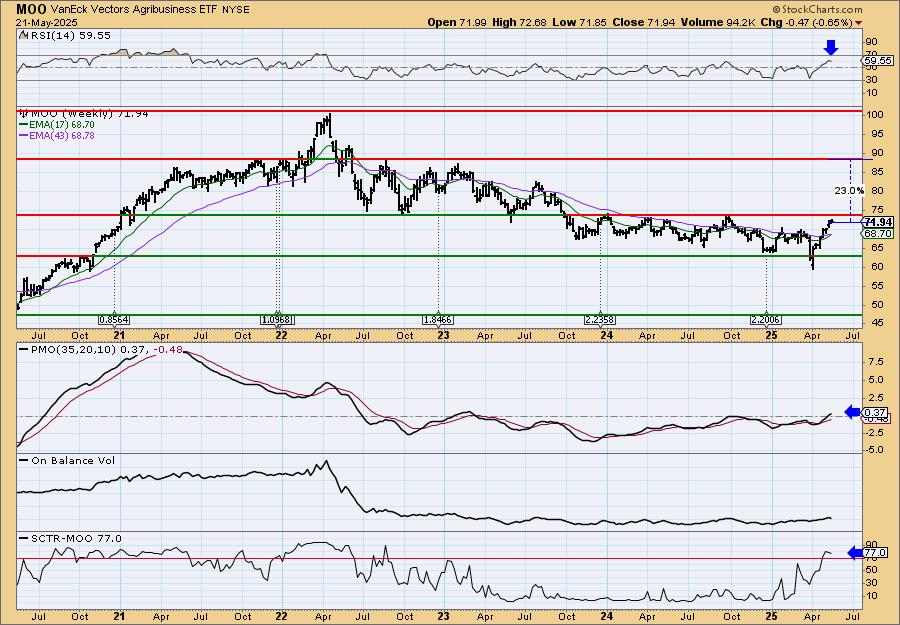
We are getting close to overhead resistance, but the weekly RSI isn't overbought yet so I think we should see a breakout. The weekly PMO is rising and just hit positive territory on a Crossover BUY Signal. The SCTR is well within the hot zone above 70.
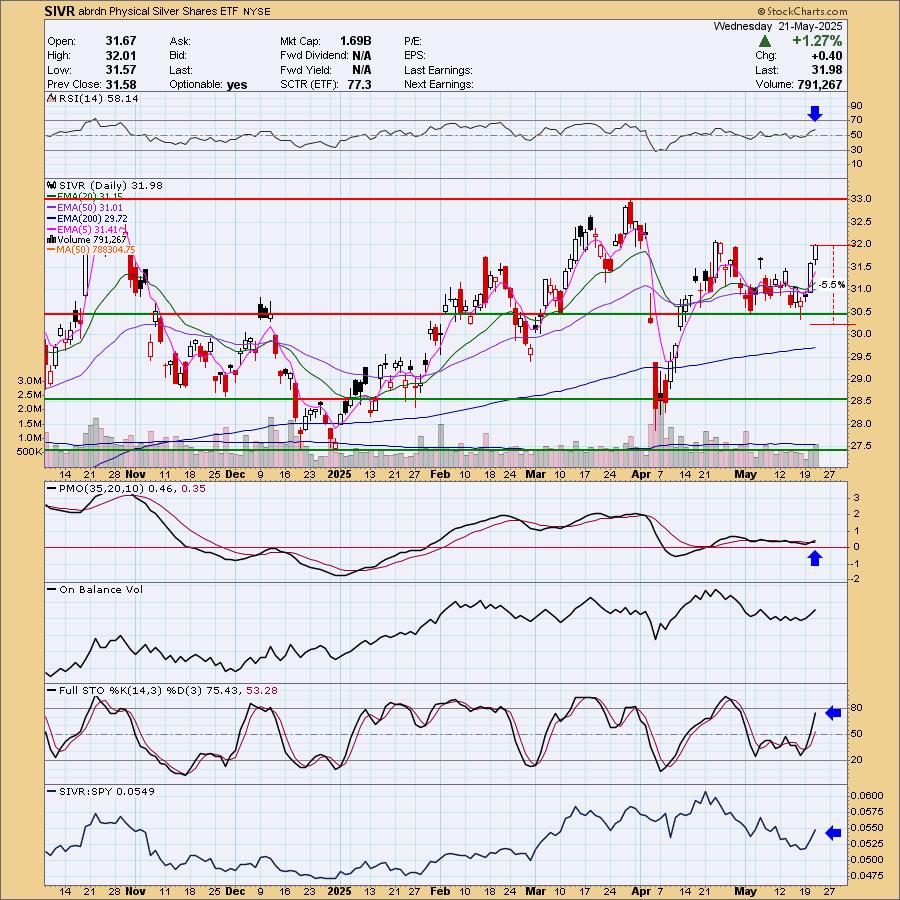
abrdn Physical Silver Shares ETF (SIVR)
EARNINGS: N/A
SIVR tracks the silver spot price, less trust expenses, using silver bullion. Click HERE for more information.
Predefined Scans Triggered: Stocks in a New Downtrend (Aroon) and New CCI Buy Signals.
SIVR is unchanged in after hours trading. This is the only one I liked from the Diamond Scans today. Given I'm bearish on the Dollar right now, I would expect Gold and Silver to benefit. I like this one because they own physical Silver. Similarly I like IAU versus GLD. The declining trend has been broken. The RSI is positive and not overbought. The PMO has just triggered a new Crossover BUY Signal. Volume is coming in. Stochastics are rising strongly and you can see that Silver is outperforming the SPY right now. The stop doesn't need to be set deep in my opinion. I'd be less enthused by the metal should it lose support. Therefore I set the stop at 5.5% or $30.22.
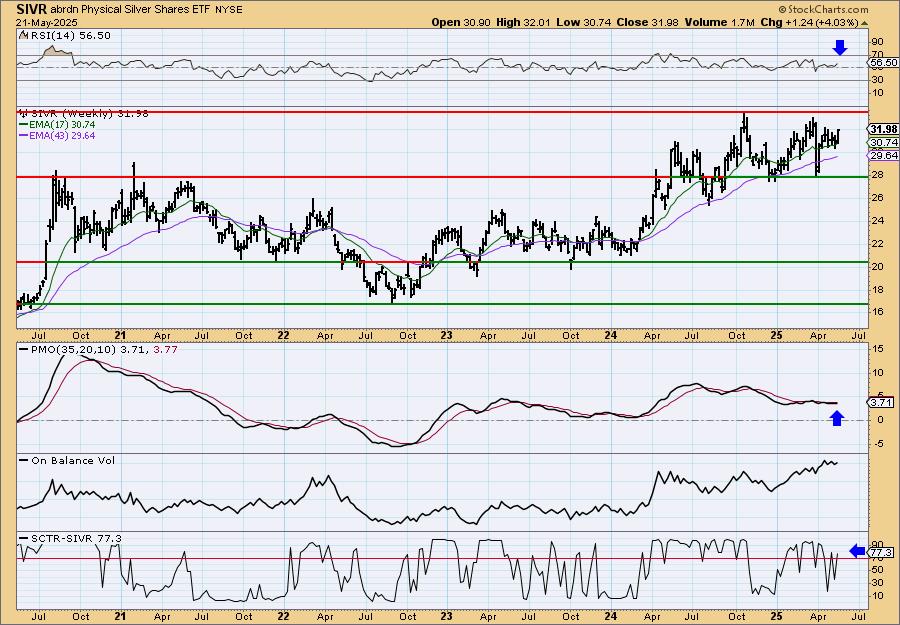
SIVR did break from a long-term trading channel and has now basically formed another channel. I think both Gold and Silver will break out soon. The weekly RSI is positive and the weekly PMO is nearing a Crossover BUY Signal. The SCTR has just reentered the hot zone. Consider a 17% upside target to $37.42.
Don't forget, on Thursdays I look at reader-requested symbols, click HERE to send me an email. I read every email I receive and try to answer them all!
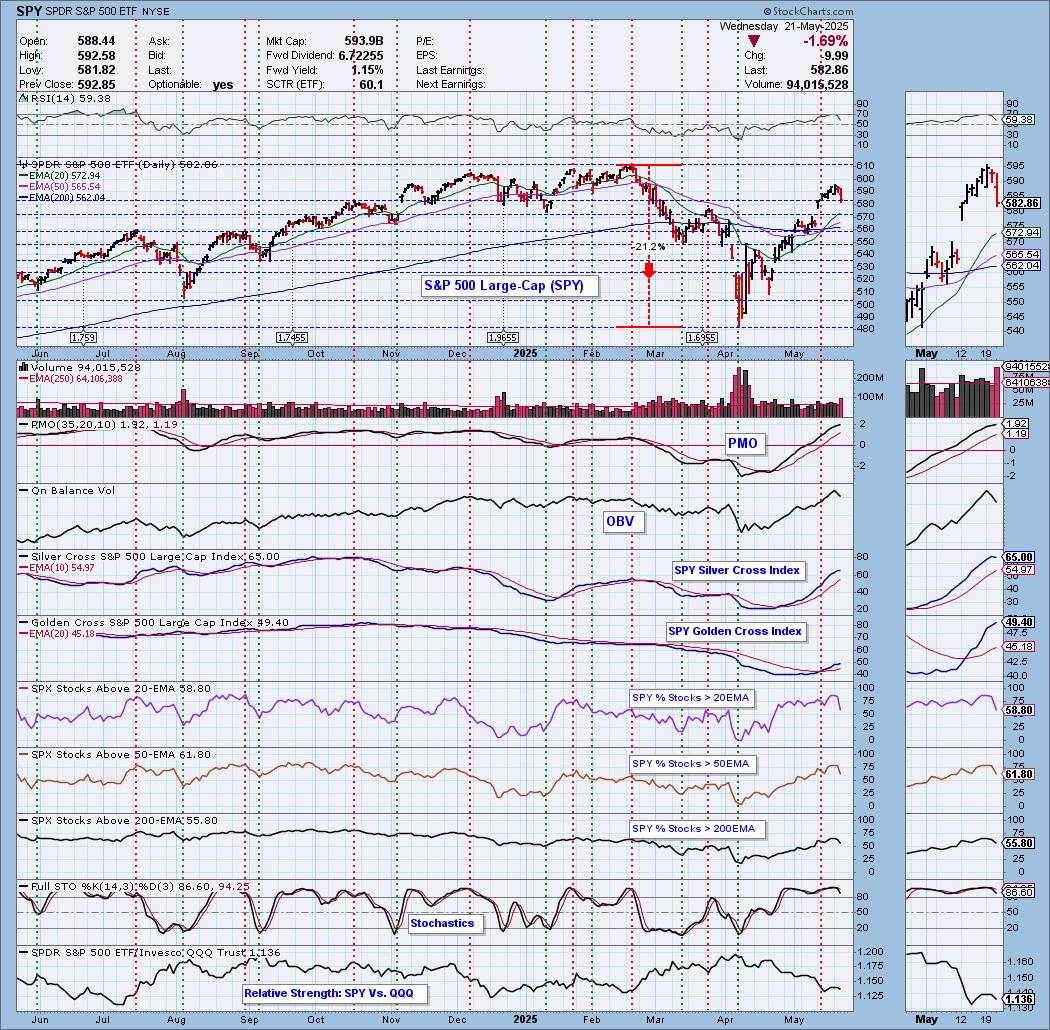
Current Market Outlook:
Market Environment: It is important to consider the odds for success by assessing the market tides. The following chart uses different methodologies for objectively showing the depth and trend of participation for intermediate- and long-term time frames.
- The Silver Cross Index (SCI) shows the percentage of SPX stocks on IT Trend Model BUY signals (20-EMA > 50-EMA)
- The Golden Cross Index (GCI) shows the percentage of SPX stocks on LT Trend Model BUY signals (50-EMA > 200-EMA)
Don't forget that as a "Diamonds" member, you have access to our "Under the Hood" curated ChartList on DecisionPoint.com. You'll find it under "Members Only" links on the left side on the Blogs and Links Page.
Here is the current chart:
Full Disclosure: I am 70% long, 0% short.
I'm required to disclose if I currently own a stock I mention and/or may buy/short it within the next 72 hours.
"Technical Analysis is a windsock, not a crystal ball." - Carl Swenlin
(c) Copyright 2025 DecisionPoint.com
Watch the latest episode of DecisionPoint Trading Room with Carl Swenlin & Erin Swenlin Mondays on the DecisionPoint YouTube channel here!
NOTE: The stocks reported herein are from mechanical trading model scans that are based upon moving average relationships, momentum and volume. DecisionPoint analysis is then applied to get five selections from the scans. The selections given should prompt readers to do a chart review using their own analysis process. This letter is not a call for a specific action to buy, sell or short any of the stocks provided. There are NO sure things or guaranteed returns on the daily selection of "Diamonds in the Rough."
Regarding BUY/SELL Signals: The signal status reported herein is based upon mechanical trading model signals and crossovers. They define the implied bias of the price index/stock based upon moving average relationships and momentum, but they do not necessarily call for a specific action. They are information flags that should prompt chart review. Further, they do not call for continuous buying or selling during the life of the signal. For example, a BUY signal will probably (but not necessarily) return the best results if action is taken soon after the signal is generated. Additional opportunities for buying may be found as price zigzags higher, but the trader must look for optimum entry points. Conversely, exit points to preserve gains (or minimize losses) may be evident before the model mechanically closes the signal.
Helpful DecisionPoint Links:
Price Momentum Oscillator (PMO)
Swenlin Trading Oscillators (STO-B and STO-V)
For more links, go to DecisionPoint.com